Reports 1-1 of 1 Clear search Modify search
VIS (General)
yoshinori.fujii - 21:21 Tuesday 20 November 2018 (7059) Print this report
Geophone calibration, noise measurement

Log on Nov. 16th, 2018
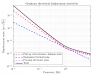
= Calibration =
-- Following same manner with klog6998, geophones in the below were calibrated. (Actually I did not uploaded the calibration results about the geophones for SR3 suspension which had done in this July..)
-- the parameters obtained by this calibration business are summarized in the below.
-- Details on the calibration plots will be followed soon.

== SR3 ==

geo_name Ge [V/(m/s)] f0 [Hz] eta
geo-1 251.04 1.154 0.5165
geo-2 258.14 1.214 0.5063
geo-3 258.51 1.154 0.5695


== SR2 ==

geo_name Ge [V/(m/s)] f0 [Hz] eta
geo-4 264.86 1.094 0.6022
geo-5 (reference) 267.535 1.193 0.5559
geo-6 269.65 1.401 0.4383


==  SRM==
-- These were measured before closing the flanges for a sanity check.

geo_name Ge [V/(m/s)] f0 [Hz] eta
geo-19 257.64 1.135 0.6049
geo-20 262.65 0.95 0.7513
geo-22 253.08 1.091 0.5836


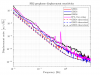
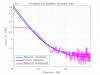
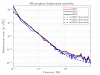
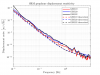
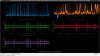
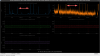
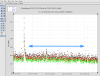
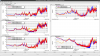
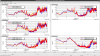
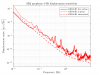
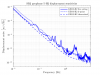
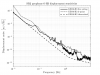
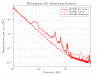
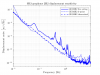
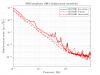
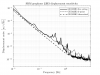
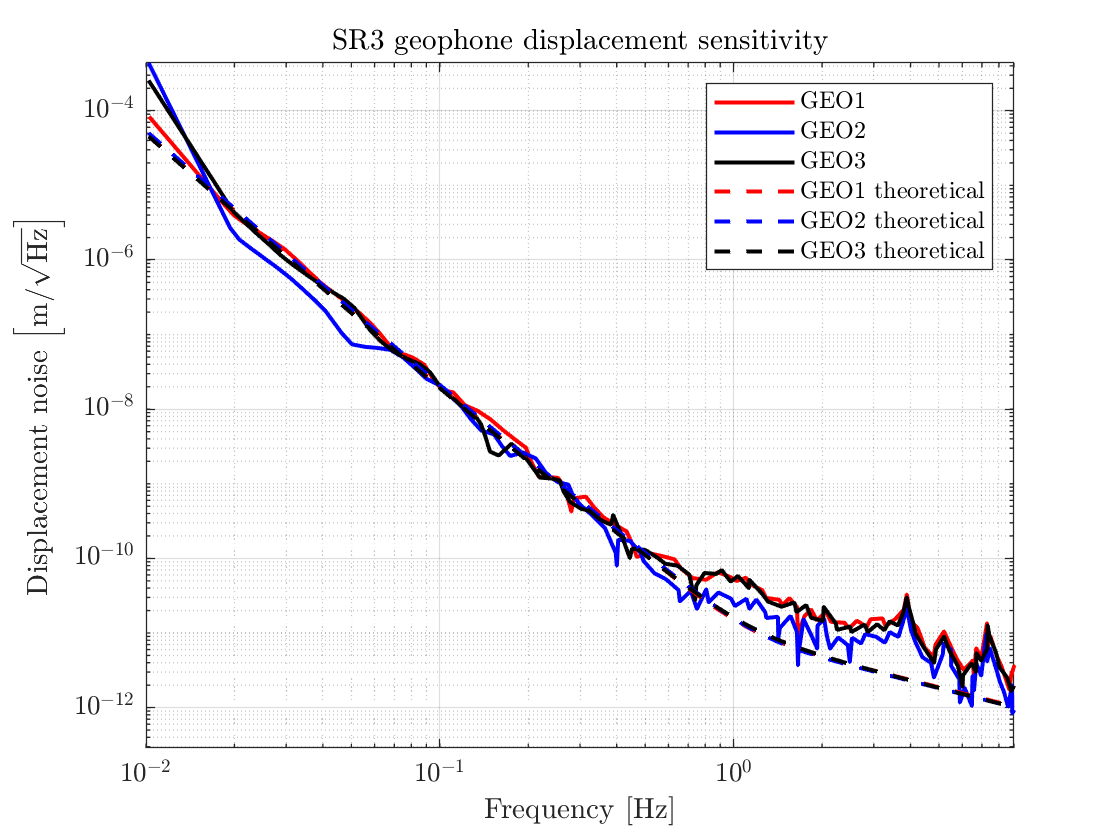
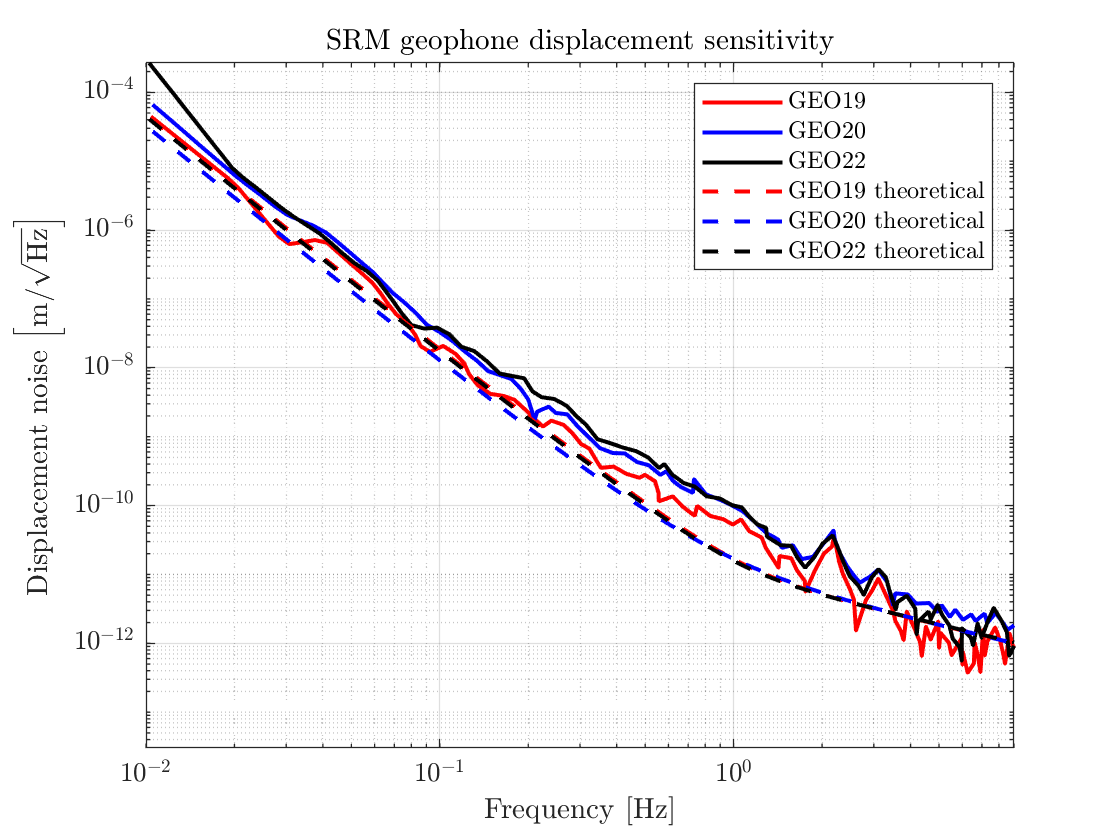
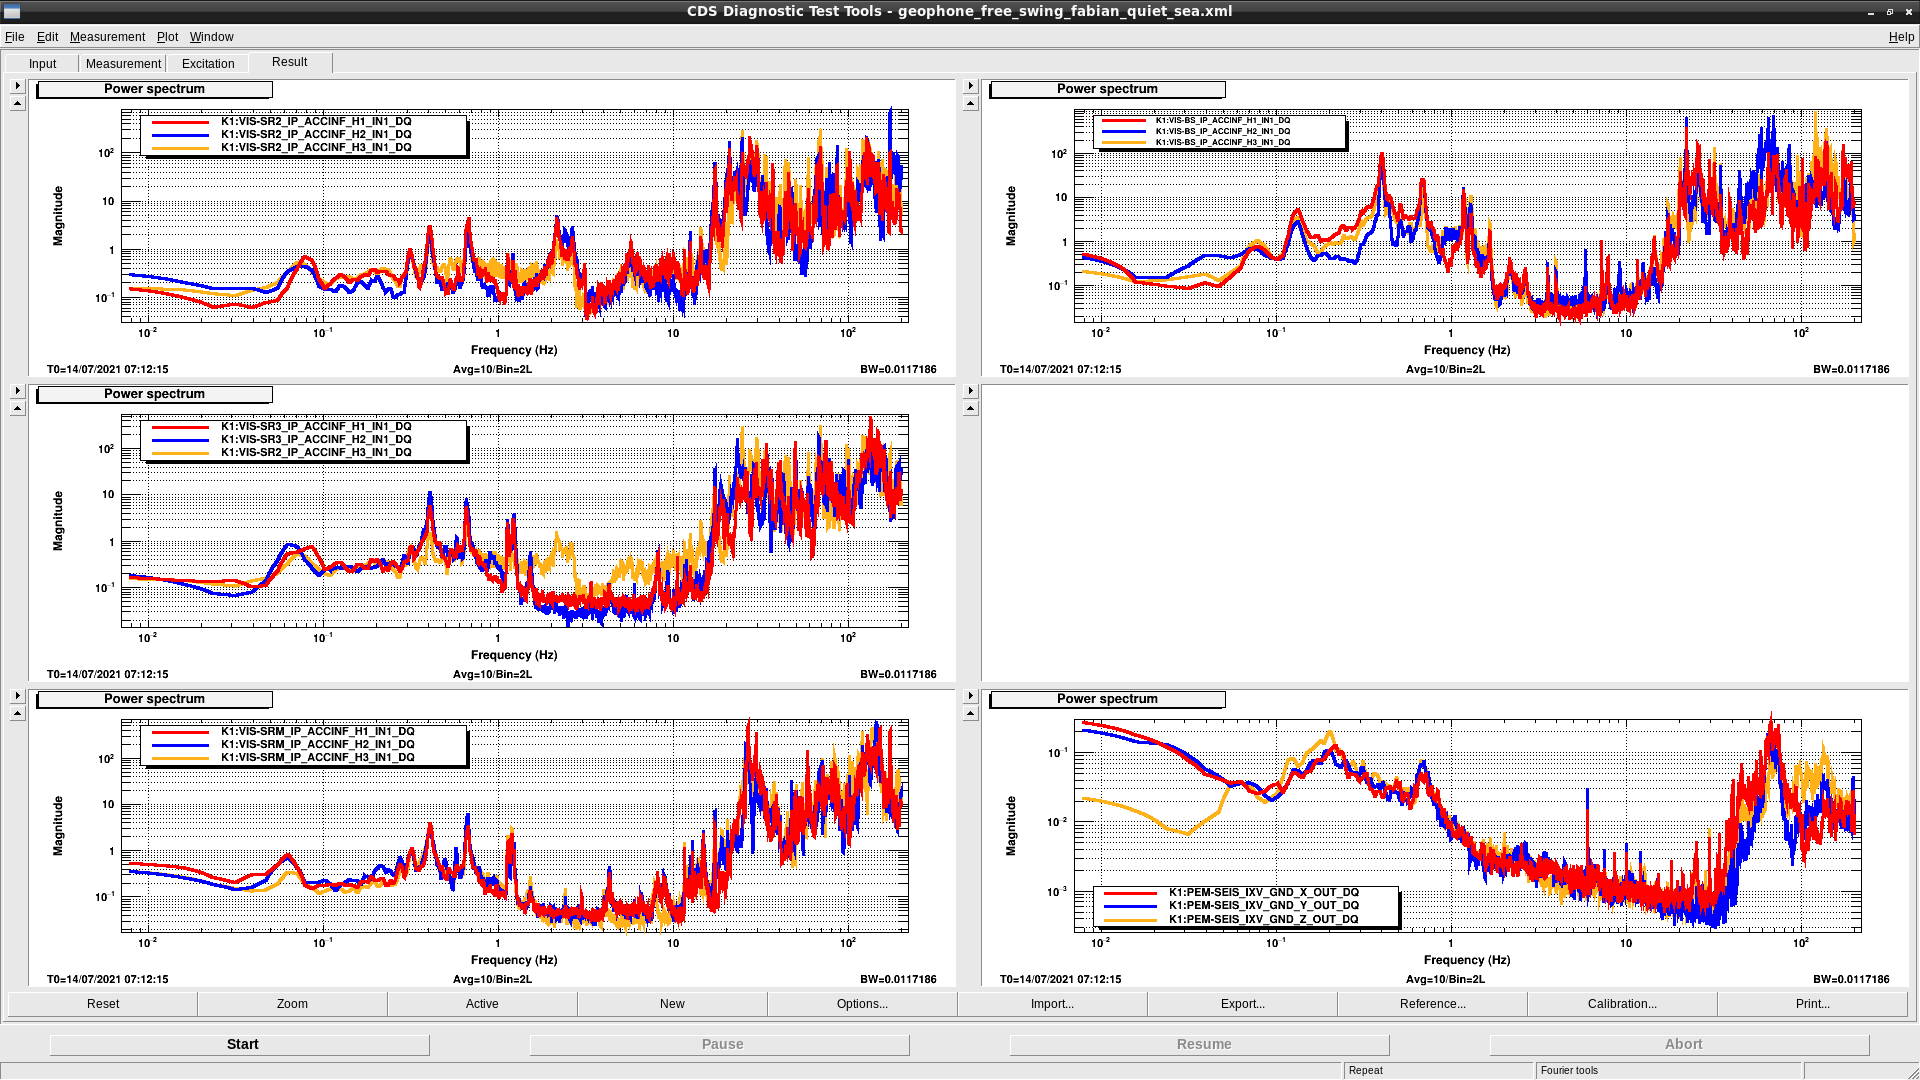
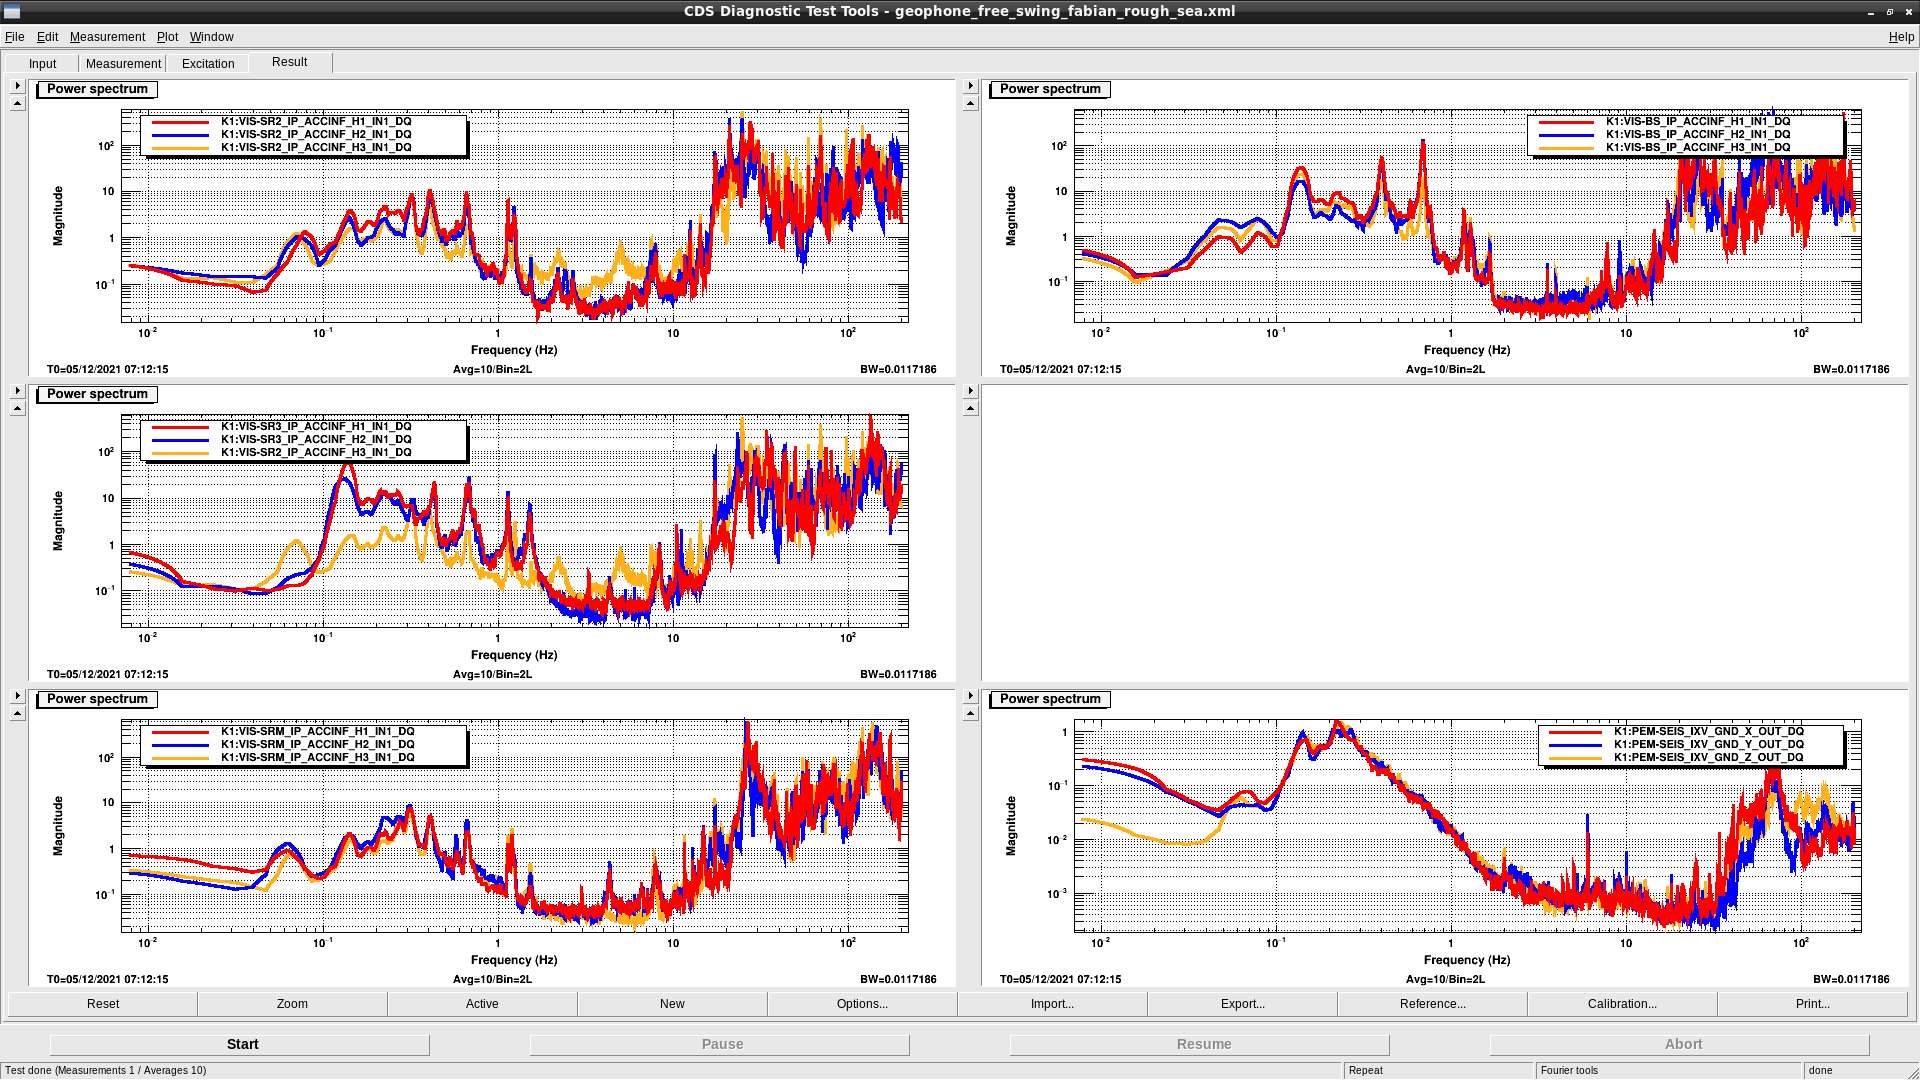
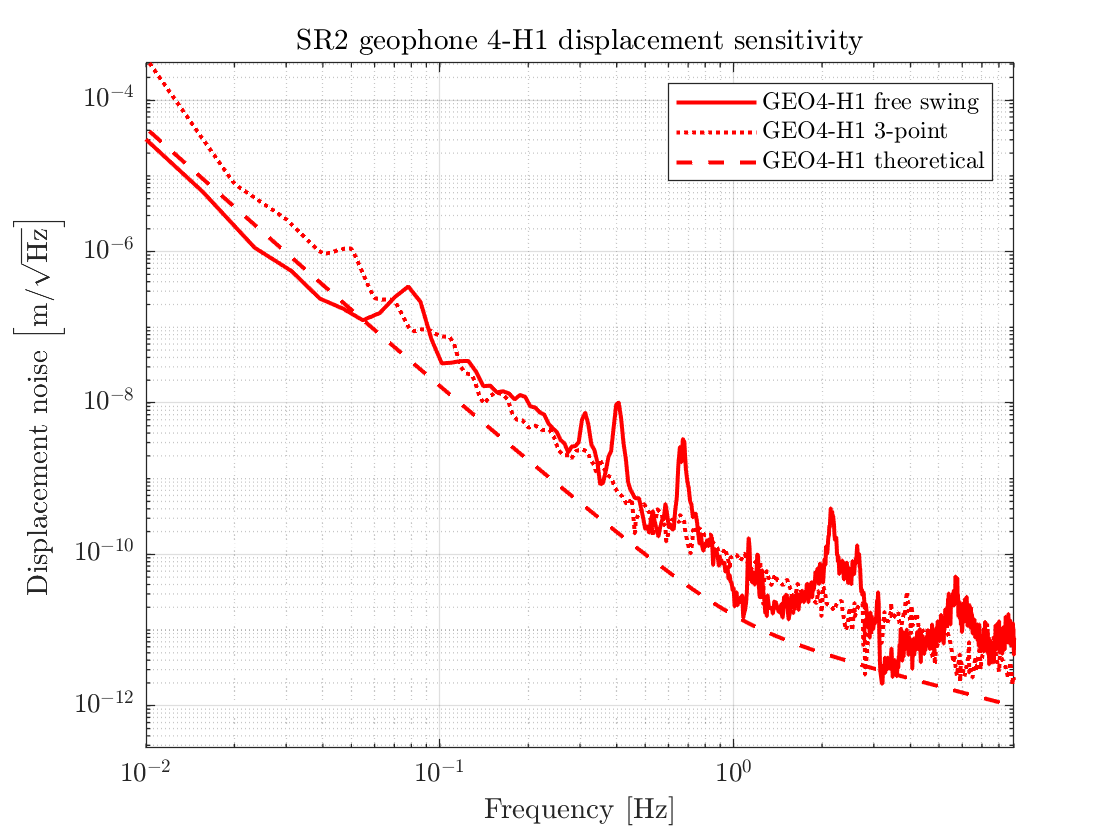
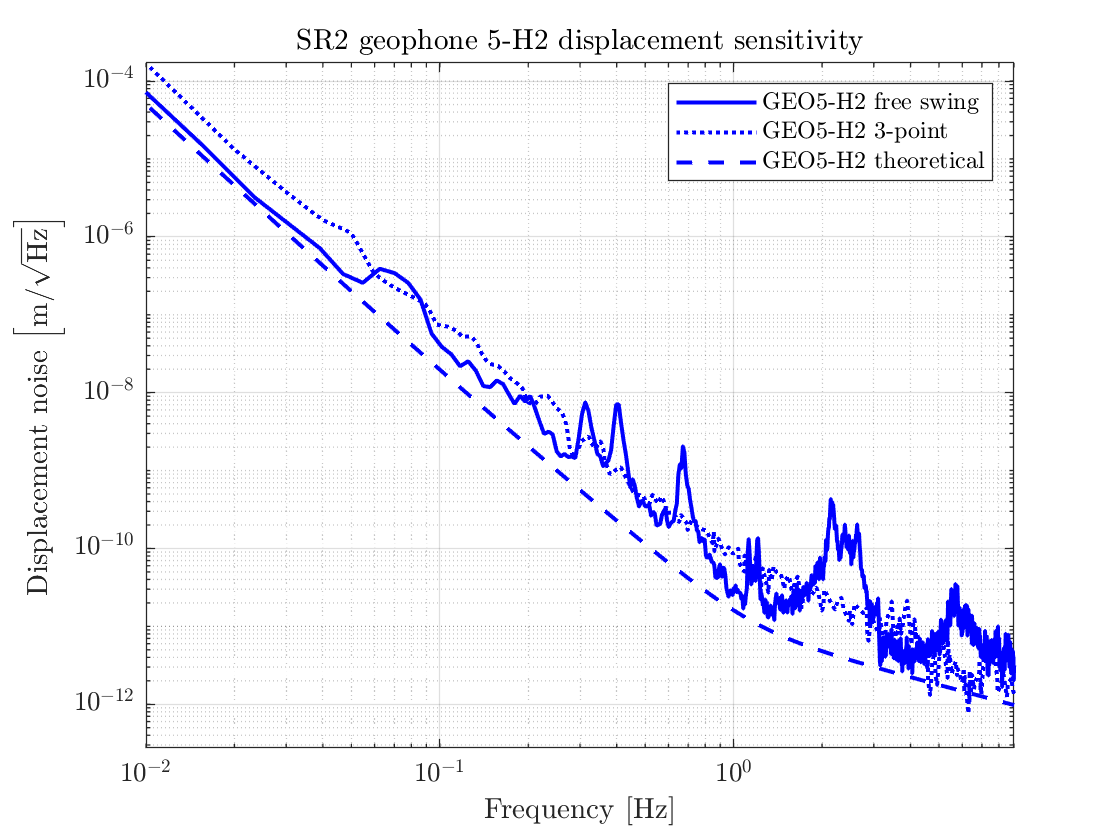
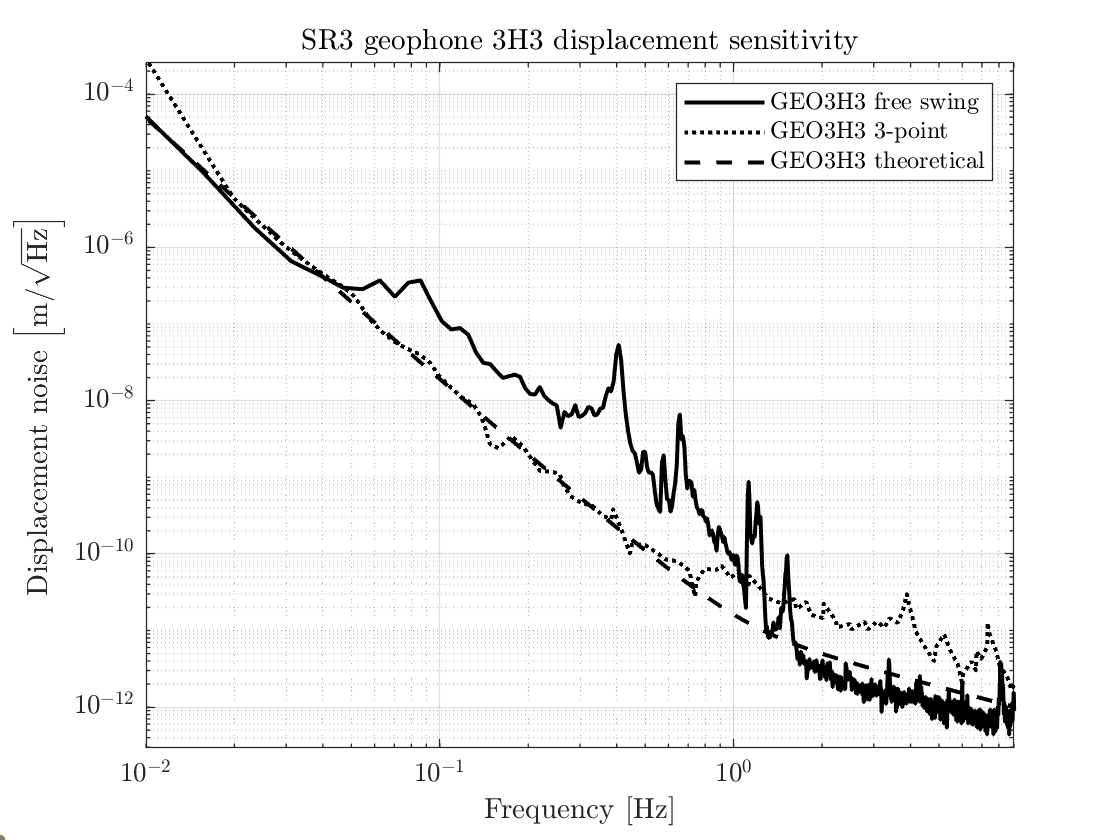
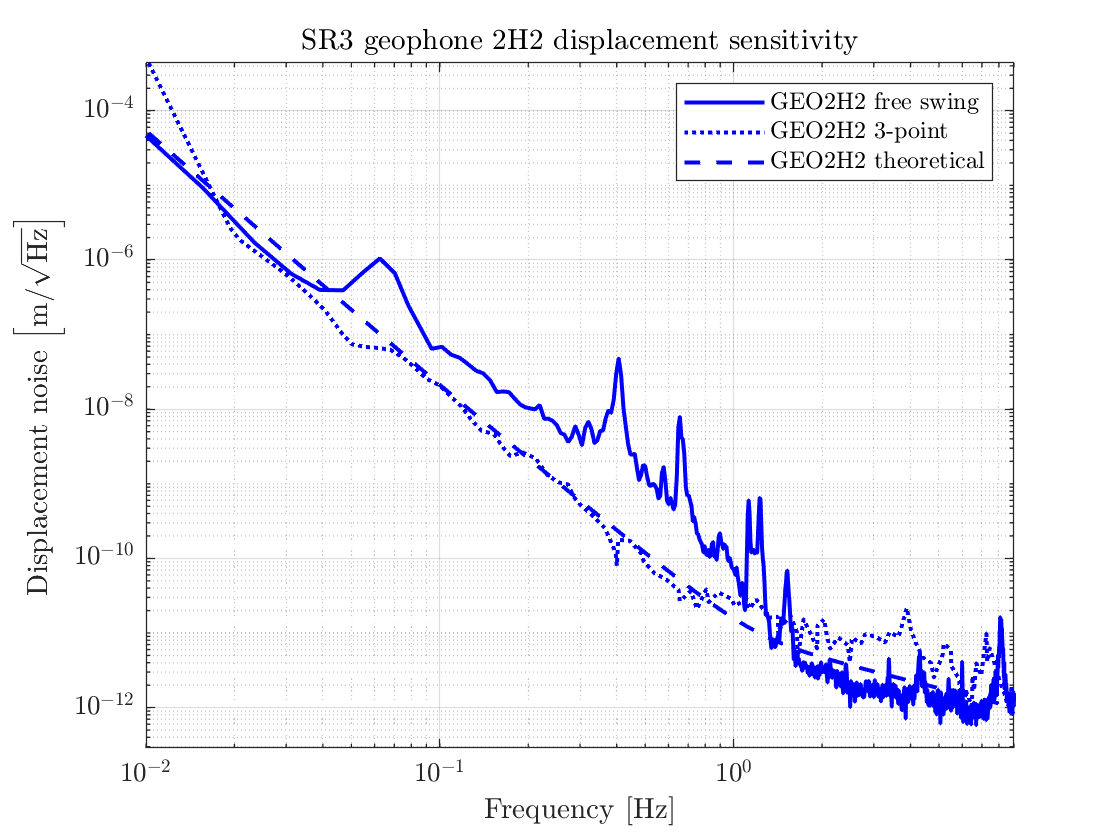
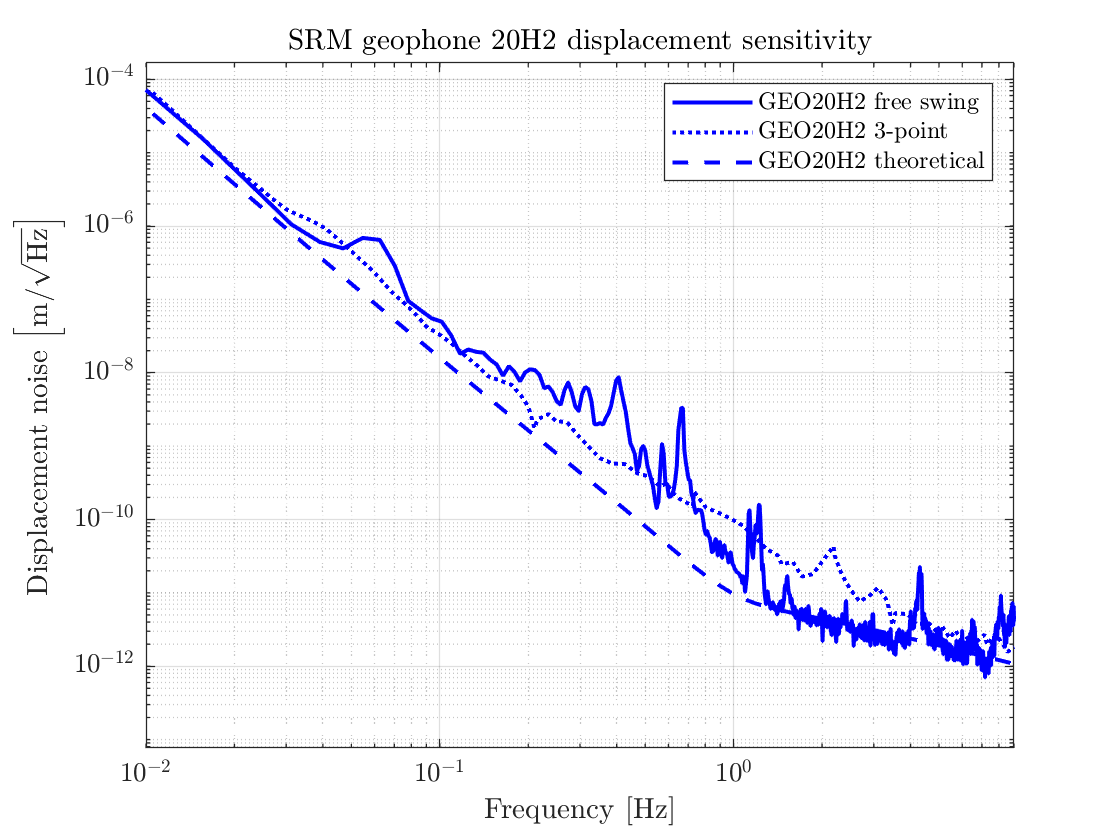
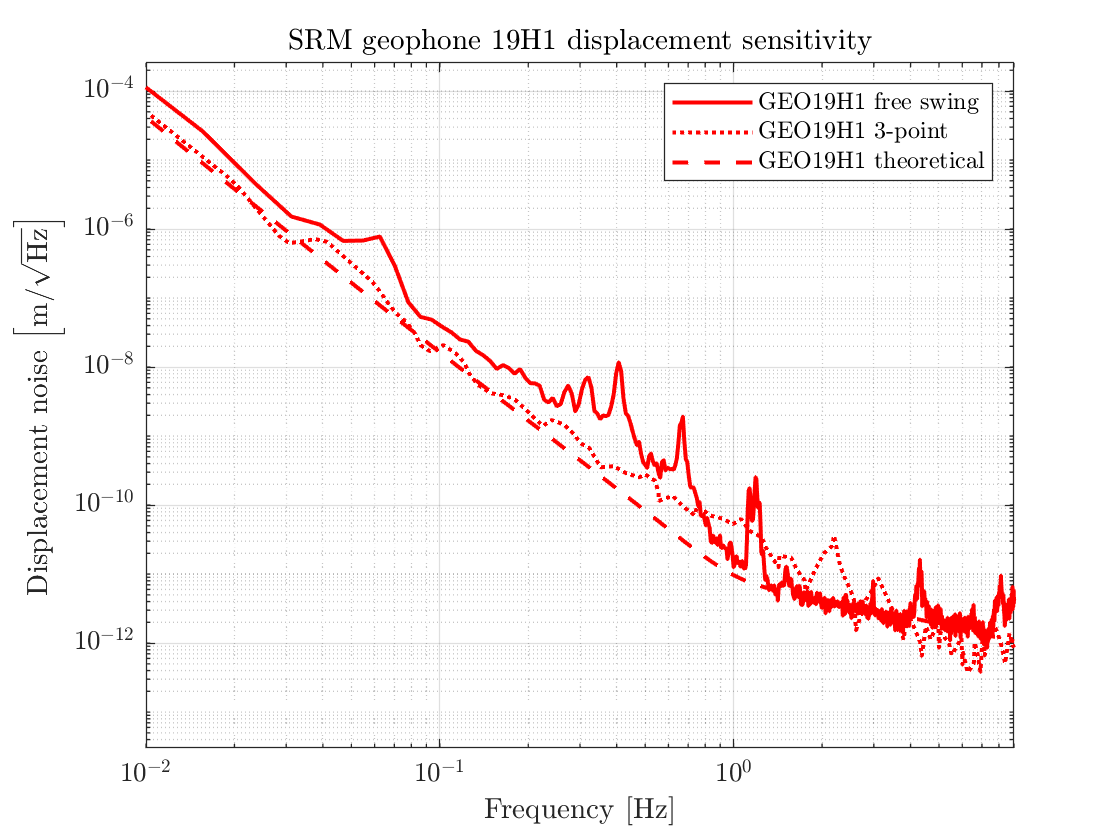
= Sensor noise measurement =
-- Using the parameters, the noise level of the geophones were estimated with 3 channel correlation analysis. The attachments show the noise level of the geophones. (Only the spectra of the geophones for SRM were compared with spectra of seismometer at IXV.)


Ge [V/(m/s)]10000-10000.gwf

-rw-r--r--. 1 virgorun virgo 7.0G Nov  5 12:22 MbtaHL-968920000-10000.gwf
-rw-r--r--. 1 virgorun virgo 7.0G Nov  5 13:58 MbtaHL-968930000-10000.gwf
-rw-r--r--. 1 virgorun virgo 7.0G Nov 18 18:23 MbtaHL-968940000-10000.gwf
-rw-r--r--. 1 virgorun virgo 7.0G Nov 18 19:58 MbtaHL-968950000-10000.gwf
-rw-r--r--. 1 virgorun virgo 7.0G Nov 18 21:32 MbtaHL-968960000-10000.gwf
-rw-r--r--. 1 virgorun virgo 7.0G Nov 18 23:06 MbtaHL-968970000-10000.gwf
-rw-r--r--. 1 virgorun virgo 7.0G Nov 19 00:40 MbtaHL-968980000-10000.gwf
-rw-r--r--. 1 virgorun virgo 7.0G Nov 19 02:15 MbtaHL-968990000-10000.gwf
-rw-r--r--. 1 virgorun virgo 7.0G Nov 19 03:49 MbtaHL-969000000-10000.gwf
-rw-r--r--. 1 virgorun virgo 7.0G Nov 19 05:24 MbtaHL-969010000-10000.gwf
-rw-r--r--. 1 virgorun virgo 7.0G Nov 19 06:58 MbtaHL-969020000-10000.gwf
-rw-r--r--. 1 virgorun virgo 7.0G Nov 19 08:33 MbtaHL-969030000-10000.gwf
-rw-r--r--. 1 virgorun virgo 7.0G Nov 19 10:02 MbtaHL-969040000-10000.gwf
-rw-r--r--. 1 virgorun virgo 7.0G Nov 19 11:31 MbtaHL-969050000-10000.gwf
-rw-r--r--. 1 virgorun virgo 7.0G Nov 19 12:59 MbtaHL-969060000-10000.gwf
-rw-r--r--. 1 virgorun virgo 7.0G Nov  6 12:25 MbtaHL-969070000-10000.gwf
-rw-r--r--. 1 virgorun virgo 1.5G Nov 20 00:27 MbtaHL-969070000-2000.gwf
-rw-r--r--. 1 virgorun virgo 7.0G Nov  6 1
Non-image files attached to this report
Comments to this report:
fabian.arellano - 17:33 Wednesday 13 October 2021 (18558) Print this report

I calculated the theoretical sensitivity of the geophones used in SR2:

  • Geophones names: 4, 5 and 6.
  • The measured and calculated sensitivities are shown in the first screenshot. The noise is higher than expected.
  • The numerical data of the geophones sensitivities is not available, so I took them from the plots using WebPlotDigitizer.
  • At 200 mHz, the measured values are higher than expected by the following factors:
    • GEO4: 2.7
    • GEO5: 3.7
    • GEO6: 4.7
  • The plot also shows the IP-L free swing displacement measured with the geophones on a day with good weather. It was measured by Terrence and Lucia on the 20th of July 2020 (klog 14790 maybe).
  • The second screen shot shows the noise budget of GEO4 as an example. The dominant contribution is the pre-amplfier noise.
  • The third screenshot shows a comparison of two different pre-amplfier calculations and a measurement. The three are consistent.
  • I used this reference: Blom, M. (2015). Seismic Attenuation for Advanced Virgo: Vibration Isolation for the External Injection Bench [Phdthesis]. Vrije U., Amsterdam, page 152.

I will add measurements of the IP free swing spectra measured by individual geophones when the micro-seismic is low.

Images attached to this comment
fabian.arellano - 12:34 Friday 15 October 2021 (18586) Print this report

I calculated the theoretical sensitivity of the geophones used in SR3:

  • Geophones names: 1, 2 and 3.
  • The numerical data of the geophones sensitivities is not available, so I took it from the plots using WebPlotDigitizer.
  • Below 500 mHz, the calculated and measured values seem to coincide.
  • As far as I remember being told, these geophones have been very noisy after installation on the IP table. I need to measure the IP free swing displacement ASD on a day with low micro-seismic in order to compare.
Images attached to this comment
fabian.arellano - 17:12 Friday 15 October 2021 (18600) Print this report

I calculated the theoretical sensitivity of the geophones used in SRM:

  • Geophones names: 19, 20 and 22.
  • The numerical data of the geophones sensitivities is not available, so I took it from the plots using WebPlotDigitizer.
  • The noise is higher than expected at frequency range considered.
  • At 200 mHz, the measured values are higher than expected by the following factors:
    • GEO19: 1.2
    • GEO20: 2.5
    • GEO22: 3.2
  • I still need to measure the IP free swing displacement ASD on a day with low micro-seismic in order to compare.
Images attached to this comment
fabian.arellano - 17:18 Monday 18 October 2021 (18611) Print this report

I measured the SR3 IP free swing amplitude spectral density with the geophones. The aim was to quantify the geophone noise but the micro-seismic was high, so the data is likely not so useful. However, I kept it just to check the software to process the data.

  • The geophone readout  is in number of counts (yet to be processed).
  • I also used the seismometer in the BS area, whose output is in micrometers per second.
  • Directory: /kagra/Dropbox/Subsystems/VIS/TypeBData/SR3/Inertial
  • File: IP_geo_ASD_2021-10-18.xml
fabian.arellano - 16:35 Monday 06 December 2021 (19093) Print this report

Summary: I acquired geophone data from the DAQ from a time in which the microseismic motion was relatively low. The IPs were swinging freely. The aim is to quantify the geophone noise from the free swing data,  which requires the measured signal to be below the noise.

First I selected a time in which the microsesmic motion was relatively low. This happened during this time interval (in UTC):

  • From: 14-07-2021 at 10:30:00 hrs.
  • To:      15-07-2021 at 03:00:00 hrs.
  • Length: 16 and a half hours.

I identified this time interval by looking at the output of the channel K1:PEM-SEIS_IXV_GND_X_BLRMS_100MHZ300, which gives the integrated RMS value between 100 and 300 mHz of the seismometer placed in the 2nd floor in the central room. I selected a time of minimum activity. See the first and second screenshots, upper right plots. I identified the begining and end times of the interval in DataViewer rathen than with Ndscope. See third screenshot.

Then I acquired data from the DAQ for the 12 geophones used in Type-B suspensions. The ASDs are shown in 4th screenshot, in units of cnt/rtHz. Later I acquired data from the same channels for a time of higher microseismic motion, namely, from 5-12-2021 at 7:12 hrs. onwards. The corresponding ASDs are shown in the  5th screenshot.

File location is as follows:

  • Directory: /kagra/Dropbox/Subsystems/VIS/TypeBData/Geophone_Info/geophone_noise/data_other/
  • Files:
    • geophone_free_swing_fabian_quiet_sea.xml
    • geophone_free_swing_fabian_rough_sea.xml

Analysis of the data using calibration data is the next step.

Images attached to this comment
fabian.arellano - 17:03 Thursday 09 December 2021 (19149) Print this report

Summary: in the case of SR2 geophones, for the sake of consistency, I compared the IP free-swing geophone readout, acquired on a day of good weather (entry 19093), with the theoretical sensitivity and the sensitivity measured with a three-point correlation analysis made before installation in the IPs.

The calculation of the theoretical sensitivity was reported in entry 18558. The three-point correlation analysis results were reported by Fujii-kun in another entry, but I had to use WebplotDigitizer to be able to use them (entry 18558). The IP free-swing geophone data was in the form of amplitude spectral densities (ASD) in units of cnt/rtHz. I used the transfer function of each geophone and the amplification factor of the pre-amplifier in order to convert the ASD to units of m/rtHz.

The following observations hold:

  • I used 940 as the pre-amplfier amplification factor. This is consistent with entry 3893 and the value used by Nikhef as reported in Blom, M. (2015). Seismic Attenuation for Advanced Virgo: Vibration Isolation for the External Injection Bench [Phdthesis]. Vrije U., Amsterdam, page 153.
  • The geophone assignment is

There is a separate figure for each geophone with three plots each. Above 60 mHz, the IP free-swing values tend to be consistent with the three-point correlation analysis values (with the exception of GEO6-H3 above 700 mHz). The theoretical values are lower in the three cases. Right now I don't know what the origin of the discrepancy is.

Images attached to this comment
fabian.arellano - 17:15 Friday 10 December 2021 (19171) Print this report

In the case of SR3 geophones, for the sake of consistency, I compared the IP free-swing geophone readout, acquired on a day of good weather (entry 19093), with the theoretical sensitivity and the sensitivity measured with a three-point correlation analysis made before installation on the IPs.

The geophone name assignment and place on the IP table are

As reported in entry 18586, the three-point correlation analysis and the calculated sensitivity coincide below 500 mHz. However, the free-swing values are higher. A far as I have been told by the people who worked with these geophones prior to O3GK, they are particularly noisy. This measurement seems to be consistent with such an assessment.

The three-point correlation measurement was done with the geophones on an optical table next to SR3 chamber, using the SR3 data acquisition system. Apparently, they are noisier inside of the chamber.

Images attached to this comment
fabian.arellano - 14:46 Monday 13 December 2021 (19184) Print this report

In the case of SRM geophones, for the sake of consistency, I compared the IP free-swing geophone readouts, acquired on a day of good weather (entry 19093), with their theoretical sensitivity.

The geophones used in SRM were calibrated twice becuase the pre-amplfiers within the pods were changed. The calibration parameters measured after the replacement were reported in entry 8177 on 21-02-2019. The plots attached to this report show the the theoretical sensitivity and the noise using those calibration parameters. As written in analogous reports for SR2 and SR3, the noise was measured as amplitude spectral densities of the geophones when the IP was swinging freely on a day of good weather, when the microsesmic motion was low.

The geophones used in SRM are numbers 19, 20 and 22 (entry 7059). Unfortunately, the documentation does not clarify their positions on the IP (i.e. H1, H2, H3), although we do know the calibration parametres according to their positions (entry 8177). Following the way we assigned the positions in other suspensions, for the legends in the plots I assumed the following: 19 → H1, 20 → H2, 22→H3.

The three channel correlation measurements shown in the plots were measured with the original pre-amplfiers and were reported in entry 7059, together with calibration parameters.

Images attached to this comment
Search Help
×

Warning

×