Summary: I acquired geophone data from the DAQ from a time in which the microseismic motion was relatively low. The IPs were swinging freely. The aim is to quantify the geophone noise from the free swing data, which requires the measured signal to be below the noise.
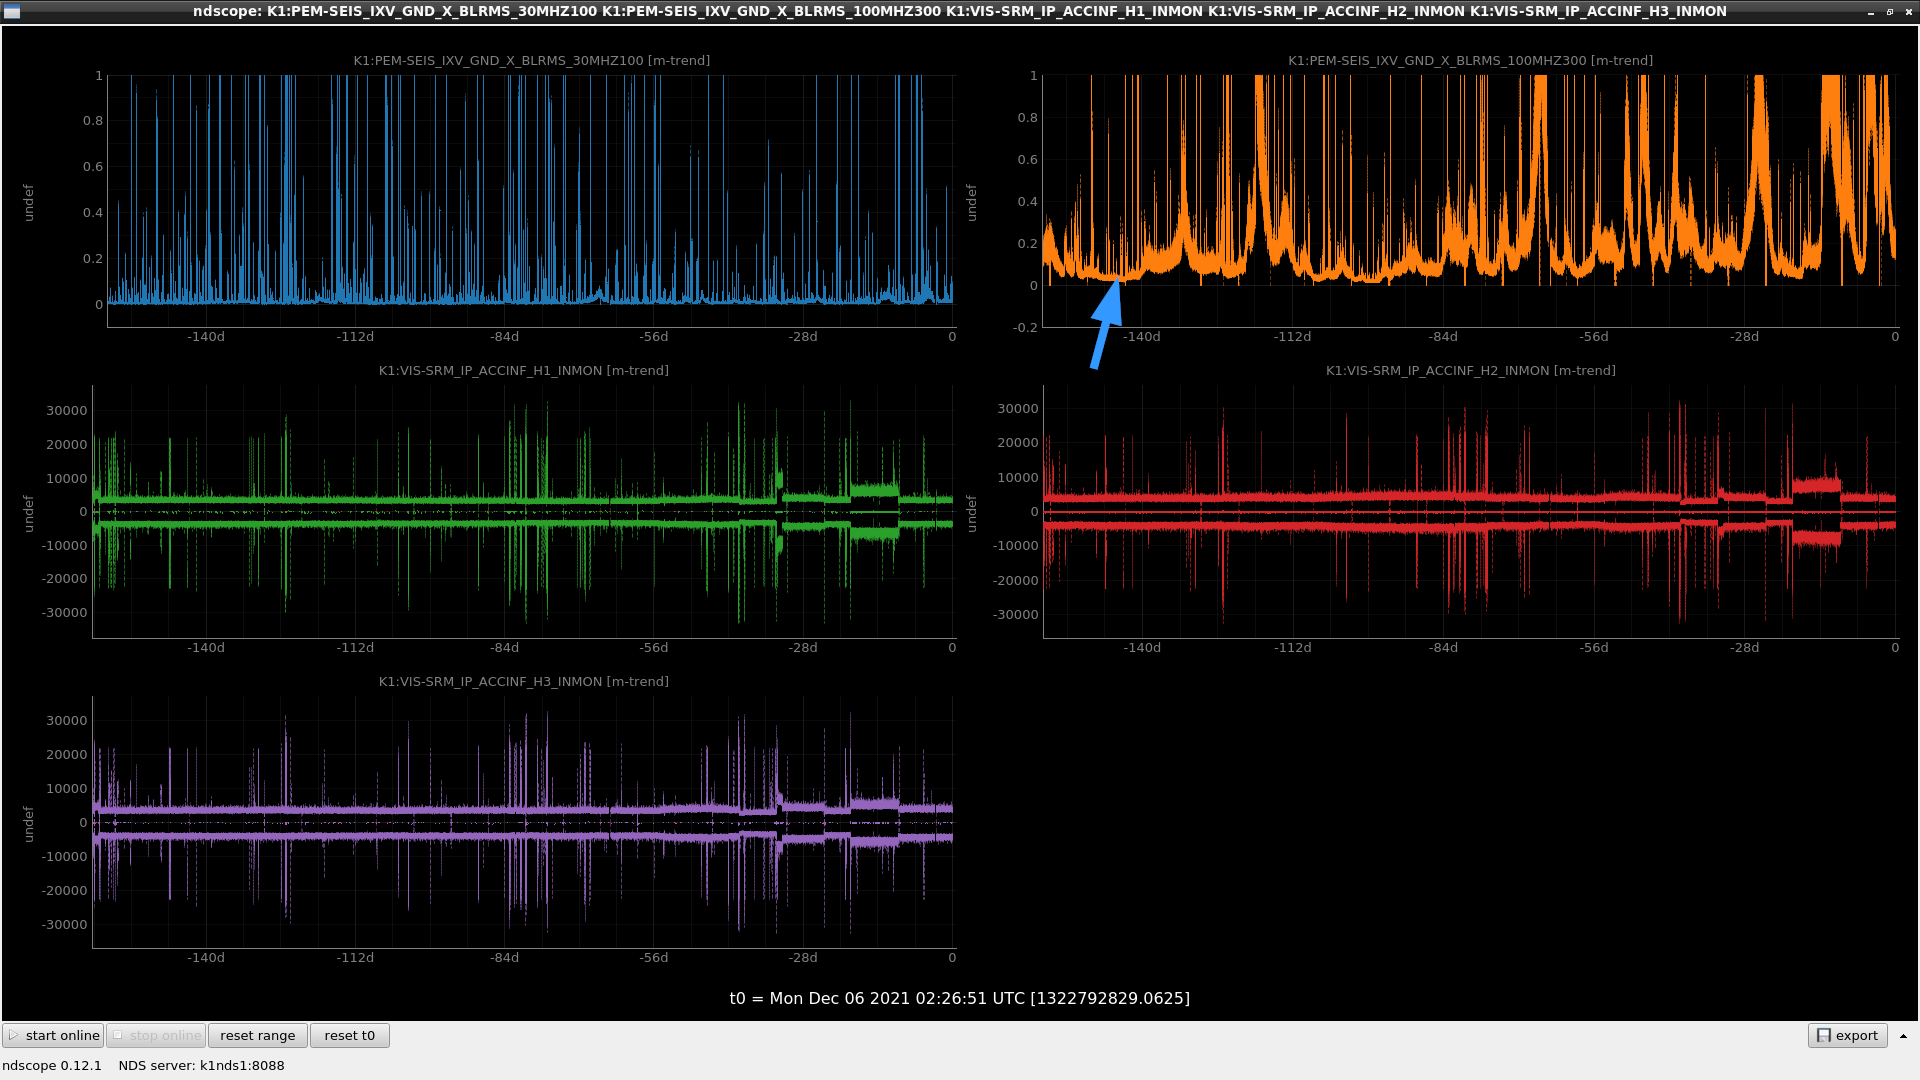
First I selected a time in which the microsesmic motion was relatively low. This happened during this time interval (in UTC):
- From: 14-07-2021 at 10:30:00 hrs.
- To: 15-07-2021 at 03:00:00 hrs.
- Length: 16 and a half hours.
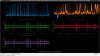
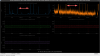
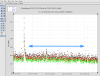
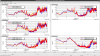
I identified this time interval by looking at the output of the channel K1:PEM-SEIS_IXV_GND_X_BLRMS_100MHZ300, which gives the integrated RMS value between 100 and 300 mHz of the seismometer placed in the 2nd floor in the central room. I selected a time of minimum activity. See the first and second screenshots, upper right plots. I identified the begining and end times of the interval in DataViewer rathen than with Ndscope. See third screenshot.
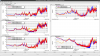
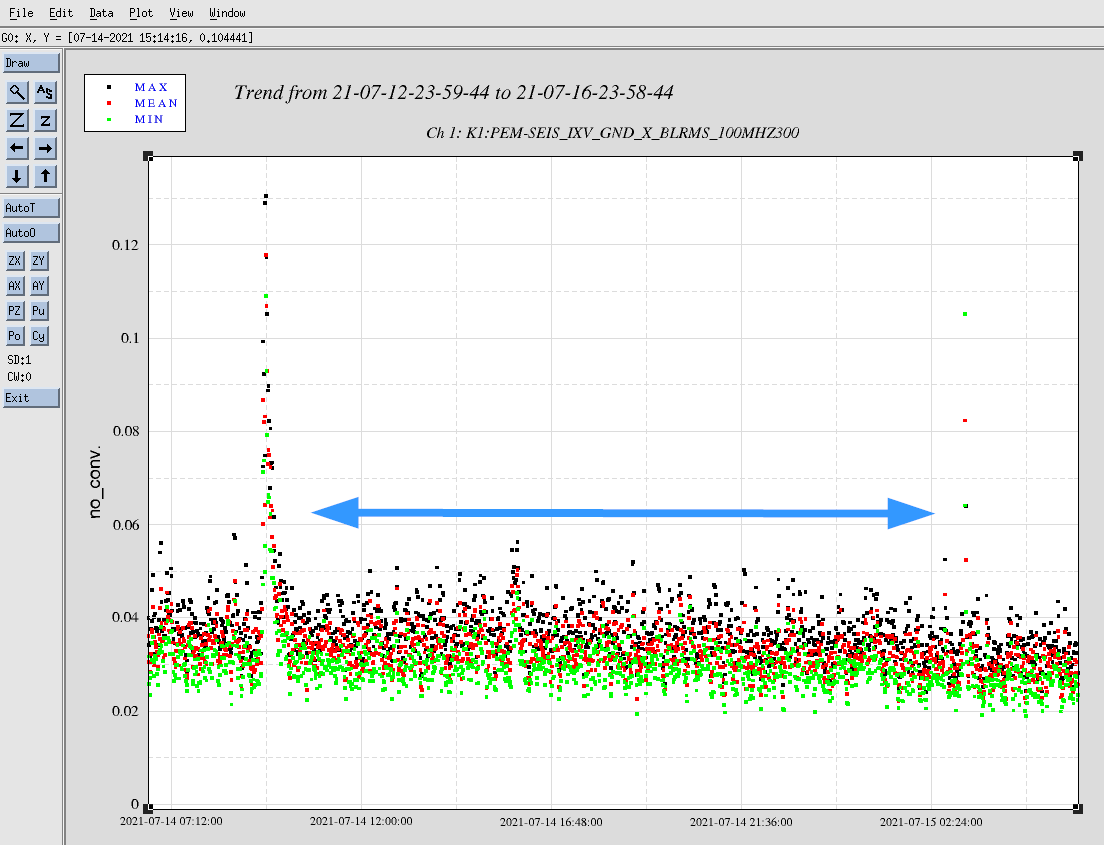
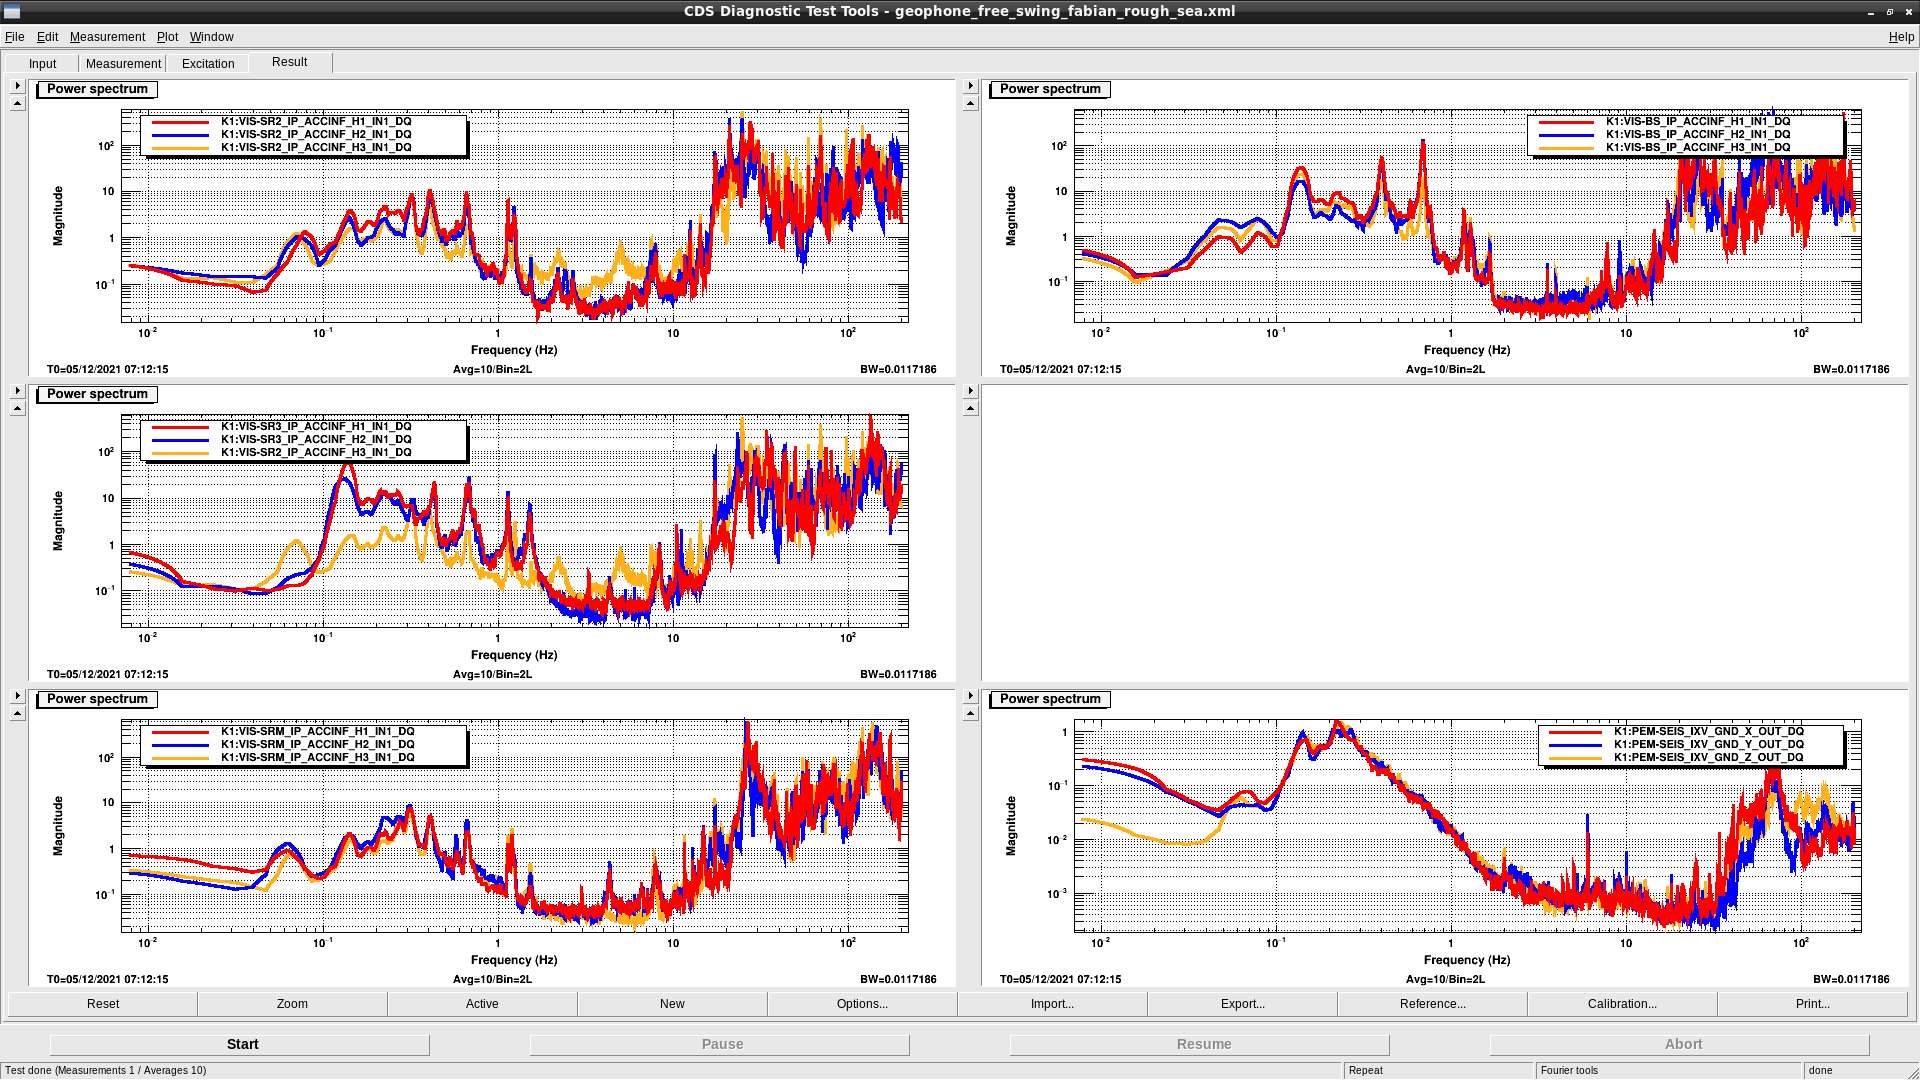
Then I acquired data from the DAQ for the 12 geophones used in Type-B suspensions. The ASDs are shown in 4th screenshot, in units of cnt/rtHz. Later I acquired data from the same channels for a time of higher microseismic motion, namely, from 5-12-2021 at 7:12 hrs. onwards. The corresponding ASDs are shown in the 5th screenshot.
File location is as follows:
- Directory: /kagra/Dropbox/Subsystems/VIS/TypeBData/Geophone_Info/geophone_noise/data_other/
- Files:
- geophone_free_swing_fabian_quiet_sea.xml
- geophone_free_swing_fabian_rough_sea.xml
Analysis of the data using calibration data is the next step.