Removed time segment is [1400000000, 1450000000)
These data is available on Kashiwa.
Undelivered files can be found in the attached files and are still kept on k1fw0.
Abstract:
I measured the schnupp asymmetry in the same manner as written in klog36343.
Since REFL PDA3 is the best sensor to use according to the previous measurement, I only used REFL PDA3 in this time.
Obtained result is 3.3443(16) m, which is really consistent with the values calculated from the results of the individual length measurement of PRX/PRY and SRX/SRY reported in klog37209 and klog37223.
Detail:
To verify the PRCL/SRCL measurement by checking the consistency of the Schnupp asymmetry between the values calculated from the length of PRX/PRY and SRX/SRY reported in klog37209 and klog37223 and from the time of flight measurement, I repeated the Schnupp asymmetry measurement reported in klog36343 with greater precision.
What I changed from the previous measurement are followings:
1. Increase the laser power from 1.2 W to 11.5 W.
2. Increase the averaging time for each measurement data from 10 second to 60 second.
3. Increase the amplitude of frequency modulation (excitation to MCE suspension) from 100 cnts to 200 cnts.
Thanks to the above modification, errors of the estimation of the optimal phase difference between X arm and Y arm were improved, resulting in the accurate result.
Figure 1 to 4 shows the measured data and fitting results.
Measurement data and fitting results are stored in //users/Commissioning/scripts/schnupp/260718/.
I summarized the optimal phase and its errors in the following table.
| optimal phase [deg] | errors [deg] | |
| PDA3 REFL 45 I with XARM | 230.031196 | 0.071549 |
| PDA3 REFL 45 Q with XARM | -40.019504 | 0.059909 |
| PDA3 REFL 45 I with YARM | 230.725665 | 0.048606 |
| PDA3 REFL 45 Q with YARM | -39.320663 | 0.047302 |
During the measurement, seed frequency for the f2 sideband was 5.624365513 MHz.
By using above results, schnupp asymmetry can be estimated as follows:
dL = 3.3443(16) m from PDA3 REFL 45 I with XARM and PDA3 REFL 45 I with YARM.
dL = 3.3443(14) m from PDA3 REFL 45 Q with XARM and PDA3 REFL 45 Q with YARM.
Schnupp asymmetry calculated from the PRX/PRY and SRX/SRY length in klog37209 and klog37223 are 3.3405(48), both results are very consistent.
Note:
For the measurement, I deleted the sensing matrix values putting at XARM and YARM, which is implemented in the work reported in klog37228.
Figure 5 shows the values before deleting the input matrix.


We confirmed that INITIAL_ALIGNMENT seems to work well. We made a medm screen for DRMI alignment. You can align PRM, SRM, BS, IMMT1 and IMMT2 by following this procedure.
## What we did
- We implemented the states, "PREP_FOR_DRMI_ALIGN", "LOCKING_DRMI", "ENGAGE_ADS_DRMI", "ALIGNING_DRMI", and "RECORD_GOOD_VALUES_DRMI".
- We made a medm screen in INITIAL_ALIGNMENT2407.adl (fig.1) to operate the DRMI initial alignment
- We tested the state one by one from this medm screen. First, The guardian reaches the RECORD_GOOD_VALUES_DRMI state smoothly. The good alignment values of PRM, SRM, BS, and IMMT2 are recorded in each DRFPMI_GOOD_OPLEV_{PIT, YAW} channel (fig.2). However, offloading was not worked at that time. We found that an offload script, reset_ASC_feedback.py was not worked if the values were recorded in DRFPMI_GOOD_OPLEV channels. Yamamoto-san modified the script.
- After the modification, offloading works well.


[Min Chen, Yuchen Liu, Chia-Jui Chou, Takaaki Yokozawa]
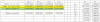
We investigated the coherence of 24 auxiliary channels with the online strain channel during the shaker injection test conducted in February 2026. The summary of the shaker injection test can be found here:
https://gwdoc.icrr.u-tokyo.ac.jp/cgi-bin/private/DocDB/ShowDocument?docid=17238
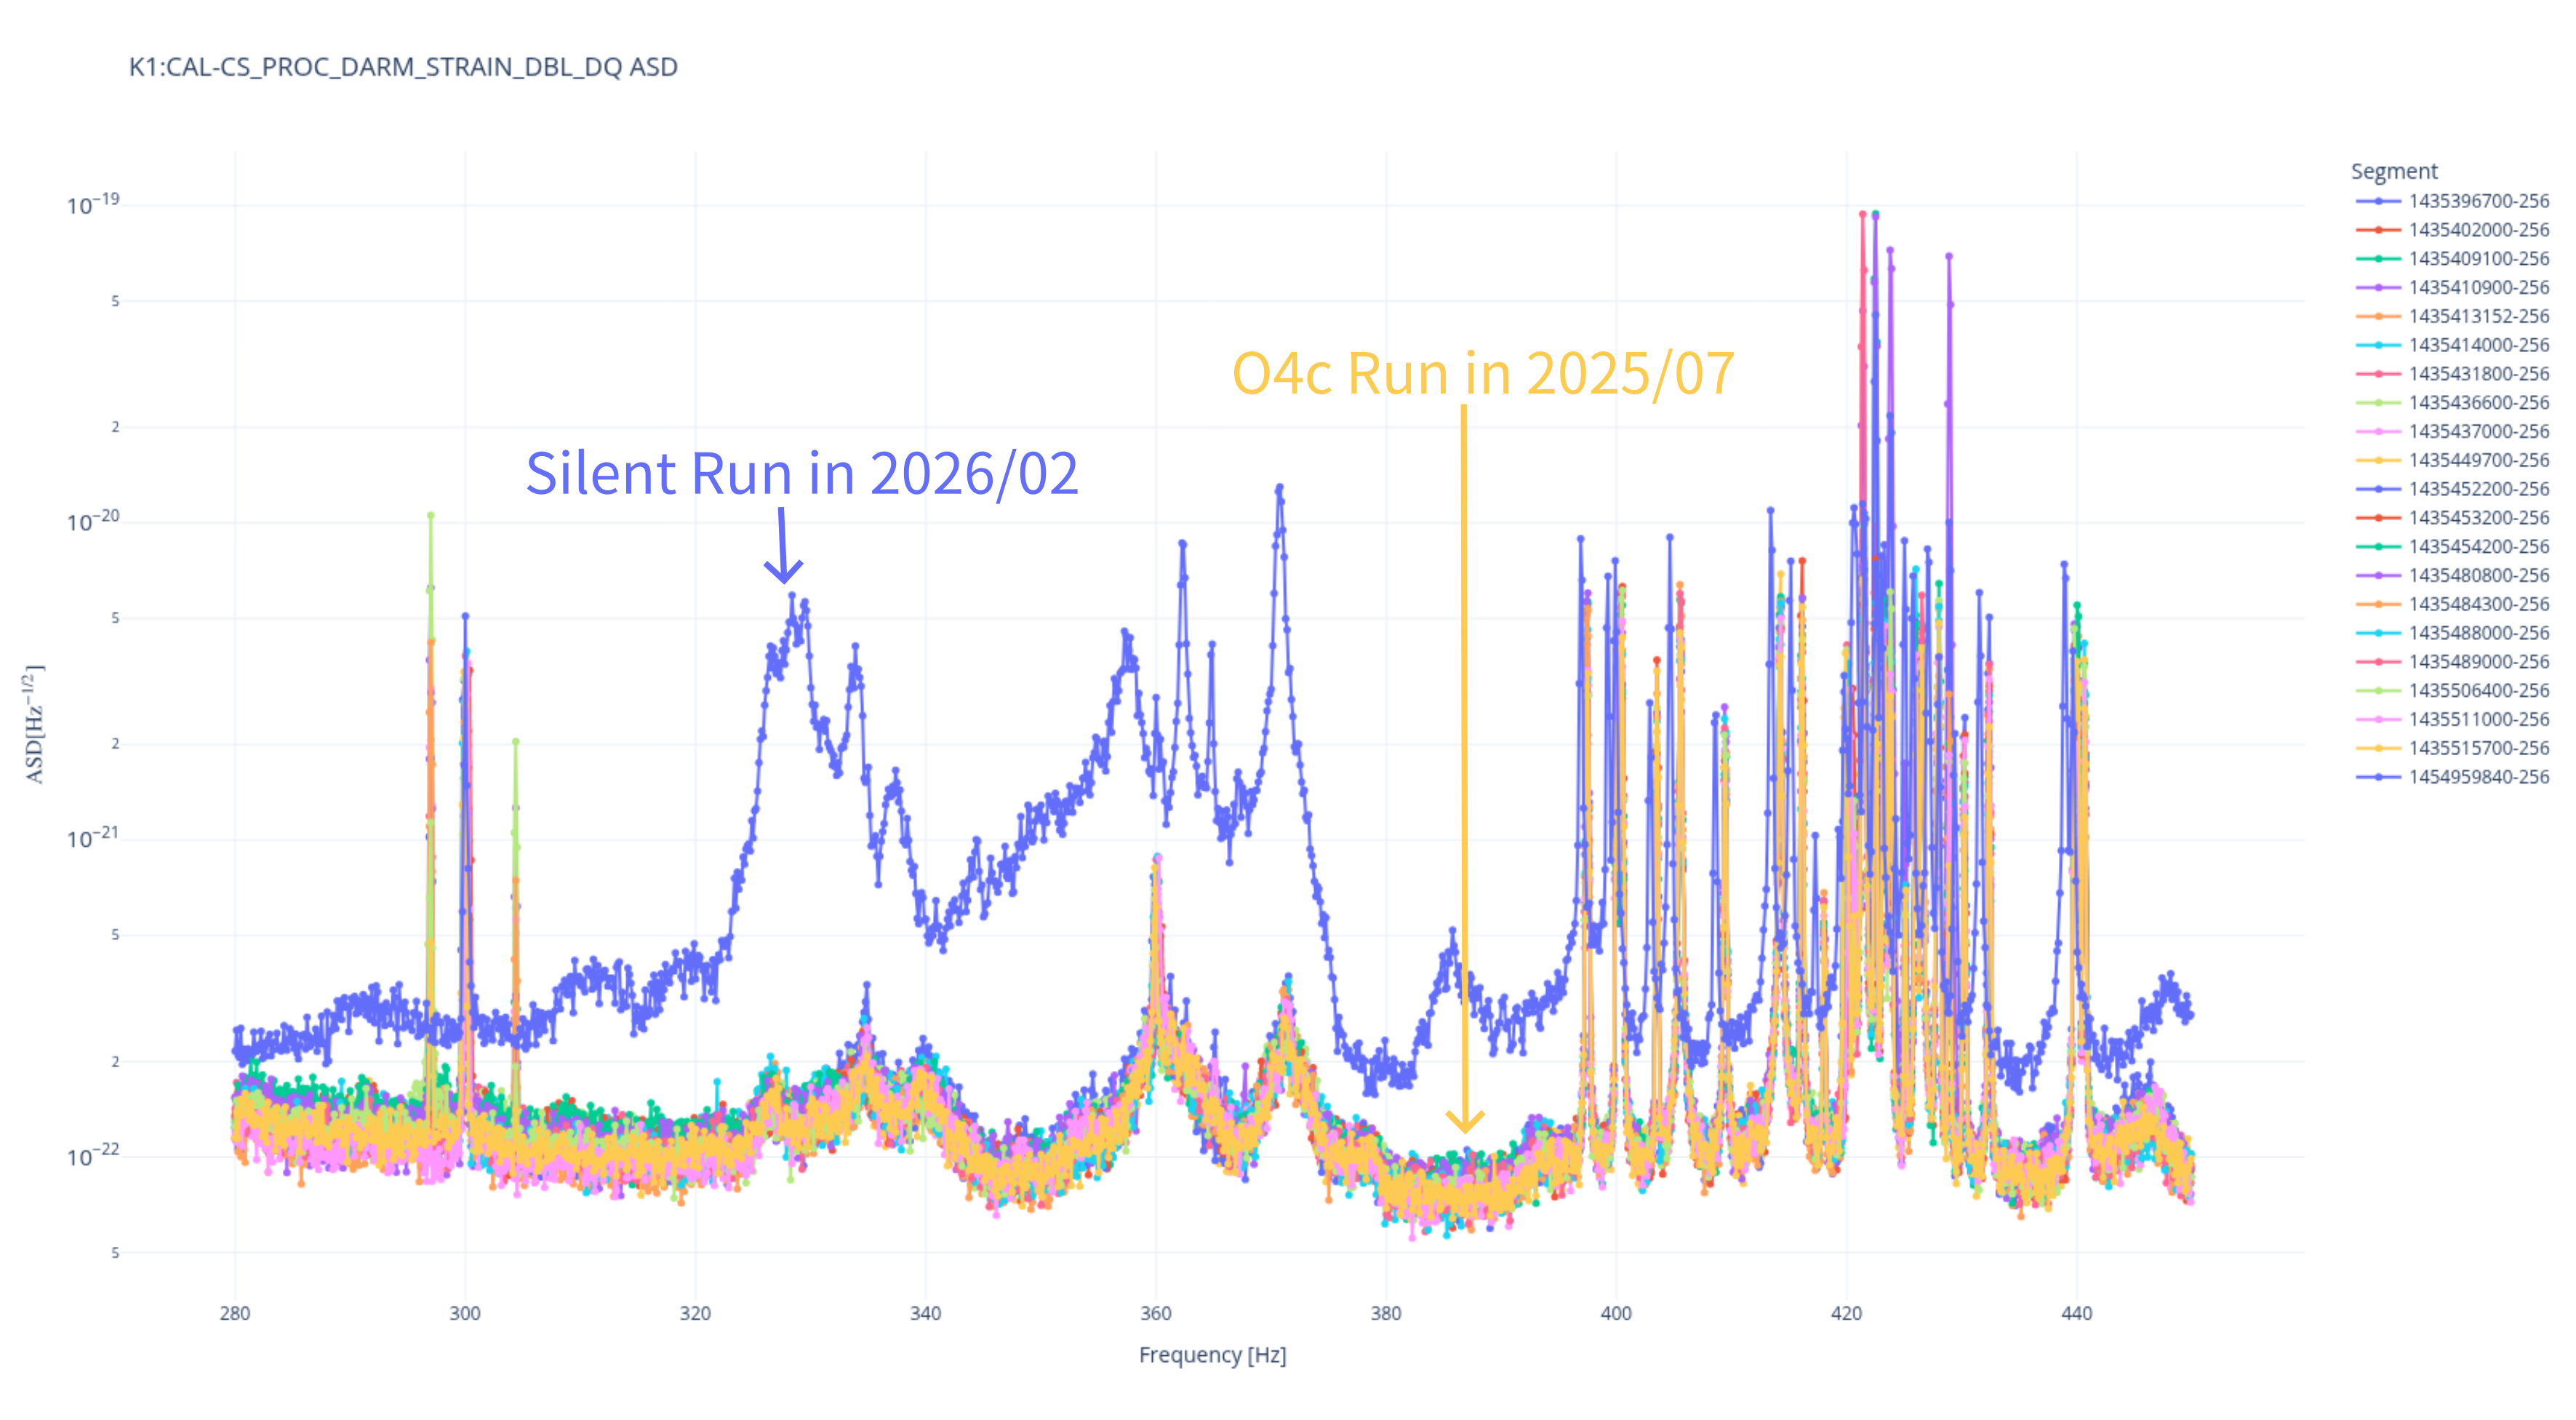
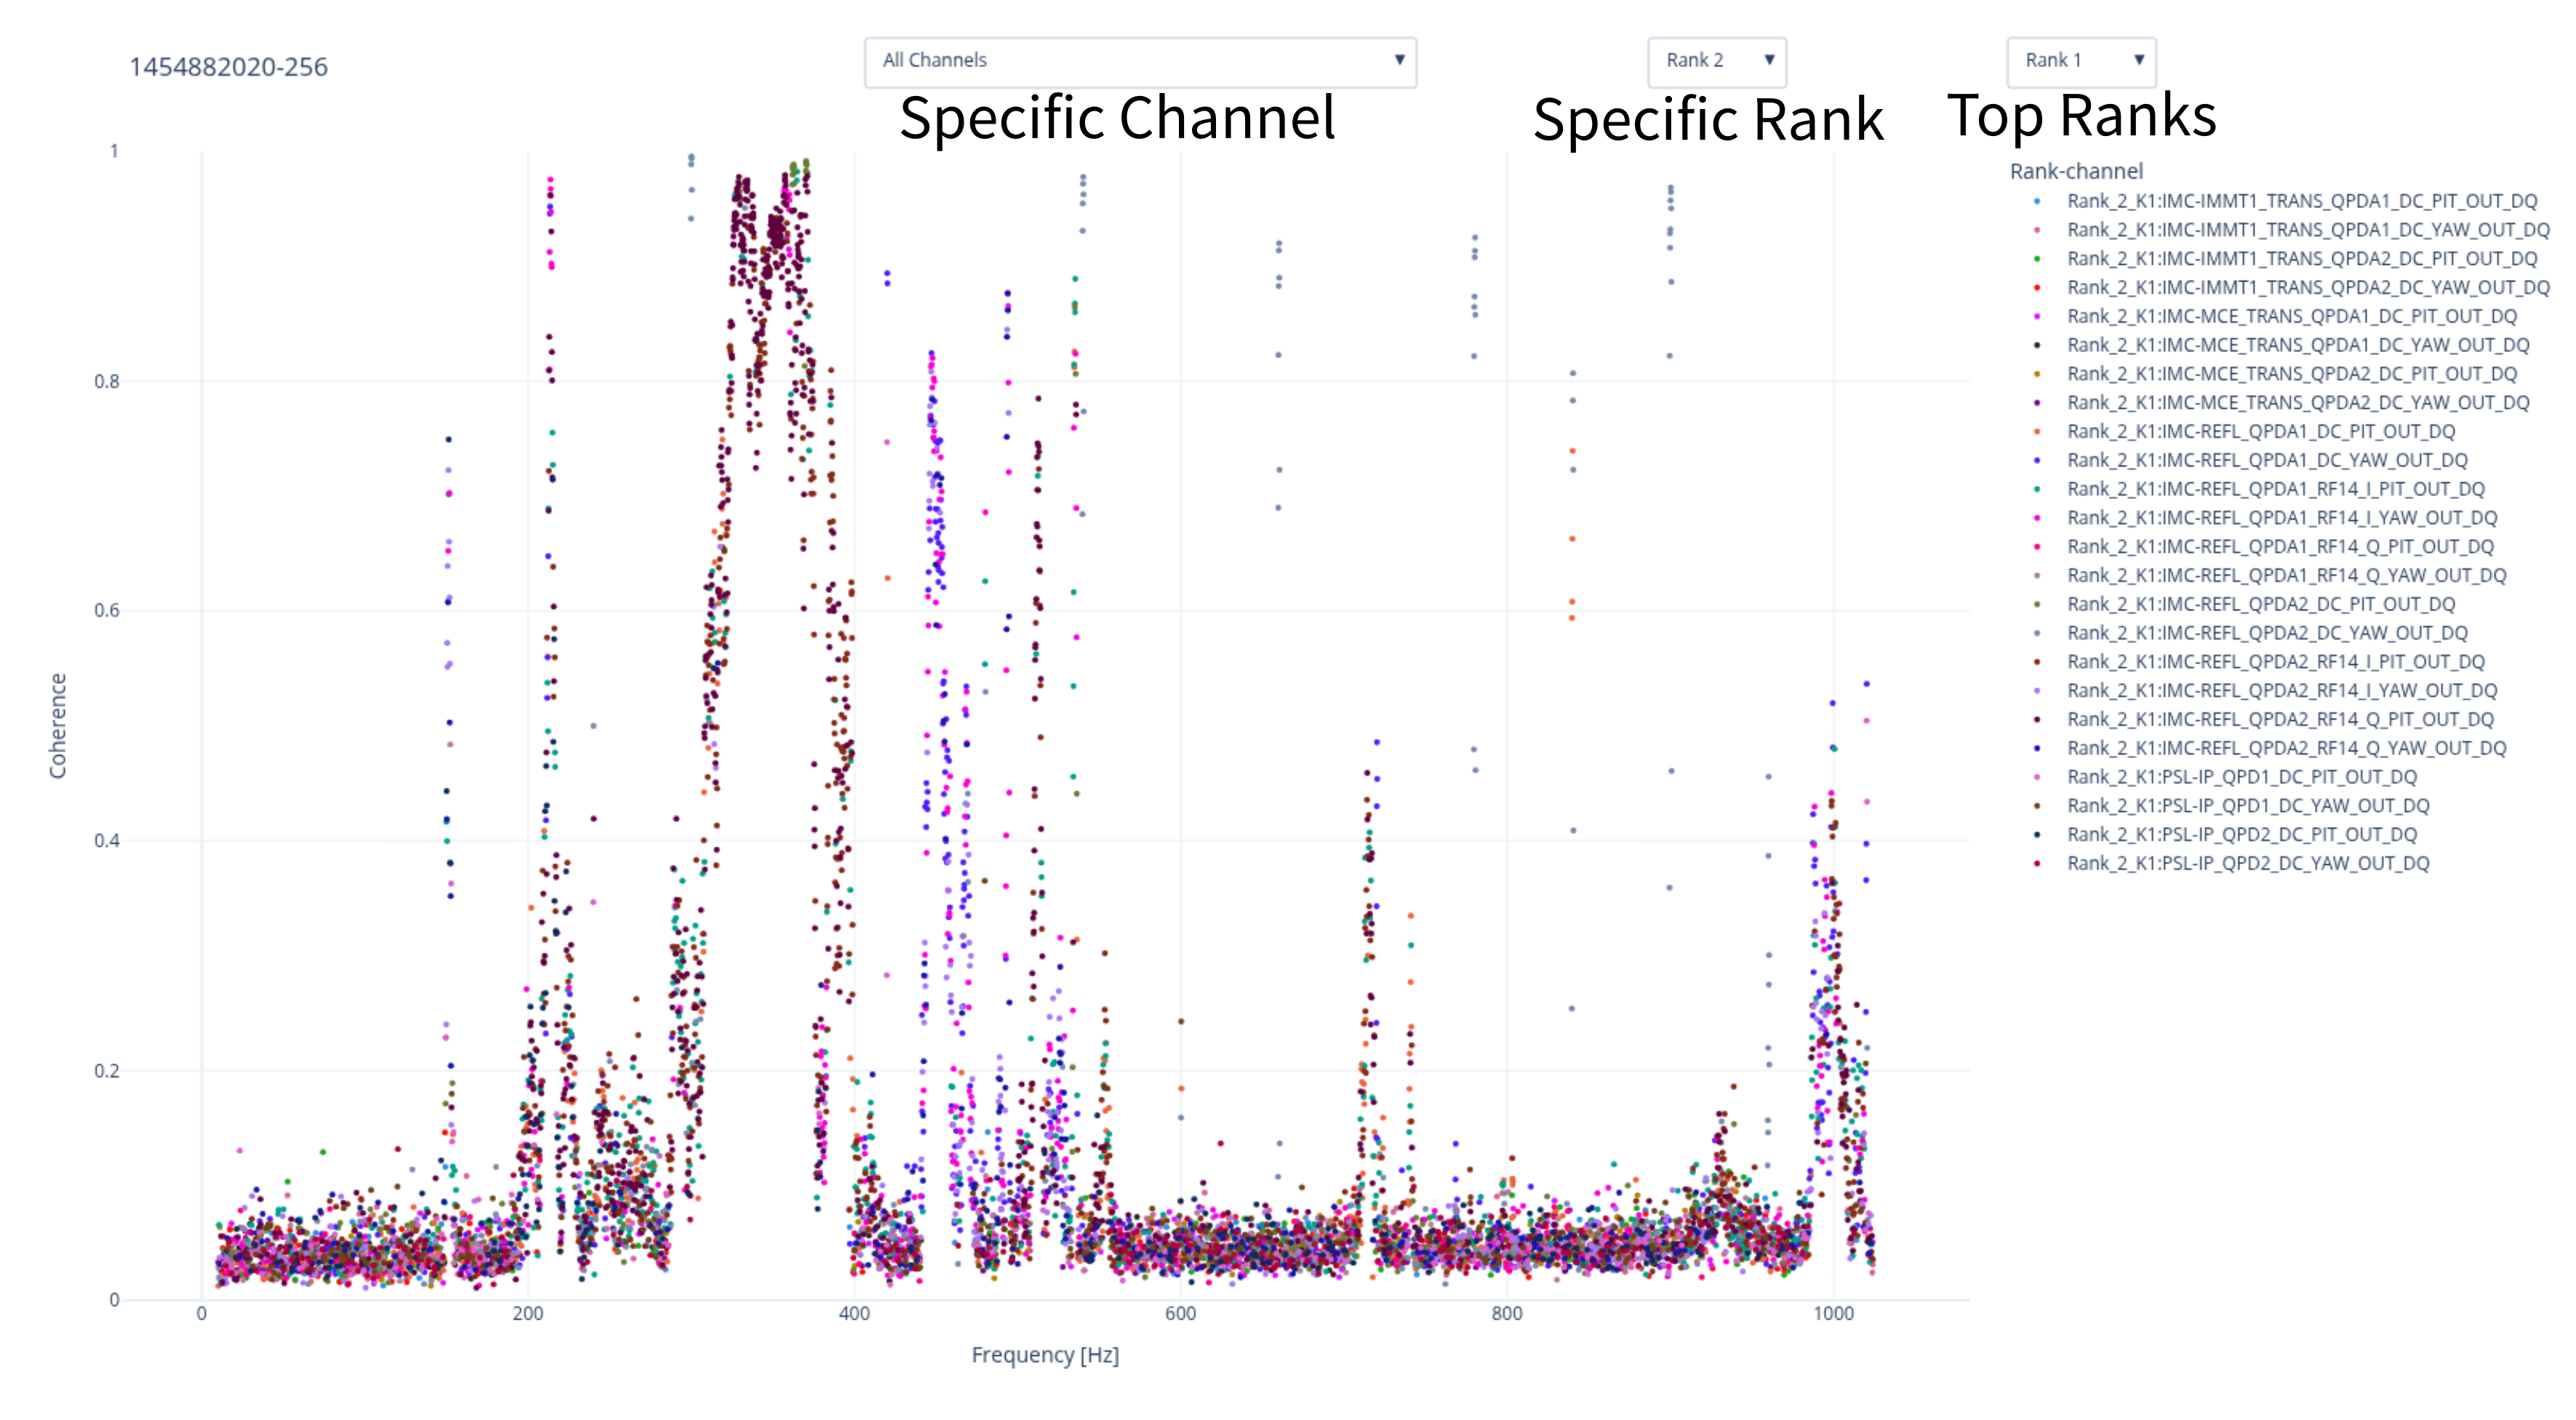
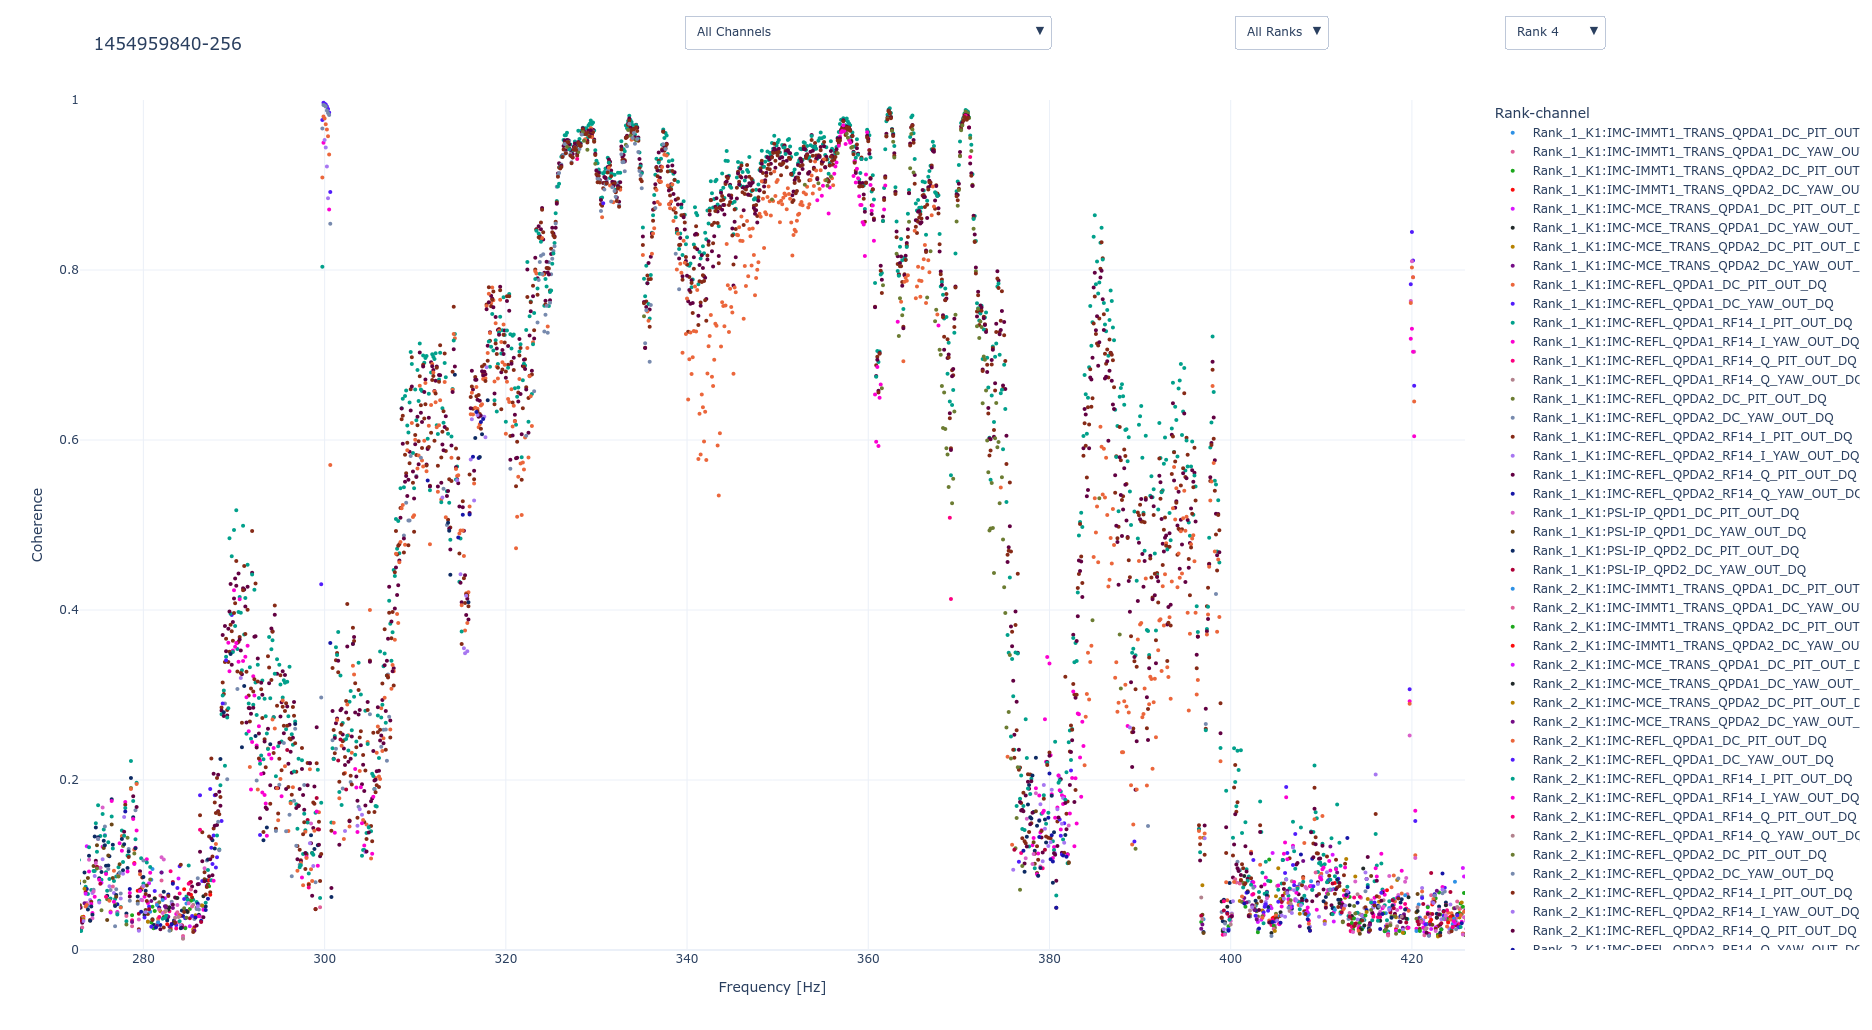
We calculated the coherence between 24 auxiliary channels and online strain channel and ranked the channels according to the coherence values. Then we pick the channels with top 4 ranks with coherence value larger than 0.2 into the important channel list between 280 Hz to 420 Hz. Here are the important channels:
– K1:IMC-REFL QPDA1 DC PIT OUT DQ
– K1:IMC-REFL QPDA1 DC YAW OUT DQ
– K1:IMC-REFL QPDA1 RF14 I PIT OUT DQ
– K1:IMC-REFL QPDA1 RF14 I YAW OUT DQ
– K1:IMC-REFL QPDA1 RF14 Q PIT OUT DQ
– K1:IMC-REFL QPDA2 DC PIT OUT DQ
– K1:IMC-REFL QPDA2 DC YAW OUT DQ
– K1:IMC-REFL QPDA2 RF14 I PIT OUT DQ
– K1:IMC-REFL QPDA2 RF14 I YAW OUT DQ
– K1:IMC-REFL QPDA2 RF14 Q PIT OUT DQ
– K1:IMC-REFL QPDA2 RF14 Q YAW OUT DQ
– K1:PSL-IP QPD1 DC PIT OUT DQ
– K1:PSL-IP QPD2 DC PIT OUT DQ
– K1:PSL-IP QPD2 DC YAW OUT DQ
The detailed report can be found here:
https://gwdoc.icrr.u-tokyo.ac.jp/cgi-bin/private/DocDB/ShowDocument?docid=17451
The coherence plots can be found here:
https://ldas-jobs.ligo.caltech.edu/~chiajui.chou/K1-o4c-coherence/


I offloaded the F0 GAS with the FR a little. The FR closes a movable limit.
I had tested the Pcal GRD code.
It works as we expect.
Aritomi, Tanaka
We performed some trials, mainly transition from 1f to 3f. But the trial was not work. We need more investigation.
### DRMI lock modification
This morning, DRMI lock got unstable for some reasons. One reason is that MICH loop is oscillated at SRM ADS frequency: ~6 Hz. At that moment, we were not sure of the cause of the oscillation. At once, we turned off only SRM ADS. Also, we changed the setpoints. Then, DRMI lock became stable a little. Another reason is that sometimes PRCL began the oscillation at ~100 Hz. After DRMI lock becoming stable a little, we measued the OLTFs. PRCL UGF increased to 100 Hz though the phase margin was less than 10 deg. So we lowered the gain. Similarly, SRCL OLTF seems to get better. We adjusted the gain. Current SRCL UGF is ~60 Hz (fig.1), PRCL UGF is ~40 Hz (fig.2).
Finally, the gains of the loop summerized the FM4 filter.
### Trial of the transition from 1f to 3f
To transit to 3f signal, we performed the phasing of 3f signals. we followed the procedure in klog32604. As for PRCL, we performed the phasing for REFL135 PD to maximize the I signal when PRCL was excited(fig.3). As for SRCL, we performed the phasing for REFL51 PD to maximize the I signal when SRCL was excited (fig.4). After that, we checked the RF51 signal when MICH was excited. Although the demod. phase is optimized for the SRCL signal, I signal was larger than Q signal when MICH was excited because BS motion is mixture with common and differential length change (fig.5). So we may need to decouple each motion. However, this time, we proceeded our work with this state.
We measued each relative gain and phase between 1f and 3f signals. the figures in the right lower 2 panes of fig. 3, 4, and 5 show each gain and phase of PRCL, SRCL, and MICH. As you can see, the relative phase of SRCL and PRCL seems to be 180 deg. But, the phase of MICH is 40 deg since there are some couplings. Anyway, we input these values in matrix (fig.6) and tried the transition. Then we succeeded PRCL and SRCL transition but failed MICH transition. So we moved the decoupling.
To decouple the DoFs, we excited the one DoFs, PRCL (left panel in fig.1) or SRCL (left panel in fig.2) and measued the relative gain and phase of between excited DoF error signal and others' error signal. From the results, I chosed CARM_IN1 as decoupled sensor for MICH 3F for the test, XARM_IN1 as decoupled SRCL 3F, and YARM_IN1 as decoupled PRCL 3F. After the decoupling, I measured the coupling but the ratio seems not to changed.
### DRMI ADS modification
This morning, we also found that DRMI began the oscillation at ~6 Hz just after engaging ADS. 6.3 Hz is the dither frequency of SRM YAW. The resG for SRM ADS in the MICH loop caused the oscillation. After decoupling the 1f error signals, MICH OLTF seems to got better than before. According to the MICH loop, current MICH UGF is around 10 Hz (fig.6). So I turned off the resG filter in engaging ADS. Then, ADSs seem to become stable.
### DRMI alignment Implementation to the INITIAL_ALIGNMENT guardian
After the modification of DRMI ADS, I implemented the DRMI alignment state with DRMI_1F_LOCKED into the INITIAL_ALIGNMENT guardian. I have not checked INITIAL_ALIGNMENT guardian behavior due to the earthquake.


With Dan Chen
We continued the work from the previous day. (klog_37206)
By adjusting the two mirrors newly installed inside the Pcal-Y Tx module (Fig. 1), we successfully aligned the new laser beam and propagated it to the RxPD.
On the RxPD, the beam position of the new laser appeared to be nearly identical to that of the current laser. The beam positions of the current laser and the new laser are shown in Fig. 2 and Fig. 3.
We also closed the OFS loop, and it appeared to operate normally.


Due to some remaining issues with the previous Pcal Guardian system, we have now updated the Pcal Guardian code to address these issues. The specific details are as follows:
Issue 1: Swap the order of HIGH_POWER and HIGH_POWER_RX_MON.
Before: INCREASE_OFFSET → HIGH_POWER_RX_MON → HIGH_POWER ⇄ WAITING_IFO HIGH_POWER_RX_MON → DECREASE_OFFSET HIGH_POWER → DECREASE_OFFSET
class HIGH_POWER(GuardState):
index = 100
request = False
class HIGH_POWER_RX_MON(GuardState):
index = 95
('INCREASE_OFFSET', 'HIGH_POWER_RX_MON'),
('HIGH_POWER_RX_MON', 'HIGH_POWER'),
('HIGH_POWER_RX_MON', 'DECREASE_OFFSET'),
('HIGH_POWER', 'DECREASE_OFFSET'),
('HIGH_POWER','WAITING_IFO'),
('WAITING_IFO', 'HIGH_POWER'),
Update: INCREASE_OFFSET → HIGH_POWER ⇄ HIGH_POWER_RX_MON ⇄ WAITING_IFO HIGH_POWER → DECREASE_OFFSET HIGH_POWER_RX_MON → DECREASE_OFFSET
class HIGH_POWER(GuardState):
index = 95
request = False
class HIGH_POWER_RX_MON(GuardState):
index = 100
('INCREASE_OFFSET', 'HIGH_POWER'),
('HIGH_POWER', 'HIGH_POWER_RX_MON'),
('HIGH_POWER_RX_MON', 'DECREASE_OFFSET'),
('HIGH_POWER_RX_MON', 'HIGH_POWER'),
('HIGH_POWER', 'DECREASE_OFFSET'),
('HIGH_POWER_RX_MON','WAITING_IFO'),
('WAITING_IFO', 'HIGH_POWER_RX_MON'),
2.Issue: Turn on the injection switches in HIGH_POWER, and turn them off automatically when leaving the state.
Update: Added code to automatically turn on the injection switches in the HIGH_POWER state and automatically turn them off when leaving that state (entering HIGH_POWER_RX_MON or DECREASE_OFFSET).
class HIGH_POWER(GuardState):
def main(self):
self.ARM='E'+SYSTEM[10]
ezca['CAL-PCAL_{0}_0_INJ_V_SW'.format(self.ARM)] = 1
class HIGH_POWER_RX_MON(GuardState):
def main(self):
self.ARM='E'+SYSTEM[10]
ezca['CAL-PCAL_{0}_0_INJ_V_SW'.format(self.ARM)] = 0
class DECREASE_OFFSET(GuardState):
def main(self):
ARM='E'+SYSTEM[10]
ezca['CAL-PCAL_{0}_0_INJ_V_SW'.format(ARM)] = 0
3.Issue: Send a Slack notification if Guardian remains in HIGH_POWER for an extended period.
Update: Added the code to send a Slack notification.
class HIGH_POWER(GuardState):
def main(self):
self.slack_time_1h = params[self.ARM]['wait_time_slack_1h']
self.timer['slack'] = self.slack_time_1h
def run(self):
notify('Pcal-{0} is in HIGH_POWER state.'.format(self.ARM))
if self.timer['slack']:
message = f'{self.ARM} PCAL HIGH_POWER state for too long (>{self.slack_time_1h}s)'
kagralib.slackpost("pcal", message, ["U015912SQ5T"])
self.timer['slack'] = self.slack_time_1h
4.Issue: Allow the real-time model to be stopped in the SAFE state.
Update: changed @lpd_check to a comment in the SAFE state.
class SAFE(GuardState):
index = 1
#@lpd_check # -> FAULT
@shutter_check # -> TOSAFE
@loop_check # -> TOSAFE
@injection_check # -> TOSAFE
def main(self):
### safe should be loaded independent on gSDF
if ezca['GRD-CAL_PCAL_{0}_REQUEST_S'.format(gARM)] == self.name:
sdf.restore(gFEC, self.name.lower())
#@lpd_check # -> FAULT
@shutter_check # -> TOSAFE
@loop_check # -> TOSAFE
@injection_check # -> TOSAFE
def run(self):
return True
The fitting results for the individual SRX resonance peaks presented in klog:37223 are summarized below. The measurement data are stored in Dropbox → All files/Dropbox KAGRA/Measurements/IFO/SRCL/SRCL_OMC_REFL_beat_signal_LO_sweep/2026_07_14_SRX.
- Figure 1: Around 190 MHz, without a linear background. Using data from 194.7 MHz to 195.5 MHz, the fitted peak frequency is 195.1834 ± 0.0034 MHz.
Figure 2: Around 190 MHz, with a linear background. Using data from 194.7 MHz to 195.5 MHz, the fitted peak frequency is 195.293 ± 0.018 MHz.
-
Figure 3: Around 160 MHz, without a linear background. Using data from 161.8 MHz to 162.6 MHz, the fitted peak frequency is 162.3010 ± 0.0040 MHz.
Figure 4: Around 160 MHz, with a linear background. Using data from 161.8 MHz to 162.6 MHz, the fitted peak frequency is 162.415 ± 0.019 MHz. -
Figure 5: Around 140 MHz, without a linear background. Using data from 126.9 MHz to 127.48 MHz, the fitted peak frequency is 127.1931 ± 0.0026 MHz.
Figure 6: Around 140 MHz, with a linear background. Using data from 126.9 MHz to 127.48 MHz, the fitted peak frequency is 127.2057 ± 0.0026 MHz.
-
Figure 7: Around −140 MHz, without a linear background. Using data from 125.0 MHz to 125.8 MHz, the fitted peak frequency is 125.3625 ± 0.0061 MHz.
Figure 8: Around −140 MHz, with a linear background. Using data from 125.0 MHz to 125.8 MHz, the fitted peak frequency is 125.235 ± 0.031 MHz.
-
Figure 9: Around −160 MHz, without a linear background. Using data from 157.9 MHz to 158.7 MHz, the fitted peak frequency is 158.2421 ± 0.0048 MHz.
Figure 10: Around −160 MHz, with a linear background. Using data from 157.9 MHz to 158.7 MHz, the fitted peak frequency is 158.1853 ± 0.0091 MHz.
-
Figure 11: Around −190 MHz, without a linear background. Using data from 193.0 MHz to 193.8 MHz, the fitted peak frequency is 193.3150 ± 0.0033 MHz.
Figure 12: Around −190 MHz, with a linear background. Using data from 193.0 MHz to 193.8 MHz, the fitted peak frequency is 193.2798 ± 0.0058 MHz.


The fitting results for the individual PRX resonance peaks presented in klog:37223 are summarized below. The measurement data are stored in Dropbox → All files/Dropbox KAGRA/Measurements/IFO/PRCL/PRCL_OMC_REFL_beat_signal_LO_sweep/2026_07_14_PRX.
- Figure 1: Around 190 MHz, without a linear background. Using data from 188.4 MHz to 189.0 MHz, the fitted peak frequency is 188.6436 ± 0.0024 MHz.
Figure 2: Around 190 MHz, with a linear background. Using data from 188.4 MHz to 189.0 MHz, the fitted peak frequency is 188.6809 ± 0.0042 MHz.
- Figure 3: Around 160 MHz, without a linear background. Using data from 161.8 MHz to 162.7 MHz, the fitted peak frequency is 162.2408 ± 0.0040 MHz.
Figure 4: Around 160 MHz, with a linear background. Using data from 161.8 MHz to 162.7 MHz, the fitted peak frequency is 162.3162 ± 0.0068 MHz.
- Figure 5: Around 140 MHz, without a linear background. Using data from 128.9 MHz to 129.8 MHz, the fitted peak frequency is 129.3171 ± 0.0033 MHz.
Figure 6: Around 140 MHz, with a linear background. Using data from 128.9 MHz to 129.8 MHz, the fitted peak frequency is 129.3037 ± 0.0070 MHz.
- Figure 7: Around −140 MHz, without a linear background. Using data from 125.1 MHz to 125.7 MHz, the fitted peak frequency is 125.3904 ± 0.0041 MHz.
Figure 8: Around −140 MHz, with a linear background. Using data from 125.1 MHz to 125.7 MHz, the fitted peak frequency is 125.346 ± 0.011 MHz.
- Figure 9: Around −160 MHz, without a linear background. Using data from 157.9 MHz to 158.7 MHz, the fitted peak frequency is 158.3322 ± 0.0035 MHz.
Figure 10: Around −160 MHz, with a linear background. Using data from 157.9 MHz to 158.7 MHz, the fitted peak frequency is 158.2937 ± 0.0089 MHz.
- Figure 11: Around −190 MHz, without a linear background. Using data from 186.4 MHz to 187.2 MHz, the fitted peak frequency is 186.8475 ± 0.0060 MHz.
Figure 12: Around −190 MHz, with a linear background. Using data from 186.4 MHz to 187.2 MHz, the fitted peak frequency is 186.7790 ± 0.0078 MHz.


The PRX and SRX data measured in klog:37209 were analyzed. The cavity lengths were determined by fitting the measured resonance frequencies. The differences between the measured and design cavity lengths were 1.25 ± 0.46 cm for PRX and 2.56 ± 0.45 cm for SRX. Since these differences exceed the estimated uncertainties, the actual PRX and SRX cavity lengths may differ from their design values.
-
The cavity lengths of PRX and SRX were determined using the following data.
PRX
Minimum (MHz) Maximum (MHz)
188.6412 188.6851
162.2368 162.3230
129.2967 129.3204
-125.3945 -125.3351
-158.3357 -158.2847
-186.8535 -186.7711
SRX
Minimum (MHz) Maximum (MHz)
195.1800 195.3102
162.2970 162.4341
127.1905 127.2084
-125.3685 -125.2040
-158.2469 -158.1762
-193.3183 -193.2740
-
From the measurement results, the midpoint between the minimum and maximum frequencies was calculated for each resonance. These midpoint frequencies were divided by the FSR calculated from the design cavity lengths (68.2563 m for PRX and 68.2562 m for SRX). The resulting values were rounded to the nearest integers, and the measured frequencies were fitted with the linear function AN+B, where A and B are fitting parameters and N is the rounded integer. The fitting results were as follows.
PRX (Fig. 1)
A: 2.19568 ± 0.00015 MHz
B: −0.2170 ± 0.0099 MHz
SRX (Fig. 2)
A: 2.19526 ± 0.00014 MHz
B: −0.1252 ± 0.0092 MHz
-
Since A corresponds to the FSR, the cavity lengths were calculated from the fitted values of A.
PRX
Measured cavity length: 68.2688 ± 0.0046 m
Design value: 68.2563 m
Difference (measured − design): 1.25 ± 0.46 cm
SRX
Measured cavity length: 68.2818 ± 0.0045 m
Design value: 68.2562 m
Difference (measured − design): 2.56 ± 0.45 cmTherefore, the differences between the measured and design values for both PRX and SRX exceed the estimated uncertainties, suggesting that the actual cavity lengths may differ from their design values.


Orange Power Cables
1.5 m 50
10 m 24
20 m 15
30 m 20
50 m 8
Yellow Power Cables
1.5 m 9
3 m 44
10 m 16
20 m 23
30 m 18
The SRM GRD says "GAS is close to saturation (F0)".
The K1:VIS-SRM_F0_COILOUTF_GAS_OUTPUT is ~25100 counts now.

I updated the Pcal guardian code based on the preparation report from Jinshui Tian and Yuli Liang.
We incorporated the minor improvements discussed so far.
A detailed report will follow.
Due to some remaining issues with the previous Pcal Guardian system, we have now updated the Pcal Guardian code to address these issues. The specific details are as follows:
Issue 1: Swap the order of HIGH_POWER and HIGH_POWER_RX_MON.
Before: INCREASE_OFFSET → HIGH_POWER_RX_MON → HIGH_POWER ⇄ WAITING_IFO HIGH_POWER_RX_MON → DECREASE_OFFSET HIGH_POWER → DECREASE_OFFSET
class HIGH_POWER(GuardState):
index = 100
request = False
class HIGH_POWER_RX_MON(GuardState):
index = 95
('INCREASE_OFFSET', 'HIGH_POWER_RX_MON'),
('HIGH_POWER_RX_MON', 'HIGH_POWER'),
('HIGH_POWER_RX_MON', 'DECREASE_OFFSET'),
('HIGH_POWER', 'DECREASE_OFFSET'),
('HIGH_POWER','WAITING_IFO'),
('WAITING_IFO', 'HIGH_POWER'),
Update: INCREASE_OFFSET → HIGH_POWER ⇄ HIGH_POWER_RX_MON ⇄ WAITING_IFO HIGH_POWER → DECREASE_OFFSET HIGH_POWER_RX_MON → DECREASE_OFFSET
class HIGH_POWER(GuardState):
index = 95
request = False
class HIGH_POWER_RX_MON(GuardState):
index = 100
('INCREASE_OFFSET', 'HIGH_POWER'),
('HIGH_POWER', 'HIGH_POWER_RX_MON'),
('HIGH_POWER_RX_MON', 'DECREASE_OFFSET'),
('HIGH_POWER_RX_MON', 'HIGH_POWER'),
('HIGH_POWER', 'DECREASE_OFFSET'),
('HIGH_POWER_RX_MON','WAITING_IFO'),
('WAITING_IFO', 'HIGH_POWER_RX_MON'),
2.Issue: Turn on the injection switches in HIGH_POWER, and turn them off automatically when leaving the state.
Update: Added code to automatically turn on the injection switches in the HIGH_POWER state and automatically turn them off when leaving that state (entering HIGH_POWER_RX_MON or DECREASE_OFFSET).
class HIGH_POWER(GuardState):
def main(self):
self.ARM='E'+SYSTEM[10]
ezca['CAL-PCAL_{0}_0_INJ_V_SW'.format(self.ARM)] = 1
class HIGH_POWER_RX_MON(GuardState):
def main(self):
self.ARM='E'+SYSTEM[10]
ezca['CAL-PCAL_{0}_0_INJ_V_SW'.format(self.ARM)] = 0
class DECREASE_OFFSET(GuardState):
def main(self):
ARM='E'+SYSTEM[10]
ezca['CAL-PCAL_{0}_0_INJ_V_SW'.format(ARM)] = 0
3.Issue: Send a Slack notification if Guardian remains in HIGH_POWER for an extended period.
Update: Added the code to send a Slack notification.
class HIGH_POWER(GuardState):
def main(self):
self.slack_time_1h = params[self.ARM]['wait_time_slack_1h']
self.timer['slack'] = self.slack_time_1h
def run(self):
notify('Pcal-{0} is in HIGH_POWER state.'.format(self.ARM))
if self.timer['slack']:
message = f'{self.ARM} PCAL HIGH_POWER state for too long (>{self.slack_time_1h}s)'
kagralib.slackpost("pcal", message, ["U015912SQ5T"])
self.timer['slack'] = self.slack_time_1h
4.Issue: Allow the real-time model to be stopped in the SAFE state.
Update: changed @lpd_check to a comment in the SAFE state.
class SAFE(GuardState):
index = 1
#@lpd_check # -> FAULT
@shutter_check # -> TOSAFE
@loop_check # -> TOSAFE
@injection_check # -> TOSAFE
def main(self):
### safe should be loaded independent on gSDF
if ezca['GRD-CAL_PCAL_{0}_REQUEST_S'.format(gARM)] == self.name:
sdf.restore(gFEC, self.name.lower())
#@lpd_check # -> FAULT
@shutter_check # -> TOSAFE
@loop_check # -> TOSAFE
@injection_check # -> TOSAFE
def run(self):
return True
I had tested the Pcal GRD code.
It works as we expect.
Tanaka, Aritomi
We succeeded in locking DRMI with 1F signals and also in engaging ADS for DRMI (IMMT2, PRM, BS, and SRM). We measured Open loop TFs of DRMI DoFs (PRCL, SRCL, MICH). Current Lock duration is at most 20 mins. However, the lock can be restored automatically soon. According to the results, there seem to be some couplings between the DoFs. Anyway, It is enough duration to characterize DRMI more finely.
### DRMI 1F locked
We checked the current DRMI lock with 1f and 3f mixtur configuration (PRCL:3f, MICH, SRCL:1f, (ref. Takano-san's summary slide)). DRMI could be locked with this configuration but some offsets are necessary as setpoints of errro signals. And lock duration seemed to be short, less than 10 sec. We performed try and error to improve the duration. Eventually, we tried to change PRCL error signal from 3f (REFL135I) to 1f (POP45I) and succeeded in DRMI lock with 1f signal. This time, we changed the sign (3f:+ -> 1f:-) and increased the gain (3f:1 -> 1f:30). Also, we implemented the roll-off filters in loops. Moreover, There seems to be some offsets in error signals
After that, we measured OLTFs of their loops.
Fig.1 shows the PRCL OLTF, red shows the one in locking DRMI with the 1f signal and brue shows the one in locking PRMI with the 1f signal. According to KAGRA schnupp asymmetry, RF45 at AS port should be dark. So the PRCL response should not be changed if we use RF45 for PRCL, that is, the PRCL OLTF in locking DRMI should not be changed from the PRMI one. In this sense, the shape of red gain TF seems to be almost same as the brue one. However, as for the overall gain, we did not tuned finely. So the change of the overall gain is fine. On the other hands, phase TF seems to be changed from the PRMI one. This indicates there are some coupling between PRCL and other DoFs for some reason (MICH detune? upper/lower sideband asymmetry?)
Fig.2 and 3 show the MICH and SRCL OLTFs, respectively. Reds are the ones in locking DRMI, and blues are the ones in locking SRMI. OLTF could not be measued well maybe due to large coupling between DoFs.
### ADS implementation for DRMI
After that, we tried to implement ADS for DRMI. I expected that the response of the RF45 build up power, POP90 shoud not be changed by the SRM exsitance. In this case, I assumed that only SRM ADS should be tuned and tuning for others is not necessary. I chosed AS34 as SRM ADS signal in locking DRMI and performed the phasing of the signals. Then we obtained the demod. phases of SRM ADS PIT:-174 deg(Fig.4), and YAW:170 deg(Fig.5). Thanks to the phasing, Q signals seems to become 0 after the phasing (Fig.6). They seem to be fine.
I engaged SRM ADS at the same time as BS, PRM, and IMMT2 ADSs after DRMI was locked. Fig. 7 shows the time series of ADS error/feedback signals and build up power in PRC (POP90) and SRC(AS34). After calming down the feedback signals, especially SRM YAW, POP90 and AS34 seems to be improved.
Now, the lock duratiion of DRMI with ADS is at most 20 mins (fig.8). For now, we do not investigate the cause of lock loss. Tomorrow, we will perform the DRMI characterization.


The fitting results for the individual PRY resonance peaks presented in klog:37209 are summarized below. The measurement data are stored in Dropbox → All files/Dropbox KAGRA/Measurements/IFO/PRCL/PRCL_OMC_REFL_beat_signal_LO_sweep/2026_07_14_PRY.
- Figure 1: Around 190 MHz, without a linear background. Using data from 186.5 MHz to 187.4 MHz, the fitted peak frequency is 186.9075 ± 0.0027 MHz.
Figure 2: Around 190 MHz, with a linear background. Using data from 186.5 MHz to 187.4 MHz, the fitted peak frequency is 186.9512 ± 0.0049 MHz.
- Figure 3: Around 160 MHz, without a linear background. Using data from 163.4 MHz to 164.4 MHz, the fitted peak frequency is 163.8465 ± 0.0039 MHz.
Figure 4: Around 160 MHz, with a linear background. Using data from 163.4 MHz to 164.4 MHz, the fitted peak frequency is 163.8930 ± 0.0044 MHz.
- Figure 5: Around 140 MHz, without a linear background. Using data from 131.05 MHz to 132.05 MHz, the fitted peak frequency is 131.4789 ± 0.0028 MHz.
Figure 6: Around 140 MHz, with a linear background. Using data from 131.05 MHz to 132.05 MHz, the fitted peak frequency is 131.506 ± 0.010 MHz.
- Figure 7: Around −140 MHz, without a linear background. Using data from 115 MHz to 116 MHz, the fitted peak frequency is 115.5063 ± 0.0042 MHz.
Figure 8: Around −140 MHz, with a linear background. Using data from 115 MHz to 116 MHz, the fitted peak frequency is 115.4978 ± 0.0068 MHz.
- Figure 9: Around −160 MHz, without a linear background. Using data from 156.6 MHz to 157.6 MHz, the fitted peak frequency is 157.0631 ± 0.0042 MHz.
Figure 10: Around −160 MHz, with a linear background. Using data from 156.6 MHz to 157.6 MHz, the fitted peak frequency is 157.0710 ± 0.0098 MHz.
- Figure 11: Around −190 MHz, without a linear background. Using data from 189.1 MHz to 189.8 MHz, the fitted peak frequency is 189.3984 ± 0.0065 MHz.
Figure 12: Around −190 MHz, with a linear background. Using data from 189.1 MHz to 189.8 MHz, the fitted peak frequency is 189.363 ± 0.018 MHz.


The fitting results for the individual SRY resonance peaks presented in klog:37209 are summarized below. The measurement data are stored in Dropbox → All files/Dropbox KAGRA/Measurements/IFO/SRCL/SRCL_OMC_REFL_beat_signal_LO_sweep/2026_07_14_SRY.
- Figure 1: Around 190 MHz, without a linear background. Using data from 186.4 MHz to 187.1 MHz, the fitted peak frequency is 186.8382 ± 0.0027 MHz.
Figure 2: Around 190 MHz, with a linear background. Using data from 186.4 MHz to 187.1 MHz, the fitted peak frequency is 186.908 ± 0.022 MHz.
- Figure 3: Around 160 MHz, without a linear background. Using data from 165.6 MHz to 166.4 MHz, the fitted peak frequency is 166.0614 ± 0.0055 MHz.
Figure 4: Around 160 MHz, with a linear background. Using data from 165.6 MHz to 166.4 MHz, the fitted peak frequency is 166.204 ± 0.049 MHz.
- Figure 5: Around 140 MHz, without a linear background. Using data from 130.96 MHz to 131.69 MHz, the fitted peak frequency is 131.4068 ± 0.0033 MHz.
Figure 6: Around 140 MHz, with a linear background. Using data from 130.96 MHz to 131.69 MHz, the fitted peak frequency is 131.480 ± 0.012 MHz.
- Figure 7: Around −140 MHz, without a linear background. Using data from 126.8 MHz to 127.5 MHz, the fitted peak frequency is 127.0443 ± 0.0054 MHz.
Figure 8: Around −140 MHz, with a linear background. Using data from 126.8 MHz to 127.5 MHz, the fitted peak frequency is 126.73 ± 0.47 MHz.
- Figure 9: Around −160 MHz, without a linear background. Using data from 159.1 MHz to 159.9 MHz, the fitted peak frequency is 159.4293 ± 0.0031 MHz.
Figure 10: Around −160 MHz, with a linear background. Using data from 159.1 MHz to 159.9 MHz, the fitted peak frequency is 159.372 ± 0.016 MHz.
- Figure 11: Around −190 MHz, without a linear background. Using data from 189.1 MHz to 189.87 MHz, the fitted peak frequency is 189.3517 ± 0.0053 MHz.
Figure 12: Around −190 MHz, with a linear background. Using data from 189.1 MHz to 189.87 MHz, the fitted peak frequency is 189.295 ± 0.024 MHz.


A server chassis was brought back to Mozumi.
[Kimura and Yasui]
On July 15, as part of maintenance work on the cryogenic cooling units, we set up two valve units for the radiation shield cryo-coolers (IXC P-53 and IXC P-55).
The remaining tasks are filling the system with G-1 class helium gas up to 15 bar and performing leak tests on all connections.
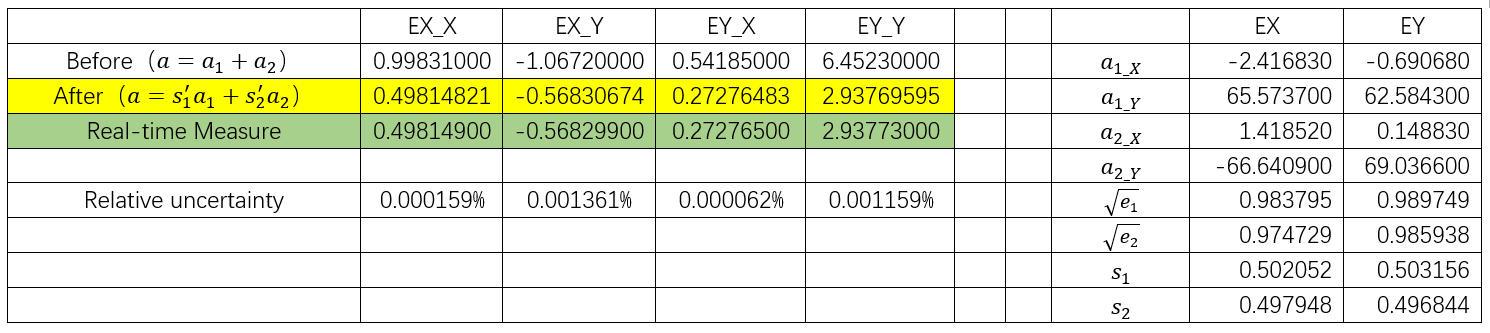
We checked the updated model has successfully corrected the previous systematic error.
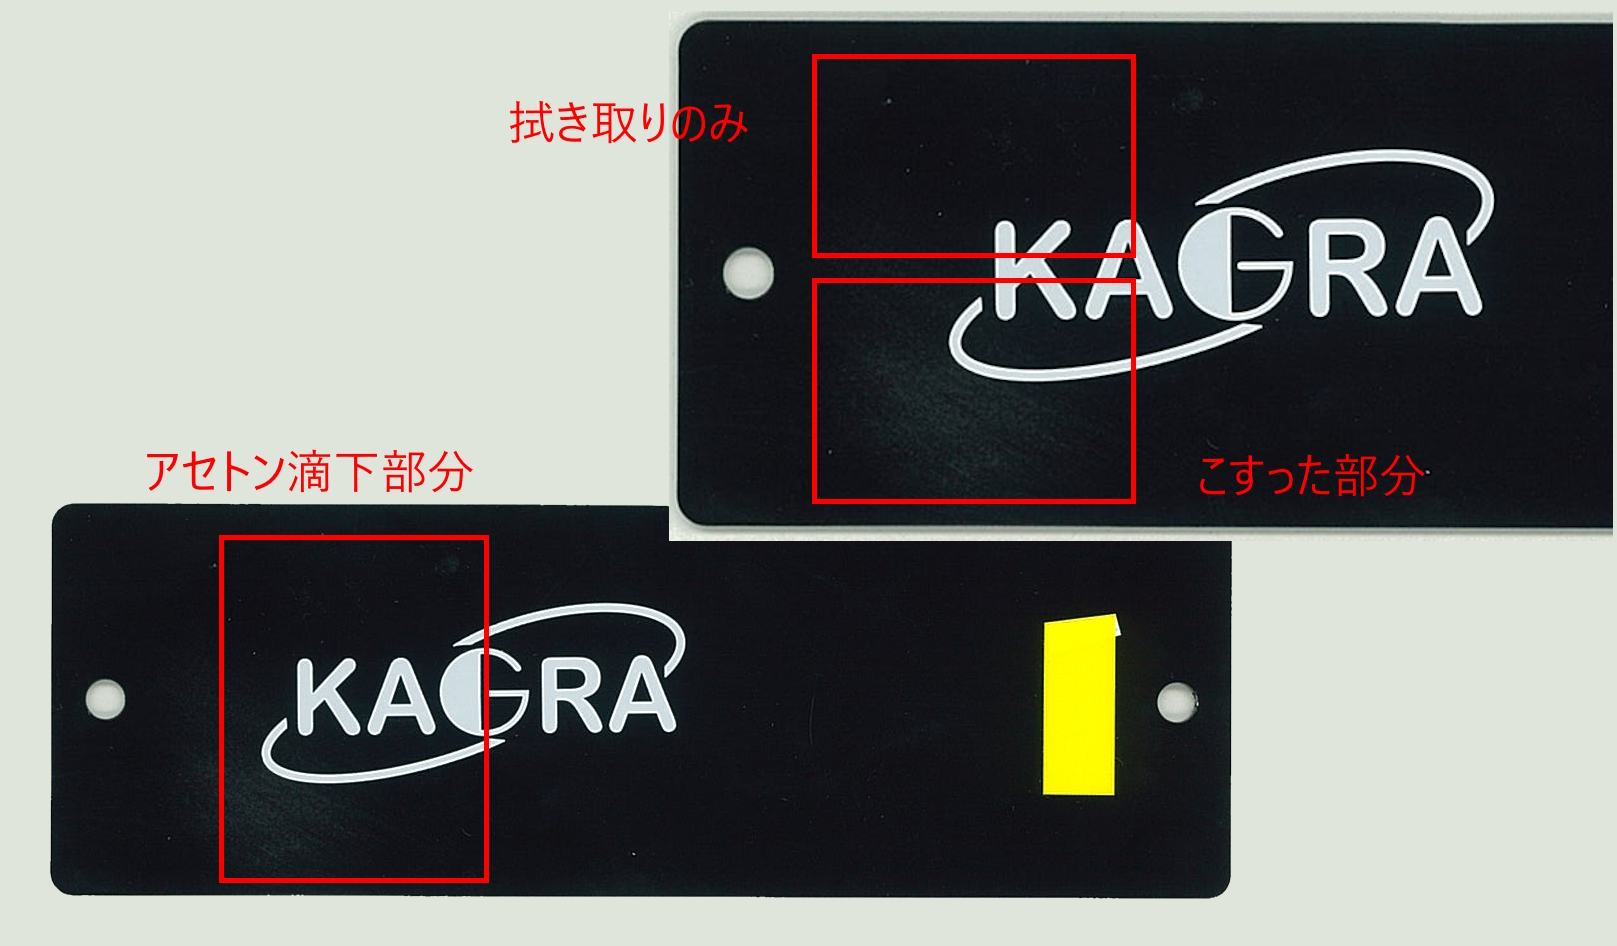
We conducted an acetone application test on IO chassis samples in the central area of the mine.
Procedure
1. Applied a few drops of acetone to the IO chassis sample.
2. Rubbed the area where acetone had been applied with a cloth.
3. Slight color peeling was observed on the rubbed area.
4. Wiped off the acetone from the other areas where it had been applied.
5. No color peeling was observed on the wiped areas.
Although it is difficult to see in the attached photo, color peeling was observed on the rubbed area, but the paint itself did not lift or peel off.

Saito-kun,
Could you upload the overplot graphs of the raw data and the fitting functions similar to fig 2 and 3 in klog37201?
[Aritomi, Ushiba, Tanaka, Saito]
Sub-laser light was injected into the SRY, PRY, PRX, and SRX, and a PLL was established. The LO frequency was then swept to scan the beat signal. Using the maximum hold function of the Moku:Lab spectrum analyzer, transmission power as a function of frequency was recorded around 190 MHz, 160 MHz, 140 MHz, −140 MHz, −160 MHz, and −190 MHz. The data were fitted both with and without a linear background, and the maximum and minimum peak frequencies within the corresponding fitting uncertainties were determined. The cavity lengths were then calculated from these results. The differences between the measured cavity lengths and the design values were 0.15 ± 0.33 cm for PRY and 1.58 ± 0.82 cm for SRY. Therefore, the PRY measurement is consistent with the design value within its uncertainty of 0.33 cm, whereas the SRY measurement differs from the design value by more than the estimated uncertainty, suggesting that the actual cavity length may differ from the design value. The results for PRX and SRX will be reported after the analysis is completed.
- As in the previous measurement (klog:37201), sub-laser light was injected into the SRY, PRY, PRX, and SRX, and a PLL was established. The beat signal was observed using the RFPD installed at OMC REFL. The LO frequency was then swept to scan the beat signal. Using the maximum hold function of the Moku:Lab spectrum analyzer, transmission power as a function of frequency was measured around 190 MHz, 160 MHz, 140 MHz, −140 MHz, −160 MHz, and −190 MHz for each cavity. Here, negative frequencies correspond to the case where the sub-laser frequency was lower than that of the main laser.
-
For the data near each resonance peak, fitting was performed both with and without a linear background, following the same procedure as in the previous analysis (klog:37201). From the fitted peak frequencies and their uncertainties, the maximum and minimum frequencies within the fitting uncertainty were determined. The overall uncertainty range was then defined as the largest and smallest values obtained from both fitting models. The following data were used to determine the PRY and SRY cavity lengths.
PRY
Minimum (MHz) Maximum (MHz)
186.9049 186.9561
163.8426 163.8974
131.4761 131.5159
-115.5105 -115.4909
-157.0807 -157.0589
-189.4049 -189.3442
SRY
Minimum (MHz) Maximum (MHz)
186.8354 186.9305
166.0559 166.2530
131.4035 131.4918
-127.2003 -126.2609
-159.4324 -159.3557
-189.3570 -189.2707
-
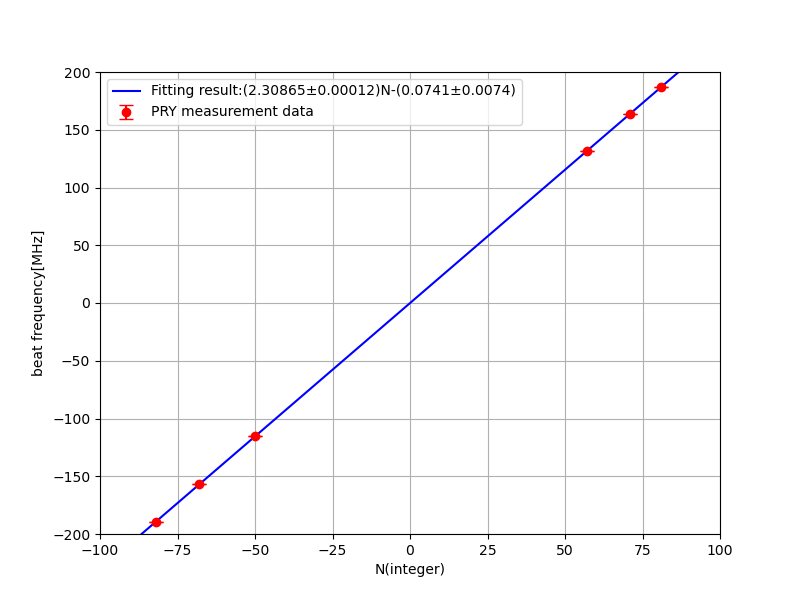
From the measurement results, the midpoint between the minimum and maximum frequencies was calculated for each resonance. These midpoint frequencies were divided by the FSR calculated from the design cavity lengths (64.9265 m for PRY and 64.9264 m for SRY). The resulting values were rounded to the nearest integers, and the measured frequencies were fitted with the linear function AN+B, where A and B are fitting parameters and N is the rounded integer. The fitting results were as follows.
PRY (Fig. 1)
A: 2.30865 ± 0.00012 MHz
B: −0.0741 ± 0.0074 MHz
SRY (Fig. 2)
A: 2.30815 ± 0.00029 MHz
B: −0.092 ± 0.021 MHz
-
Since A corresponds to the FSR, the cavity lengths were calculated from the fitted values of A.
PRY
Measured cavity length: 64.9280 ± 0.0033 m
Design value: 64.9265 m
Difference (measured − design): 0.15 ± 0.33 cm
SRY
Measured cavity length: 64.9422 ± 0.0082 m
Design value: 64.9264 m
Difference (measured − design): 1.58 ± 0.82 cmTherefore, the PRY measurement is consistent with the design value within the uncertainty of 0.33 cm. In contrast, the difference between the measured and design values for SRY exceeds the estimated uncertainty, suggesting that the actual SRY cavity length may differ from the design value. The results for PRX and SRX will be posted once the analysis has been completed.


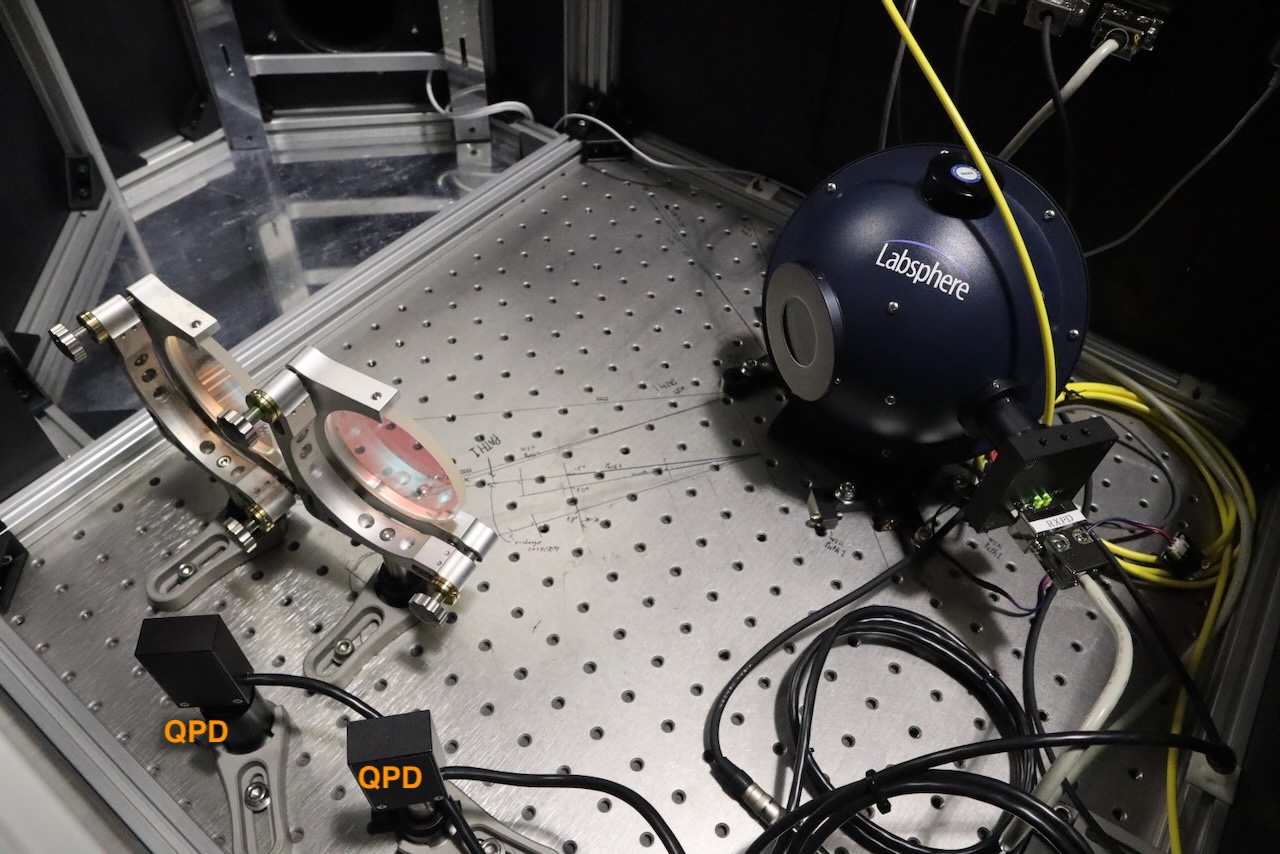
With Misato Onishi, Yuli Liang, Jinshui Tian
We installed 2 QPDs in Rx module on 7/14 for the Pcal beam monitoring.
And, I took Tcam data with changing Pcal beam positions by the pico PCAL_EY2 in the 7/15 morning.
The data will be analysed to check the QPD performance.
