[Fujimoto, Saito]
We adjusted the HWP and polarizer for SRY to obtain a clean peak and acquired the beat signal data. After fitting the data, the deviation of the SRY length from the design value was found to be 2.332(93) cm. This result is consistent with the previous measurements reported in klog:37455: the deviations from the design value were 2.168(80) cm with the HWP scale at 14 and the polarizer scale at 295, and 2.319(71) cm with the HWP scale at 59 and the polarizer scale at 250. However, it is slightly different from the result obtained before moving the lens to improve the mode-matching ratio (klog:37250), where the deviation of the SRY length from the design value was 1.757(50) cm.
Using the SRX result from klog:37450 and the results from klog:37458, I calculated the SRC length and Schnupp asymmetry as follows:
SRC length: 66.61860(51) m
Schnupp asymmetry calculated from the SRC: 3.33775(102) m
Schnupp asymmetry from the weighted average: 3.33842(49) m
These results are consistent with the previous measurements reported in klog:37455 and klog:37458. With the HWP scale at 14 and the polarizer scale at 295, the SRC length was 66.61778(45) m, the Schnupp asymmetry calculated from the SRC was 3.339390(904) m, and the Schnupp asymmetry from the weighted average was 3.33884(48) m. With the HWP scale at 59 and the polarizer scale at 250, the corresponding values were 66.61853(41) m, 3.337880(825) m, and 3.33839(47) m, respectively. Comparing these results with the measurements before moving the lens to improve the mode-matching ratio (klog:37260), where the SRC length was 66.61409(70) m, the Schnupp asymmetry calculated from the SRC was 3.34023(139) m, and the Schnupp asymmetry from the weighted average was 3.33791(45) m, the SRC length and the Schnupp asymmetry calculated from the SRC are somewhat different. However, the Schnupp asymmetry obtained from the weighted average is consistent with the previous result.
-
First, we set the HWP scale at the sub-laser to 82 (S polarization) and set the polarizer in front of the RFPD to S polarization. With the main laser turned off, we adjusted the alignment of the sub-laser to SRY. Next, we locked the main laser to SRY, adjusted the alignment to the RFPD, and checked the beat signal. However, as in the previous measurement (klog:37440), the peak was split. Therefore, we adjusted the alignment of the sub-laser to maximize the beat signal, and rotated the HWP and polarizer to maximize the beat signal as well. The HWP scale was then 124 (P polarization), and the polarizer scale was 2 (P polarization). However, the peak was split into three peaks.
Next, we turned off the main laser and adjusted the alignment again using the sub-laser. When the polarizer in front of the RFPD was removed, the maximum signal was -16 counts for S-polarized injection and -52 counts for P-polarized injection, giving a difference of about a factor of three. The peak also appeared cleaner as a single peak for S polarization, whereas it was split into about three peaks for P polarization.
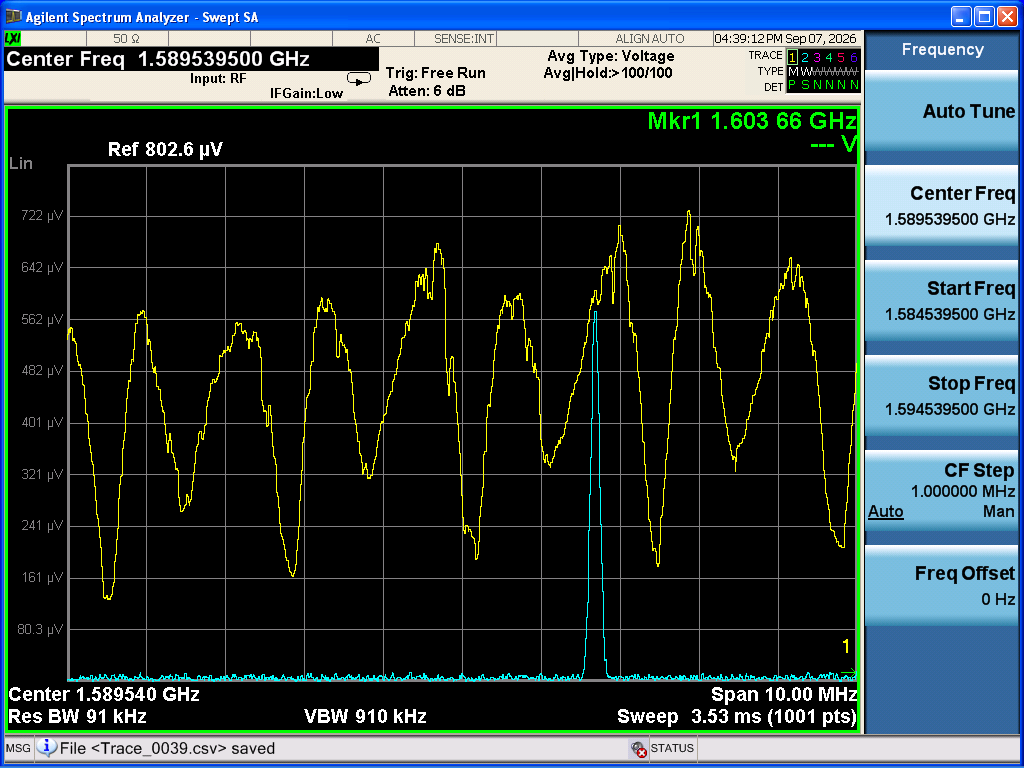
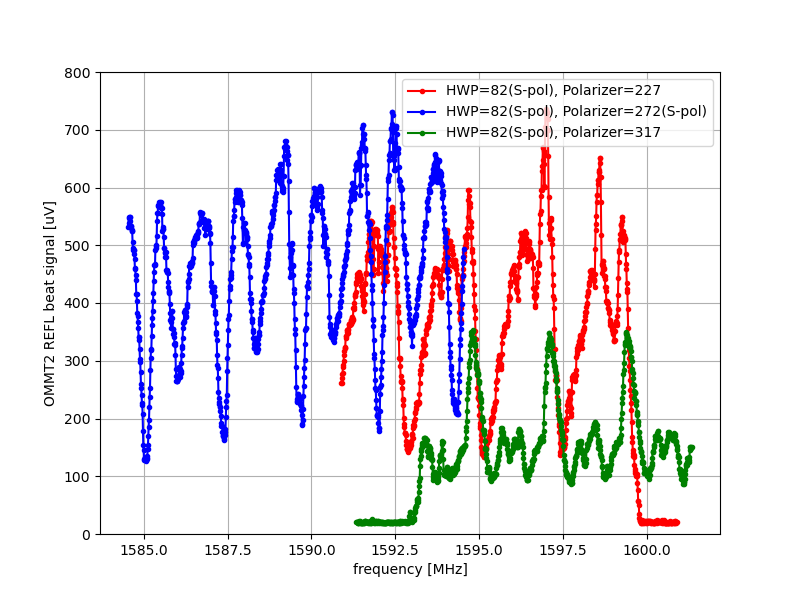
Next, with the HWP scale at 82 (S polarization), we set the polarizer scale to 272 (S polarization). Peaks separated by approximately 1 MHz were observed (Photo 1). we then set the polarizer scale to 317, and one of the two peaks became larger (Photo 2). When I set the polarizer scale to 227, the other peak appeared to become larger (Photo 3). The three cases are plotted together in Fig. 1.
-
Next, we acquired beat signal data around 1.6 GHz (Photo 4), 0.8 GHz (Photo 5), -0.8 GHz (Photo 6), and -1.6 GHz (Photo 7) with the HWP scale at 82 and the polarizer scale at 317, where the peak appeared the cleanest. I fitted the obtained SRY data both with and without a linear background. I will post the fitting results for the individual peaks later. From the peak frequencies obtained from the fits and their uncertainties, I calculated the minimum and maximum values within the uncertainty ranges. I then took the overall minimum and maximum values from the two fitting models, with and without a linear background, as the uncertainty range.
Therefore, I used the following data to determine the SRY length:Minimum (MHz) Maximum (MHz)
1610.8271 1610.9060
803.0776 803.1743
-800.9112 -800.8258
-1592.4969 -1592.4366I set the FSR index of the data around -1.6 GHz to 0. For each pair of nearby peak frequencies, I calculated the frequency difference and divided it by the design value of the FSR. I then rounded the resulting value to the nearest integer to determine the FSR index. I fitted the measured peak frequencies as a function of the FSR index using the linear function AN+B, where A and B are fitting parameters and N is the FSR index.
The fitting results are shown below (Fig. 2):A: 2.307881(33) MHz
B: -1592.467(27) MHzSince A corresponds to the FSR, I calculated the SRY length from the fitted value of A, obtaining:
Fitted value: 64.94972(93) m
Design value: 64.9264 m
Difference from the design value (fitted value − design value): 2.332(93) cmThis result is consistent with the previous measurements reported in klog:37455: the deviations from the design value were 2.168(80) cm with the HWP scale at 14 and the polarizer scale at 295, and 2.319(71) cm with the HWP scale at 59 and the polarizer scale at 250. However, it is slightly different from the result obtained before moving the lens to improve the mode-matching ratio (klog:37250), where the deviation of the SRY length from the design value was 1.757(50) cm.
-
Using the SRX result from klog:37450 and the results from klog:37458, I calculated the SRC length and Schnupp asymmetry as follows:
SRC
Calculated value: 66.61860(51) m
Design value: 66.5913 m
Difference from the design value (calculated value − design value): 2.730(51) cmSchnupp asymmetry calculated from the SRC
Calculated value: 3.33775(102) m
Design value: 3.3298 m
Difference from the design value (calculated value − design value): 0.795(102) cmSchnupp asymmetry
Weighted average: 3.33842(49) m
Design value: 3.3298 m
Difference from the design value (weighted average − design value): 0.862(49) cmThese results are consistent with the previous measurements reported in klog:37455 and klog:37458. With the HWP scale at 14 and the polarizer scale at 295, the SRC length was 66.61778(45) m, the Schnupp asymmetry calculated from the SRC was 3.339390(904) m, and the Schnupp asymmetry from the weighted average was 3.33884(48) m. With the HWP scale at 59 and the polarizer scale at 250, the corresponding values were 66.61853(41) m, 3.337880(825) m, and 3.33839(47) m, respectively. Compared with the measurements before moving the lens to improve the mode-matching ratio (klog:37260), where the SRC length was 66.61409(70) m, the Schnupp asymmetry calculated from the SRC was 3.34023(139) m, and the Schnupp asymmetry from the weighted average was 3.33791(45) m, the SRC length and the Schnupp asymmetry calculated from the SRC are somewhat different. However, the Schnupp asymmetry obtained from the weighted average is consistent with the previous result.