[Fujimoto, Ye, Saito]
We adjusted the HWP and polarizer to obtain clean peaks and acquired beat signal data for PRX and PRY. After fitting the data, the deviations from the design values were 0.926(22) cm for PRX and 0.043(52) cm for PRY. Compared with the previous measurements before moving the lens to improve the mode-matching ratio (klog:37260), which gave deviations of 0.677(11) cm for PRX and -0.107(46) cm for PRY, both results are slightly different.
We also calculated the PRC length and the Schnupp asymmetry from the PRC. Using the Schnupp asymmetry calculated from the SRC in klog:37455, we then calculated the Schnupp asymmetry by taking a weighted average of the two values. The results were as follows:
PRC length: 66.59625(28) m
Schnupp asymmetry calculated from the PRC: 3.338630(565) m
Schnupp asymmetry from the weighted average:
3.33884(48) m when SRY was measured with the HWP scale at 14 and the polarizer scale at 295
3.33839(47) m when SRY was measured with the HWP scale at 59 and the polarizer scale at 250
Compared with the previous measurements before moving the lens to improve the mode-matching ratio (klog:37260), which gave a PRC length of 66.59425(24) m, a Schnupp asymmetry calculated from the PRC of 3.337640(473) m, and a Schnupp asymmetry from the weighted average of 3.33791(45) m, the PRC length is slightly different. However, there is no inconsistency between the Schnupp asymmetry calculated from the PRC and that calculated from the weighted average.
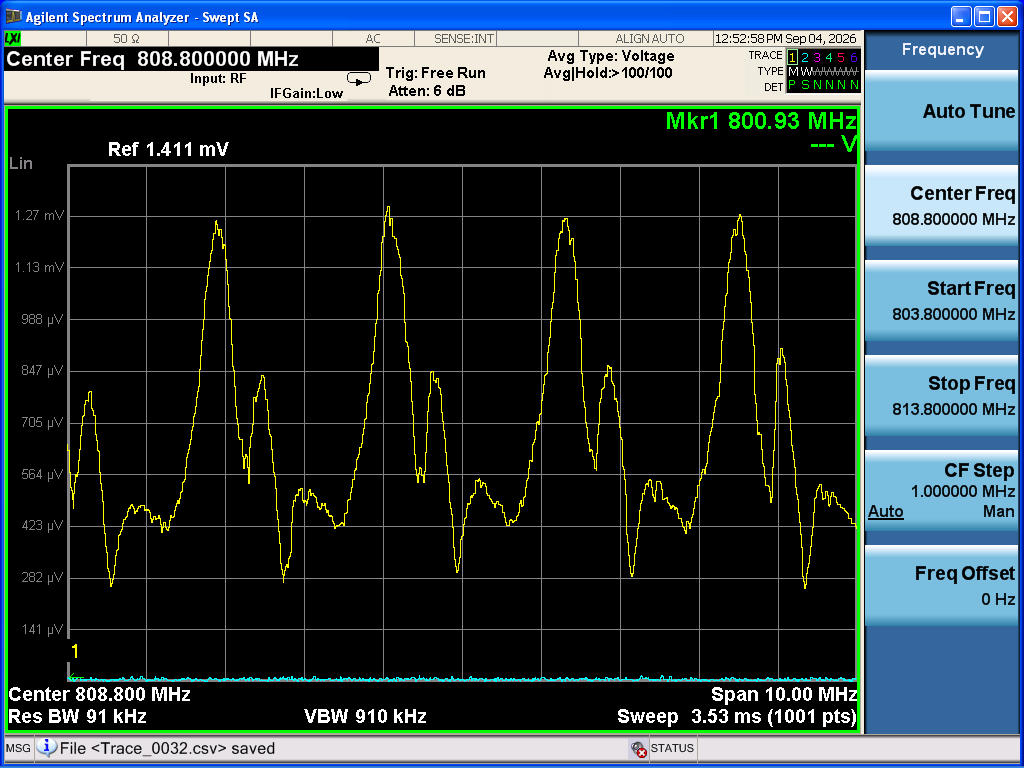
- To acquire the beat signal data for PRX, we first turned off the main laser and adjusted the alignment of the sub-laser. We then turned on the main laser and adjusted the alignment to the RFPD. When we checked the beat signal with the HWP scale at 82 and the polarizer scale at 50 using a spectrum analyzer, the peak was not clean (Photo 1). We therefore rotated the HWP and polarizer. The peak became clean when the HWP scale was set to 70 and the polarizer scale was set to 254. We then acquired data around 1.6 GHz (Photo 2), 0.8 GHz (Photo 3), -0.8 GHz (Photo 4), and -1.6 GHz (Photo 5).
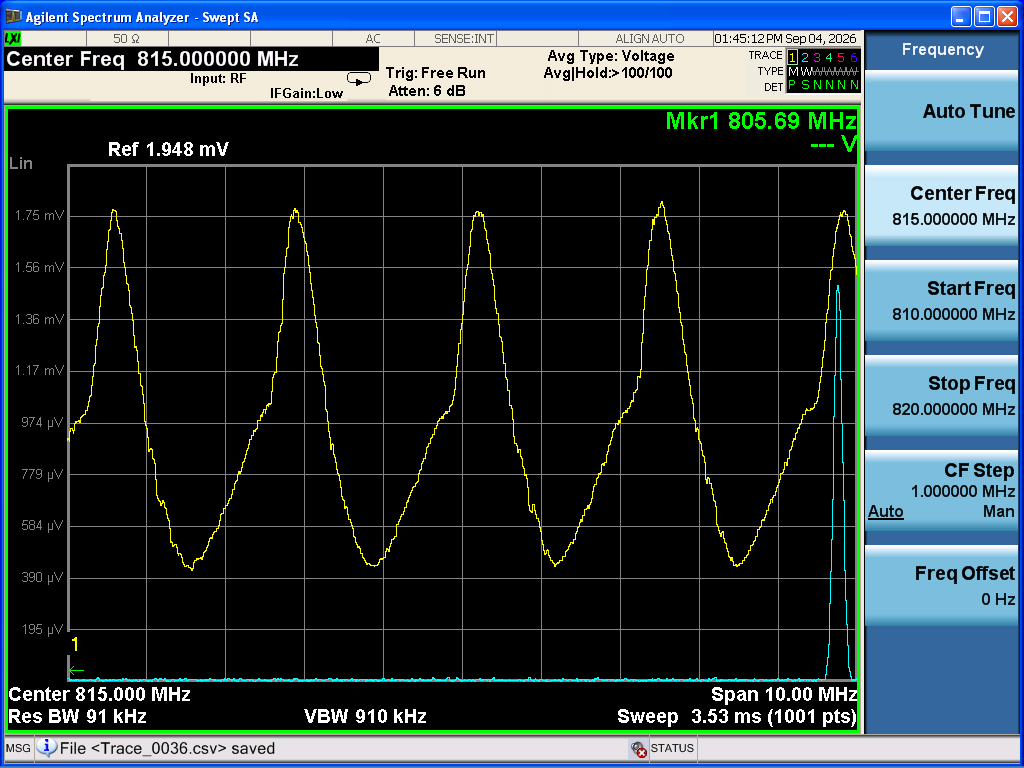
- Similarly, for PRY, we first turned off the main laser and adjusted the alignment of the sub-laser. We then turned on the main laser and adjusted the alignment to the RFPD. We set the HWP scale to 16 and the polarizer scale to 117 to obtain clean peaks, and acquired data around 1.6 GHz (Photo 6), 0.8 GHz (Photo 7), -0.8 GHz (Photo 8), and -1.6 GHz (Photo 9).
-
We then fitted the obtained PRX and PRY data with and without a linear background. I will post the fitting results for the individual peaks later. From the peak frequencies obtained from the fits and their uncertainties, we calculated the minimum and maximum values within the uncertainty ranges. We then took the overall minimum and maximum values from both fitting models, with and without a linear background, as the uncertainty range. The following data were therefore used to determine the PRX and PRY lengths.
PRX
Minimum (MHz) Maximum (MHz)
1591.7738 1591.8070
807.8792 807.8958
-821.3516 -821.3318
-1563.5557 -1563.5479PRY
Minimum (MHz) Maximum (MHz)
1600.1604 1600.1846
810.5910 810.6133
-817.0346 -816.9907
-1597.4175 -1597.3530We set the FSR index of the data around -1.6 GHz to 0. For each pair of nearby peak frequencies, we calculated the frequency difference and divided it by the design value of the FSR. We then rounded the resulting value to the nearest integer to determine the FSR index. We fitted the measured peak frequencies as a function of the FSR index using the linear function AN+B, where A and B are fitting parameters and N is the FSR index.
The fitting results were as follows.
PRX (Fig. 1)
A: 2.1957810(72) MHz
B: -1563.5483(38) MHzPRY (Fig. 2)
A: 2.308691(19) MHz
B: -1597.363(21) MHzSince A corresponds to the FSR, we calculated the PRX and PRY lengths from the fitted values of A. The results were as follows.
PRX
Fitted length: 68.26556(22) m
Design value: 68.2563 m
Difference from the design value (fitted length − design value): 0.926(22) cmPRY
Fitted length: 64.92693(52) m
Design value: 64.9265 m
Difference from the design value (fitted length − design value): 0.043(52) cmCompared with the previous measurements before moving the lens to improve the mode-matching ratio (klog:37260), which gave deviations of 0.677(11) cm for PRX and -0.107(46) cm for PRY, both results are slightly different.
-
We also calculated the PRC length and the Schnupp asymmetry from the PRC. Using the Schnupp asymmetry calculated from the SRC in klog:37455, we calculated the Schnupp asymmetry from the weighted average as follows.
PRC
Calculated value: 66.59625(28) m
Design value: 66.5914 m
Difference from the design value (calculated value − design value): 0.485(28) cmSchnupp asymmetry calculated from the PRC
Calculated value: 3.338630(565) m
Design value: 3.3298 m
Difference from the design value (calculated value − design value): 0.8830(565) cmSchnupp asymmetry
When SRY was measured with the HWP scale at 14 and the polarizer scale at 295:
Weighted average: 3.33884(48) m
Design value: 3.3298 m
Difference from the design value (weighted average − design value): 0.904(48) cmWhen SRY was measured with the HWP scale at 59 and the polarizer scale at 250:
Weighted average: 3.33839(47) m
Design value: 3.3298 m
Difference from the design value (weighted average − design value): 0.859(47) cmCompared with the previous measurements before moving the lens to improve the mode-matching ratio (klog:37260), which gave a PRC length of 66.59425(24) m, a Schnupp asymmetry calculated from the PRC of 3.337640(473) m, and a Schnupp asymmetry from the weighted average of 3.33791(45) m, the PRC length is slightly different. However, there is no inconsistency between the Schnupp asymmetry calculated from the PRC and that calculated from the weighted average.