[Fujimoto, Ye, Saito]
After Takahashi-san and Ushiba-san changed the length of SRX (klog:37449), and again after they restored the length, we acquired beat signal data around 1.6, 0.8, -0.8, and -1.6 GHz. We then calculated the SRX length. The deviations from the design value were 3.050(11) cm after the length was changed and 3.127(42) cm after the length was restored. Comparing the result after restoring the length with the previous measurement (klog:37393), which gave a deviation of 3.01(18) cm from the design value, we consider the results to be consistent. However, the result differs slightly from the result before moving the lens to improve the mode-matching ratio (klog:37260), which gave a deviation of 2.80(13) cm. According to klog:37449, the SRX length decreased by 1 mm after the length was changed. The two measurements also show that the SRX length decreased by approximately 1 mm after the length was changed. Therefore, we confirmed that this measurement method can detect changes in the cavity length.
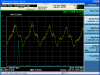
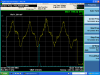
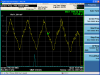
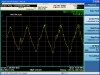
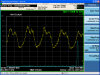
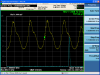
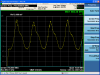
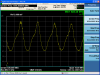
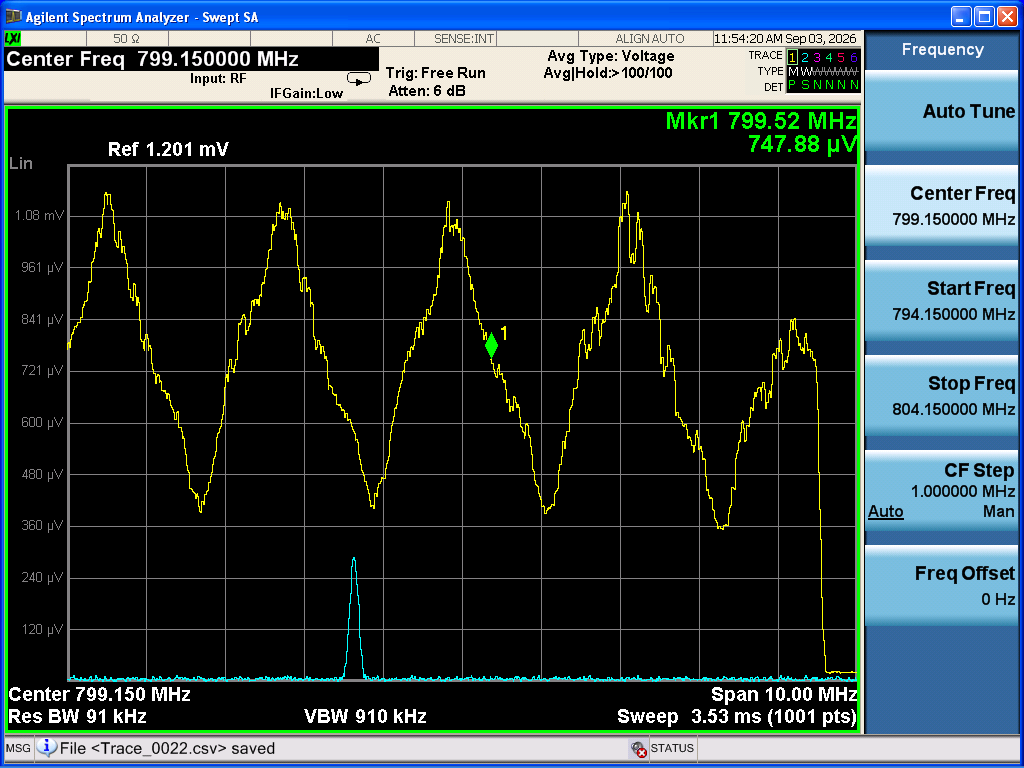
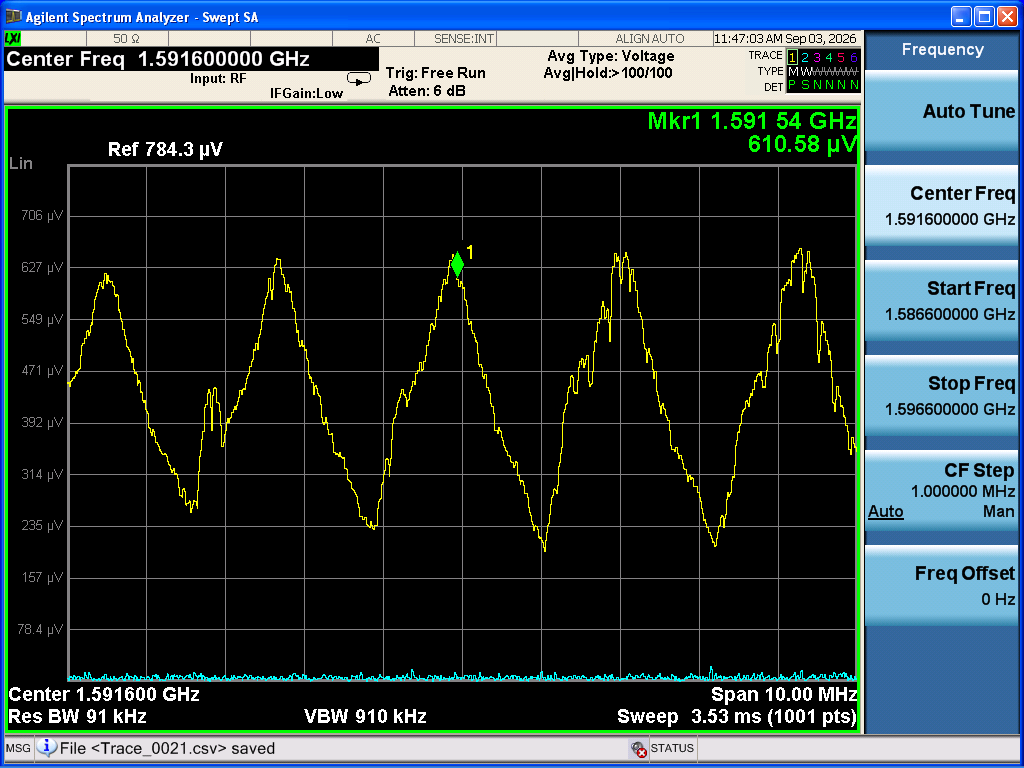
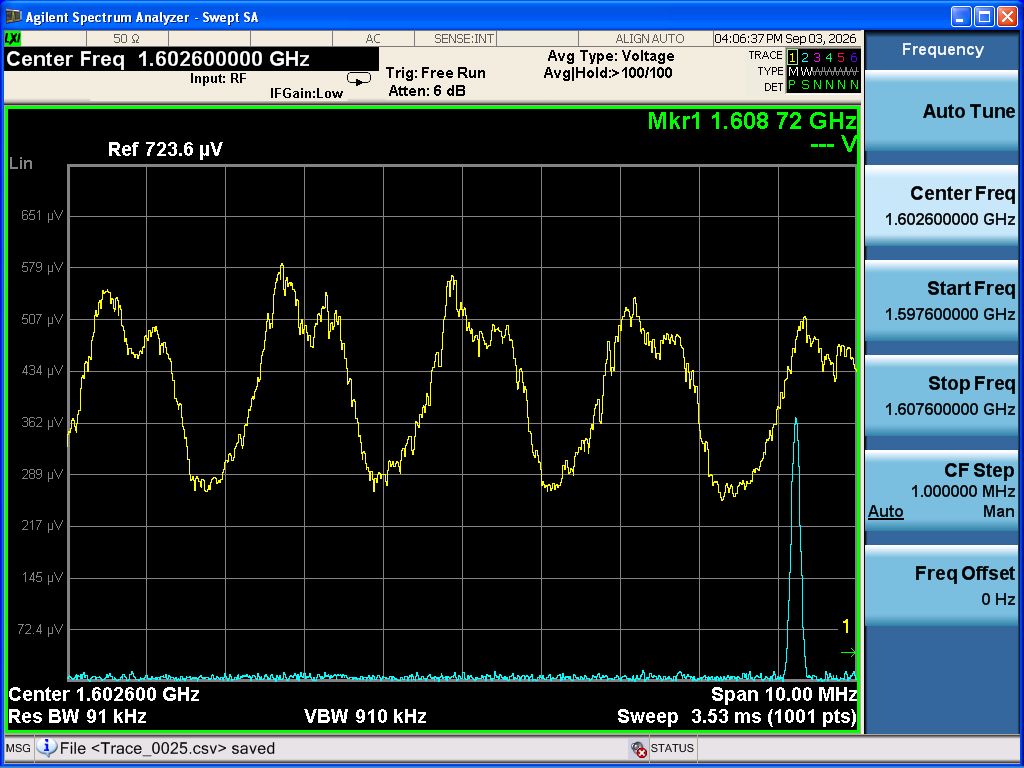
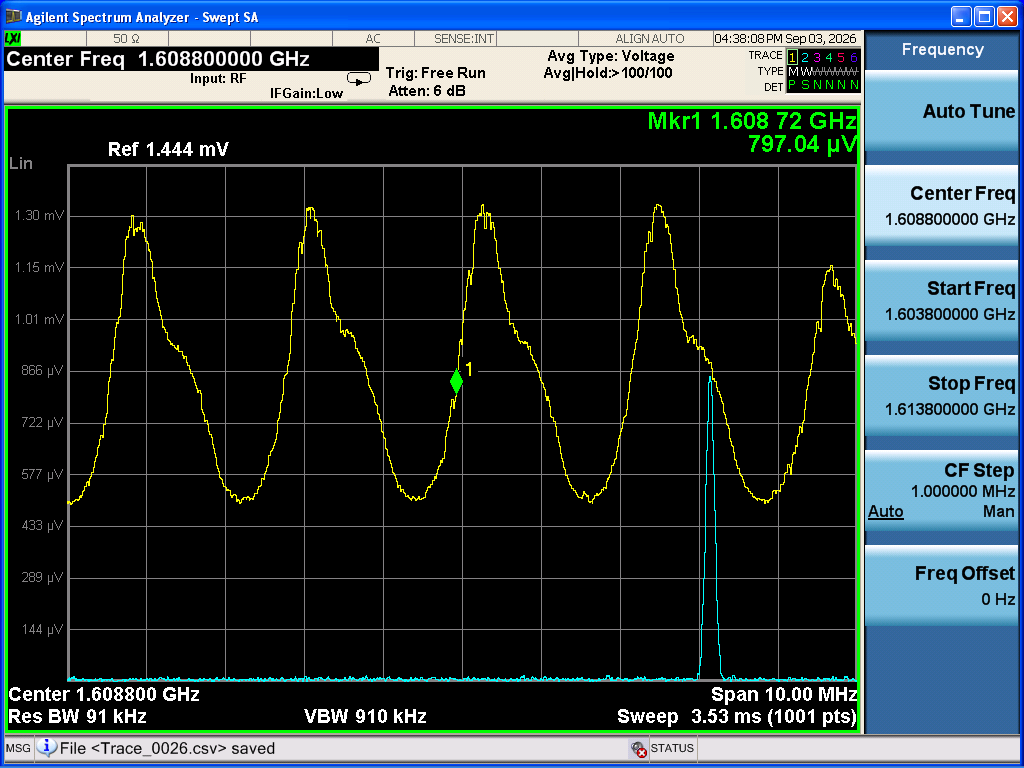
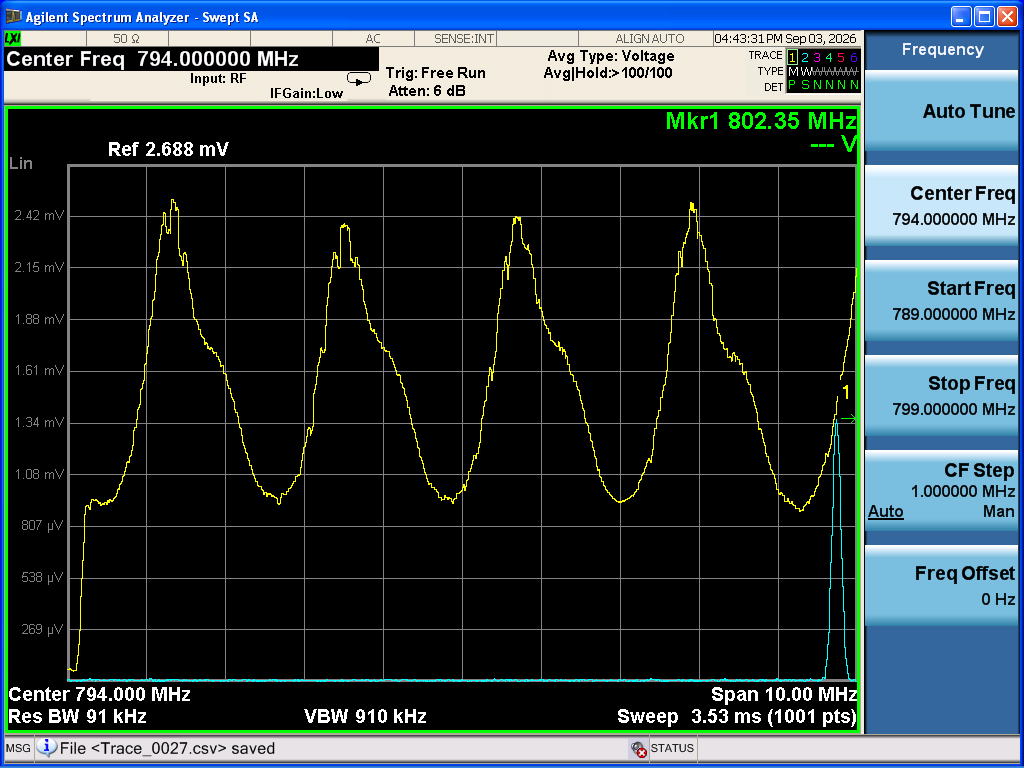
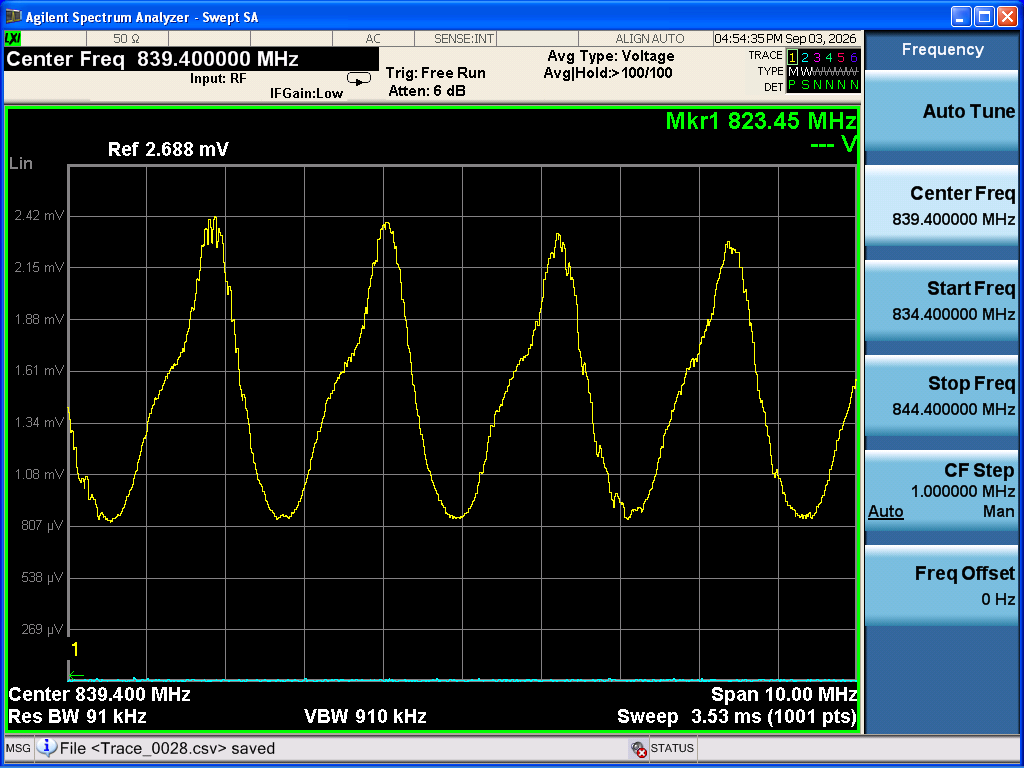
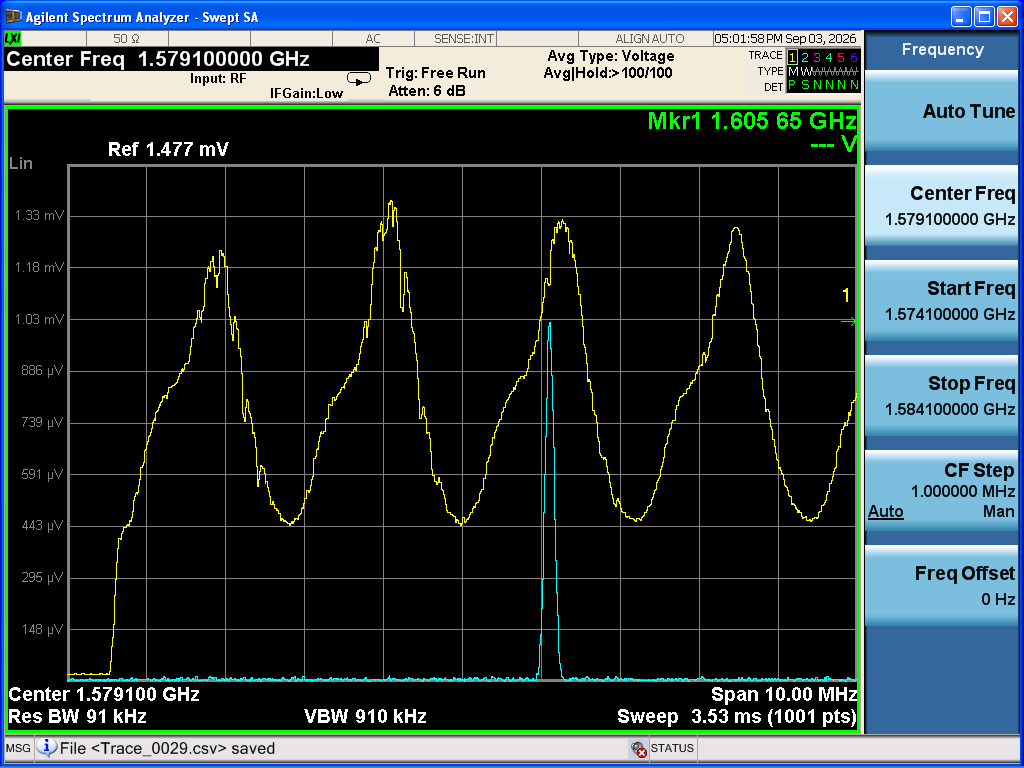
- After Takahashi-san and Ushiba-san changed the SRX length (klog:37449), we removed the mirror that had been placed in the optical path to the RFPD at the reflection port of OMMT2 in the previous measurement (klog:37445). We then injected the light into the RFPD and adjusted the alignment to maximize the DC output. Next, we injected the sub-laser with the HWP scale set to 82, corresponding to S-polarization. We observed the beat signal with a spectrum analyzer and rotated the polarizer to maximize the beat signal. The scale reading was then set to 50. We acquired data when the beat signal was around 1.6 GHz (Photo 1), 0.8 GHz (Photo 2), -0.8 GHz (Photo 3), and -1.6 GHz (Photo 4).
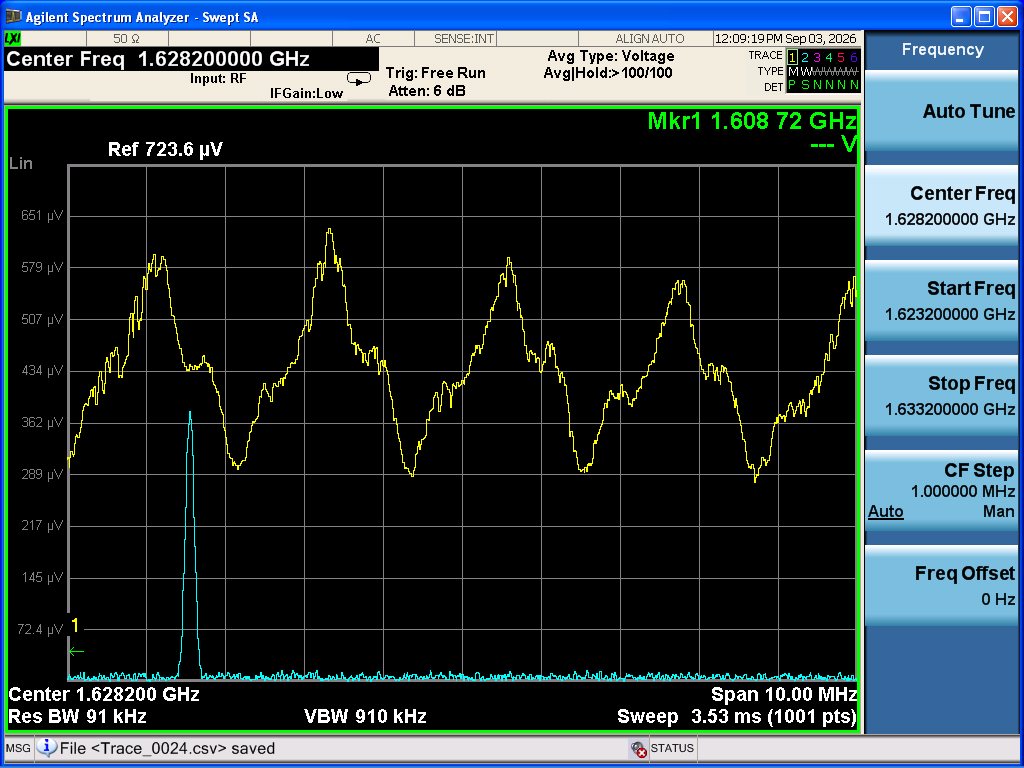
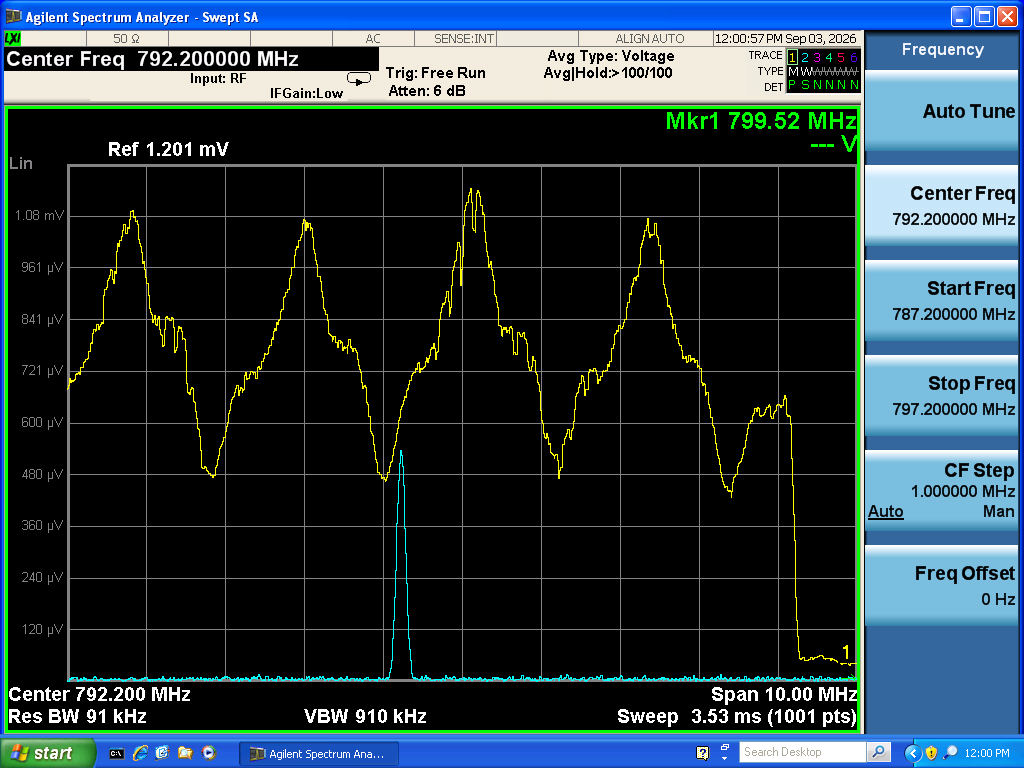
- After Takahashi-san and Ushiba-san restored the SRX length, we adjusted the alignment to maximize the DC output of the RFPD. When we checked the beat signal around 1.6 GHz, the peak appeared to be split into two peaks (Photo 5). We therefore turned off the main laser and adjusted the alignment of the sub-laser. However, the alignment already appeared to be sufficiently optimized, and there was almost no change. We then turned the main laser back on and checked the beat signal again. The peak had become clean, so we acquired data when the beat signal was around 1.6 GHz (Photo 6), 0.8 GHz (Photo 7), -0.8 GHz (Photo 8), and -1.6 GHz (Photo 9).
-
We fitted the data around each peak with and without a linear background. I will post the fitting results for these peaks later. From the peak frequencies obtained from the fits and their uncertainties, we calculated the minimum and maximum values within the uncertainty ranges. We then took the overall minimum and maximum values from both fitting models, with and without a linear background, as the uncertainty range. The following data were therefore used to determine the SRX length.
After changing the length
Minimum (MHz) Maximum (MHz)
1630.9283 1630.9360
790.2038 790.2172
-799.0422 -799.0312
-1589.2869 -1589.2793After restoring the length
Minimum (MHz) Maximum (MHz)
1609.0587 1609.0987
796.8883 796.9306
-836.2669 -836.2342
-1578.1785 -1578.1583We set the FSR index of the data around -1.6 GHz to 0. For each pair of adjacent peak frequencies, we calculated the frequency difference and divided it by the design value of the FSR. We then rounded the resulting value to the nearest integer to determine the FSR index. We fitted the measured peak frequencies as a function of the FSR index using the following linear function AN+B where A and B are fitting parameters and N is the FSR index.
The fitting results were as follows.
After changing the length (Fig. 1)
A: 2.1951014(35) MHz
B: -1589.2804(34) MHzAfter restoring the length (Fig. 2)
A: 2.195077(14) MHz
B: -1578.1721(92) MHzSince A corresponds to the FSR, we calculated the SRX length from the fitted value of A. The results were as follows.
After changing the length
Fitted length: 68.28670(11) m
Design value: 68.2562 m
Difference from the design value (fitted length − design value): 3.050(11) cmAfter restoring the length
Fitted length: 68.28747(42) m
Design value: 68.2562 m
Difference from the design value (fitted length − design value): 3.127(42) cmComparing the result after restoring the length with the previous measurement (klog:37393), which gave a deviation of 3.01(18) cm from the design value, we consider the results to be consistent. However, the result differs slightly from the result before moving the lens to improve the mode-matching ratio (klog:37260), which gave a deviation of 2.80(13) cm.
According to klog:37449, the SRX length decreased by 1 mm after the length was changed. The two measurements also show that the SRX length decreased by approximately 1 mm after the length was changed. Therefore, we confirmed that this measurement method can detect changes in the cavity length.