Reports 1-1 of 1 Clear search Modify search
MIF (General)
kentaro.komori - 0:25 Monday 22 July 2024 (30498) Print this report
Consideration of OMC trans noise caused by OMC length noise transferred from the OMC chamber optics table

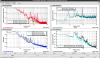
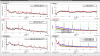
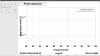
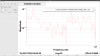
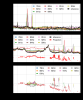
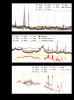
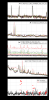
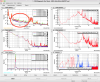
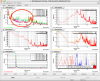
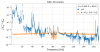
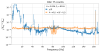
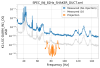
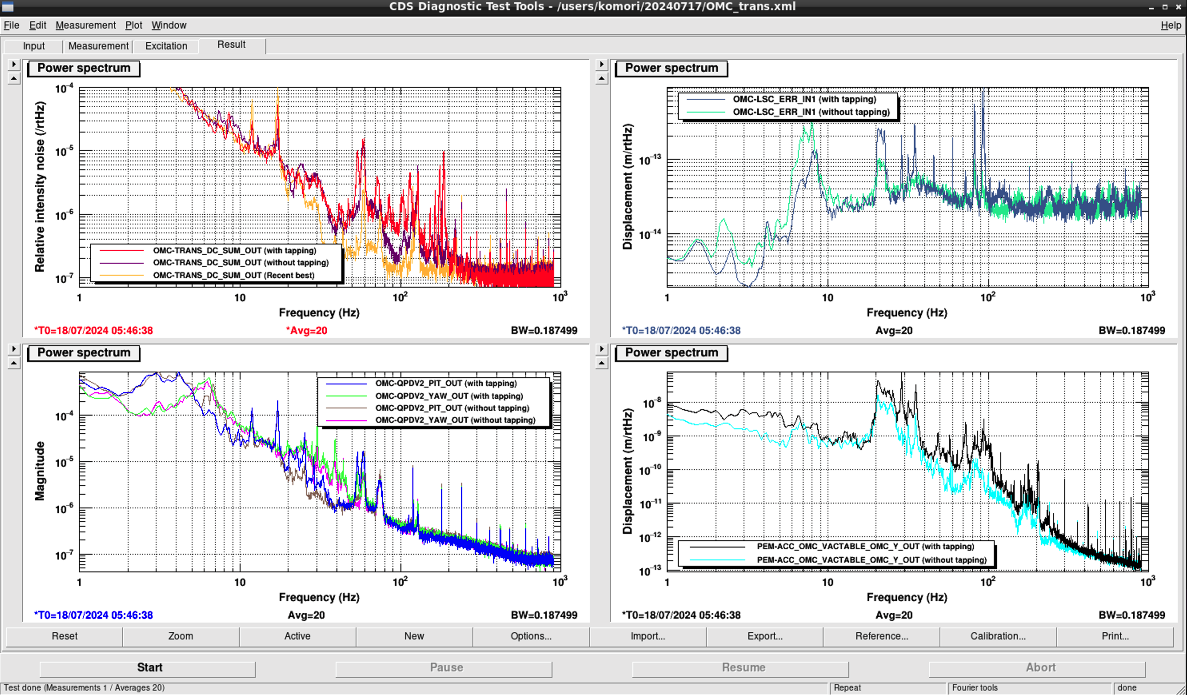
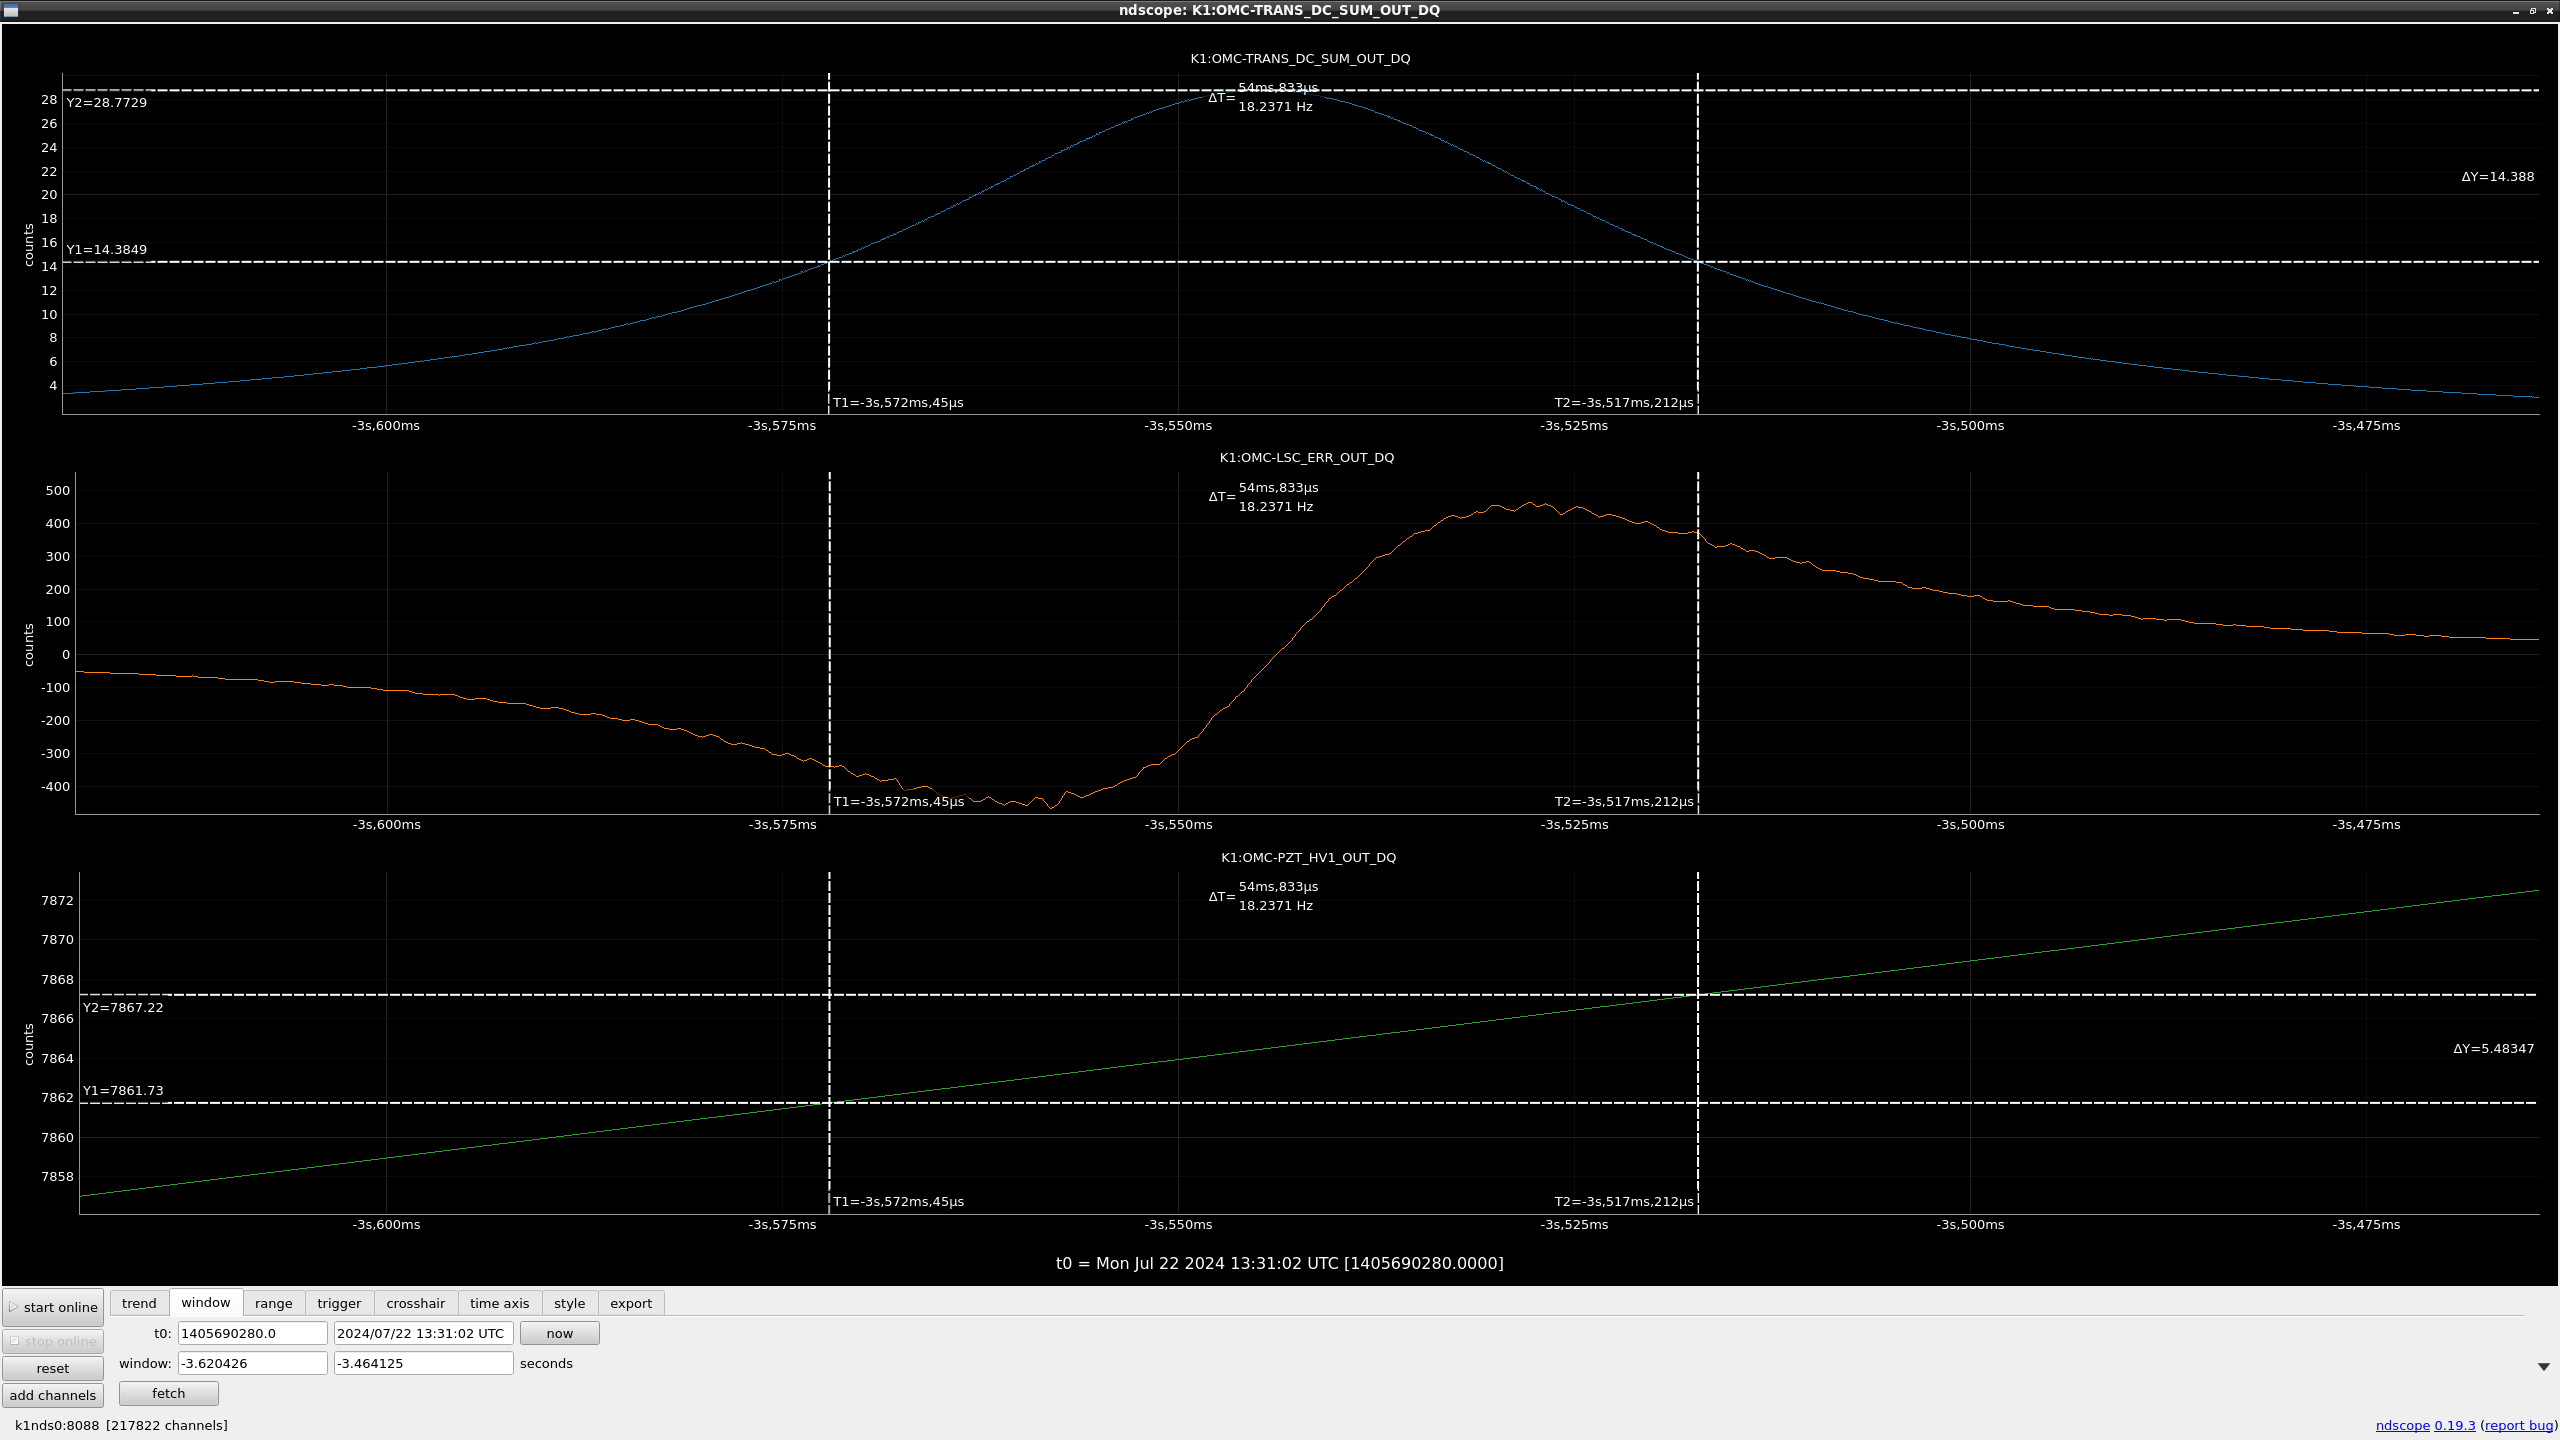
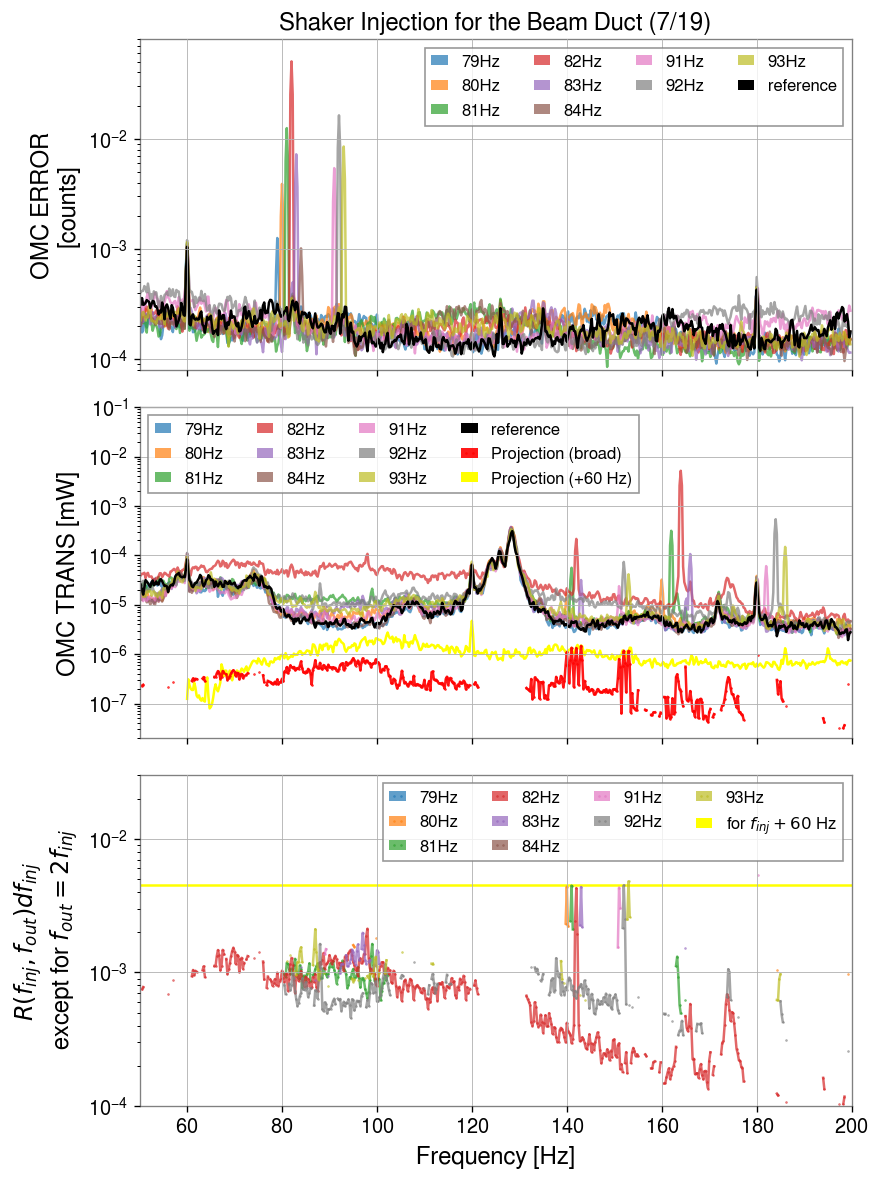
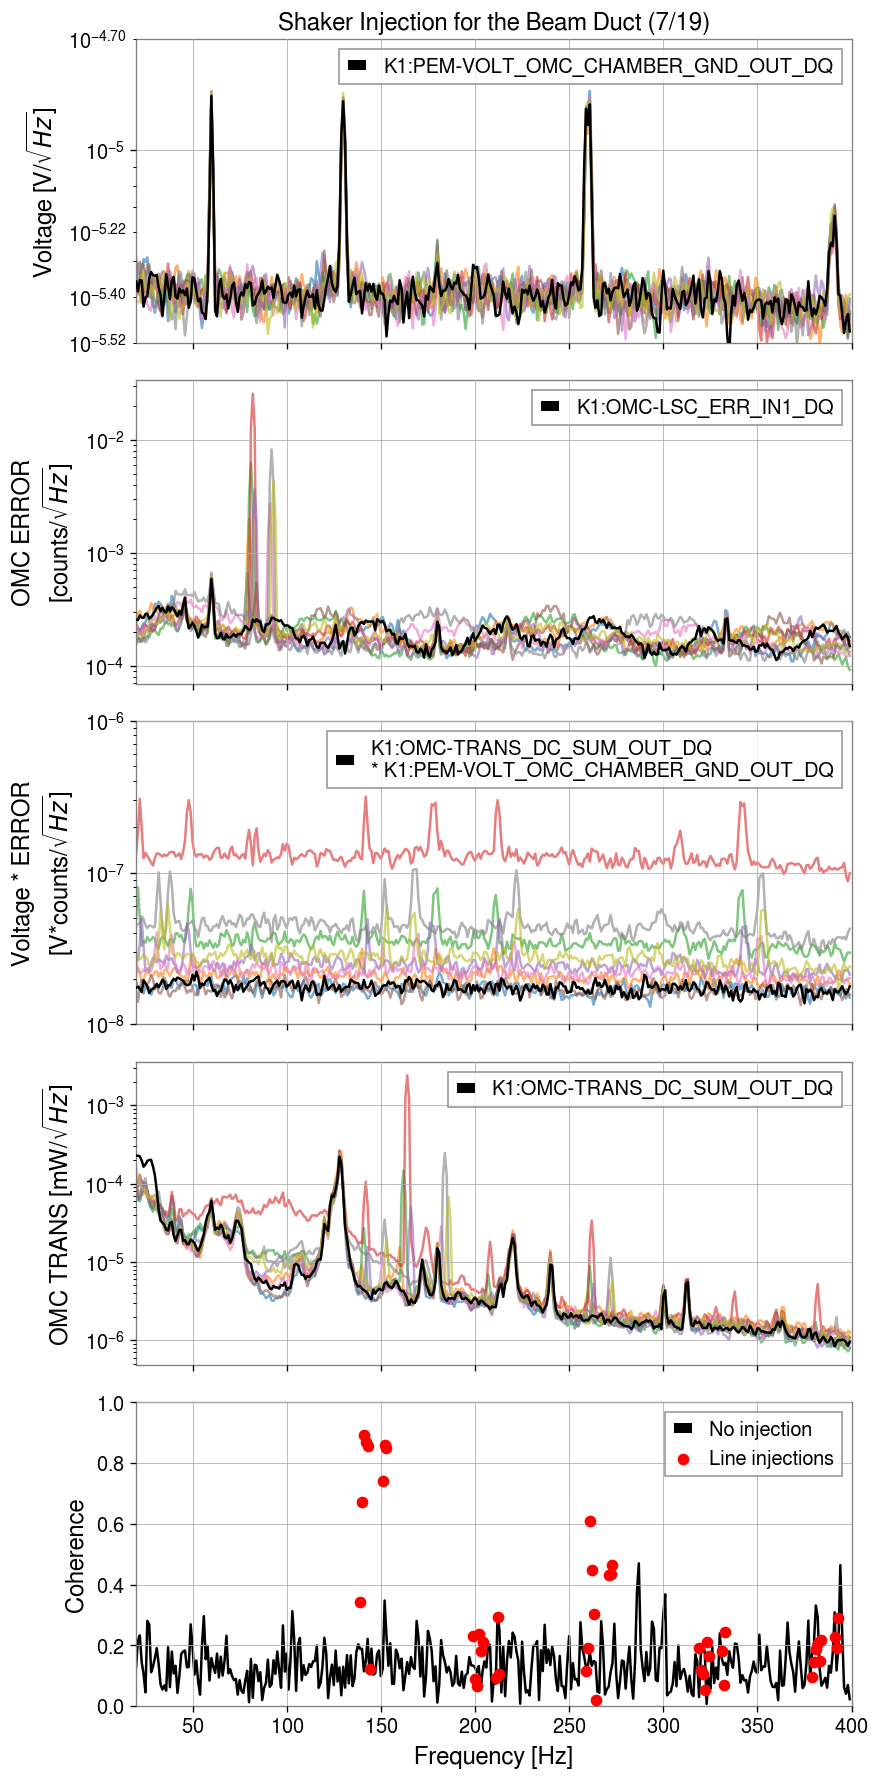
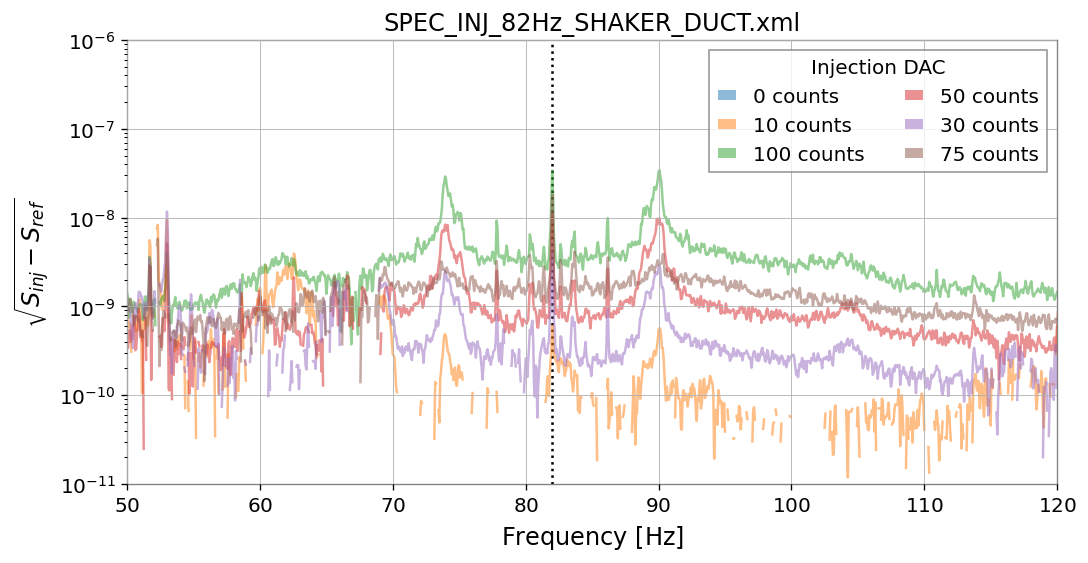
I compared the spectra of OMC trans (top left), calibrated OMC length (top right), OMC QPD (bottom left), and calibrated geophone (bottom right) with and without the tapping around the most sensitive area, as described in klog:30469.

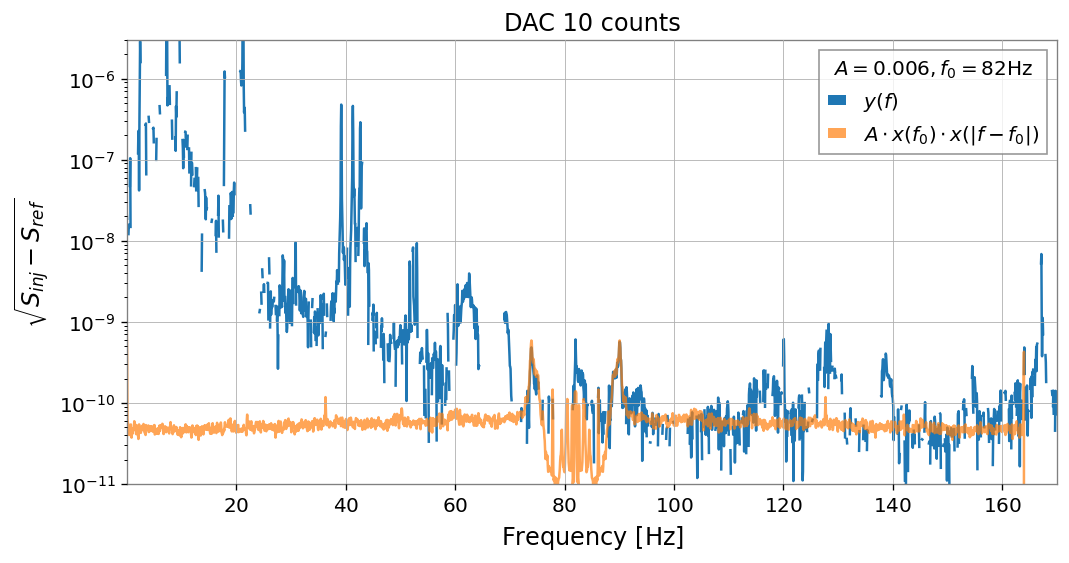
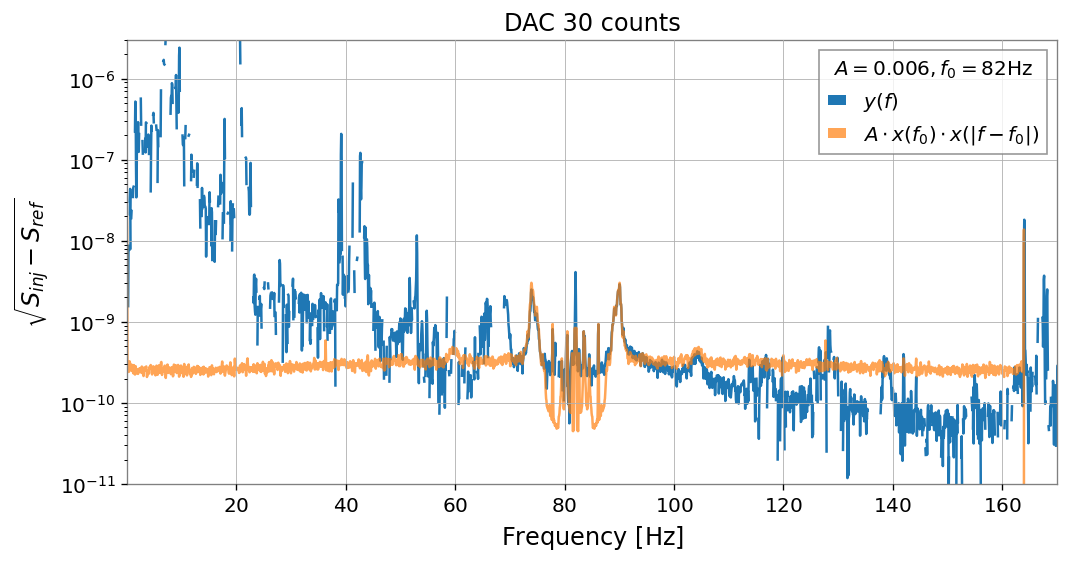
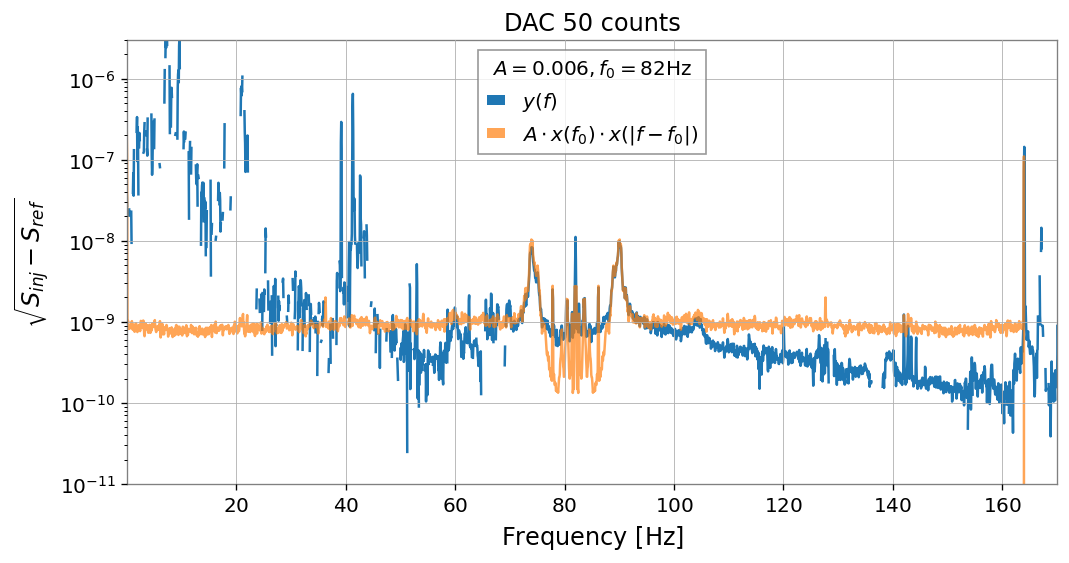
The OMC length is calibrated by the factor estimated in klog:30497.
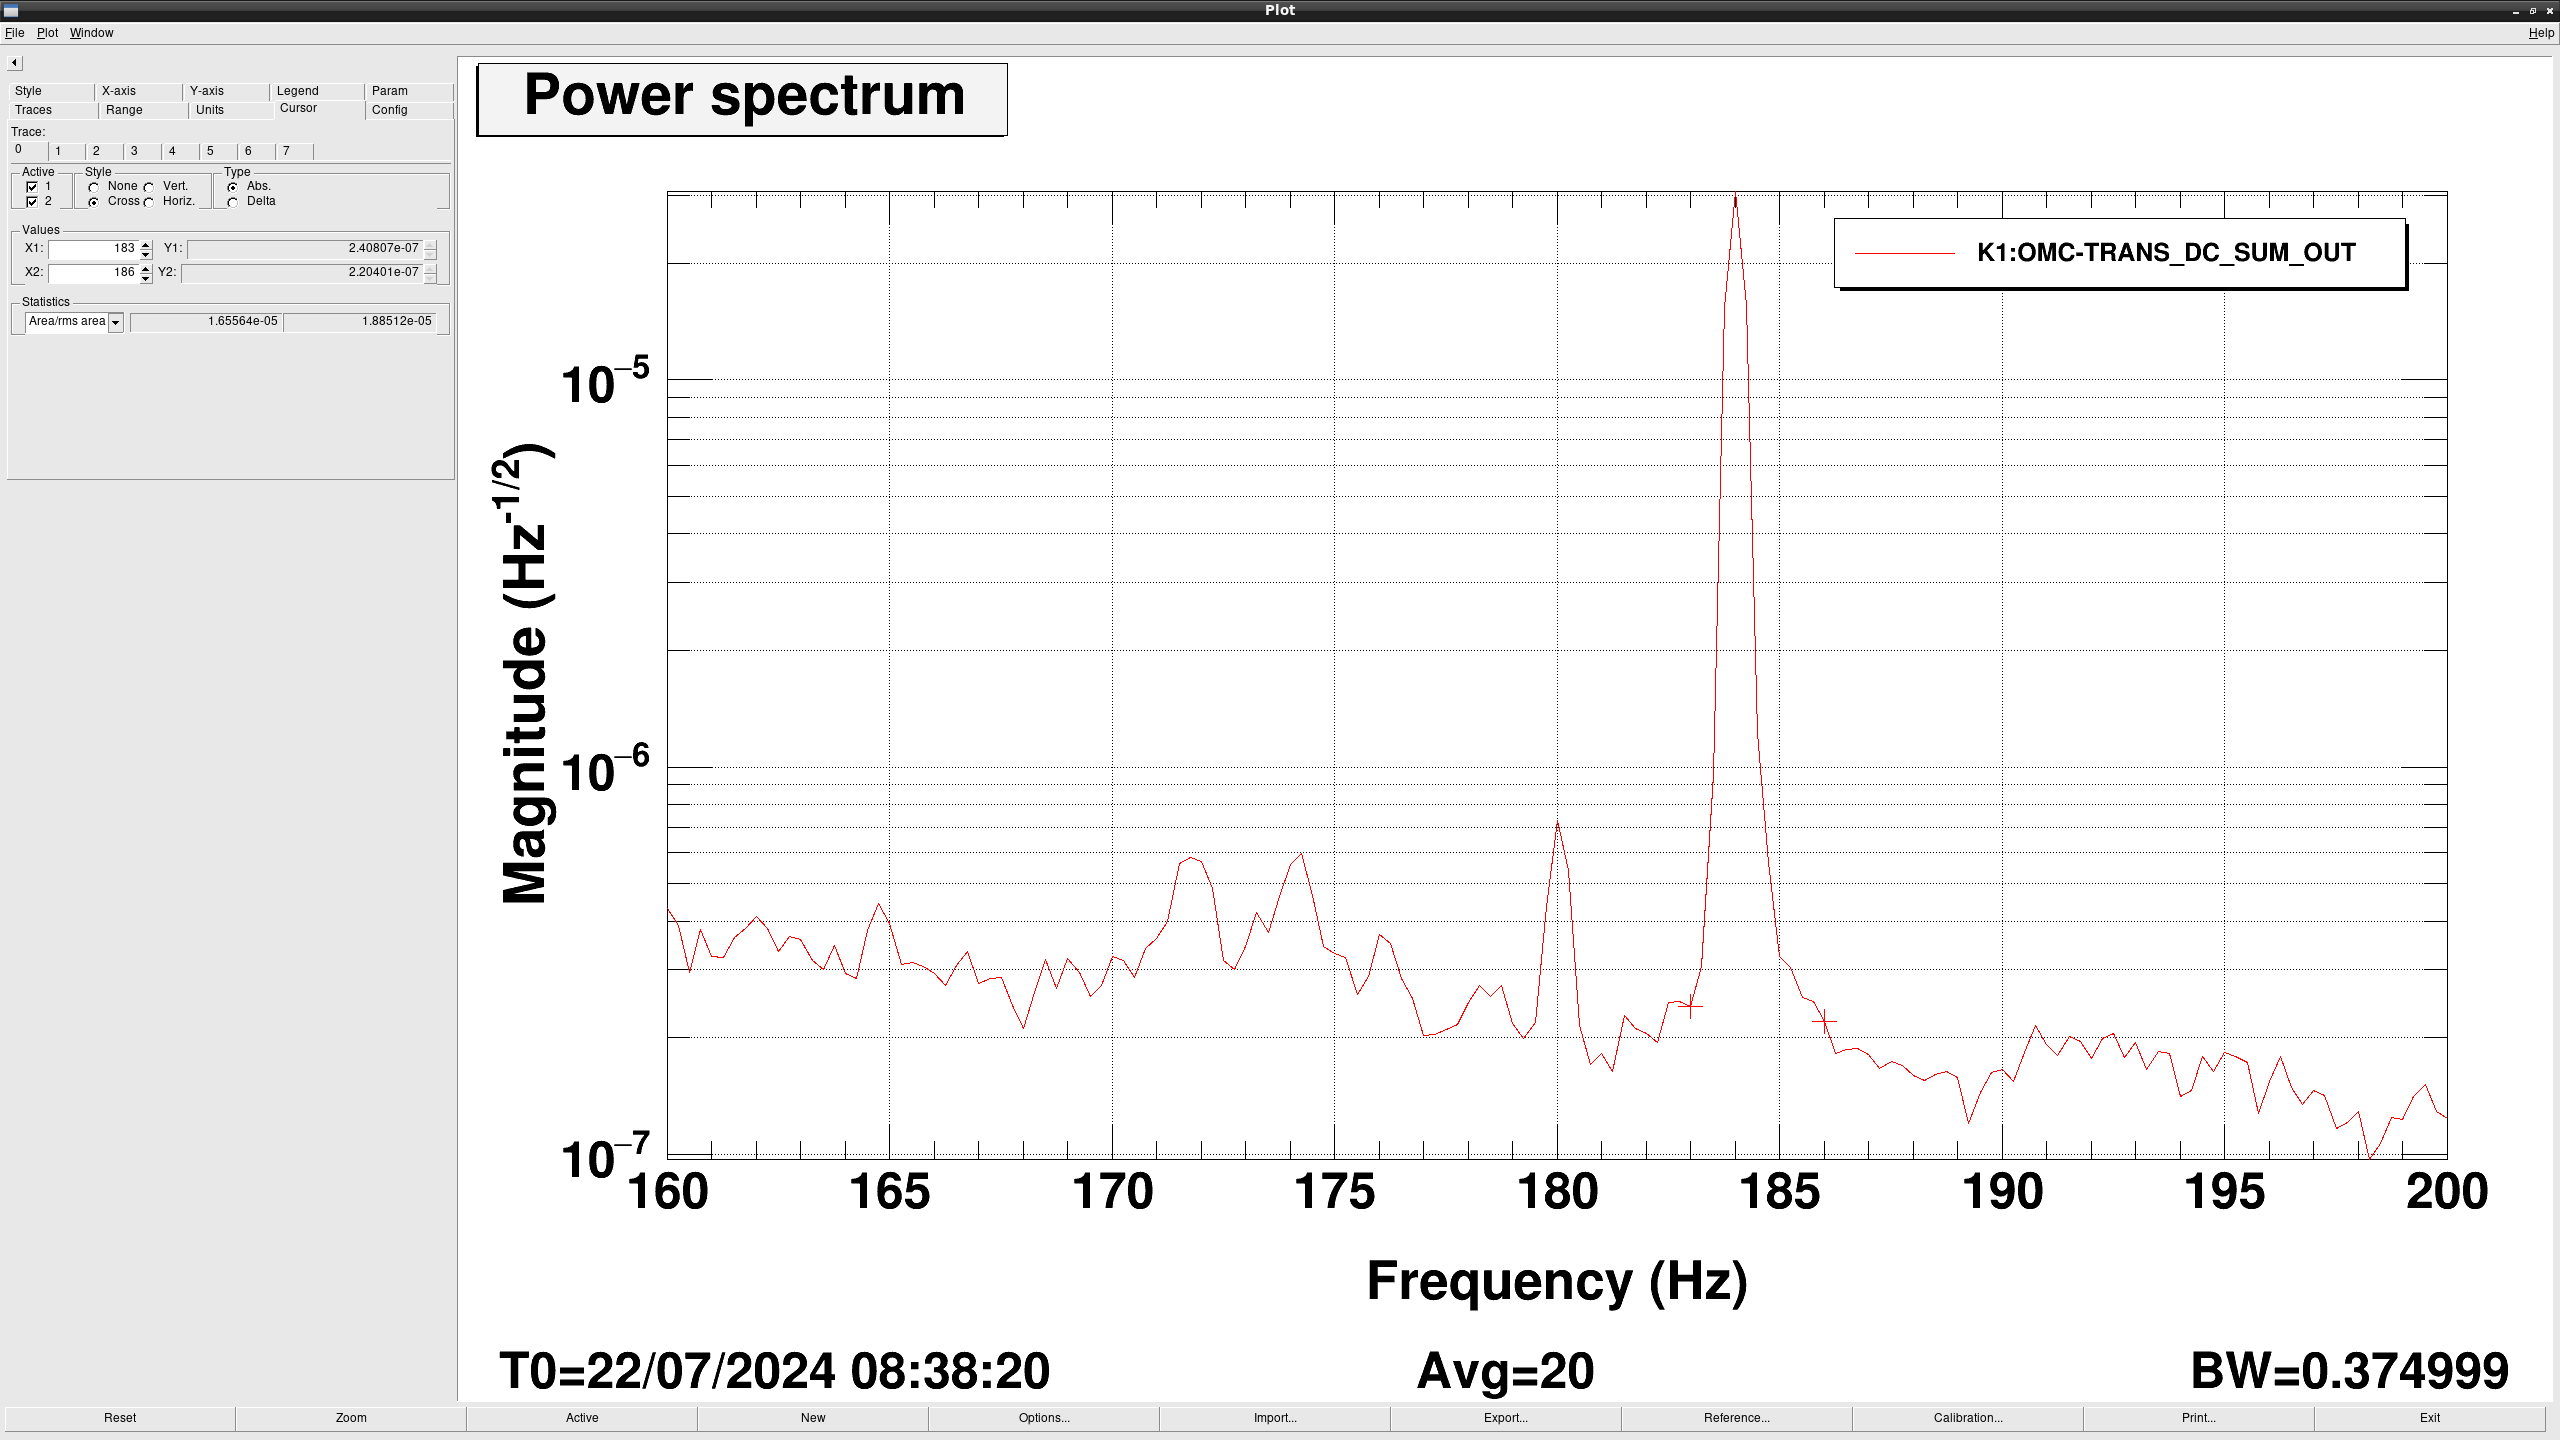
Forcusing on the 90 Hz peak, the OMC length reaches ~1e-11 m/√Hz during the tapping, which is caused by the table displacement of ~1e-9 m/√Hz.
This OMC length causes a relative intensity noise of ~1e-5 /√Hz in OMC trans.

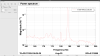
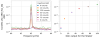
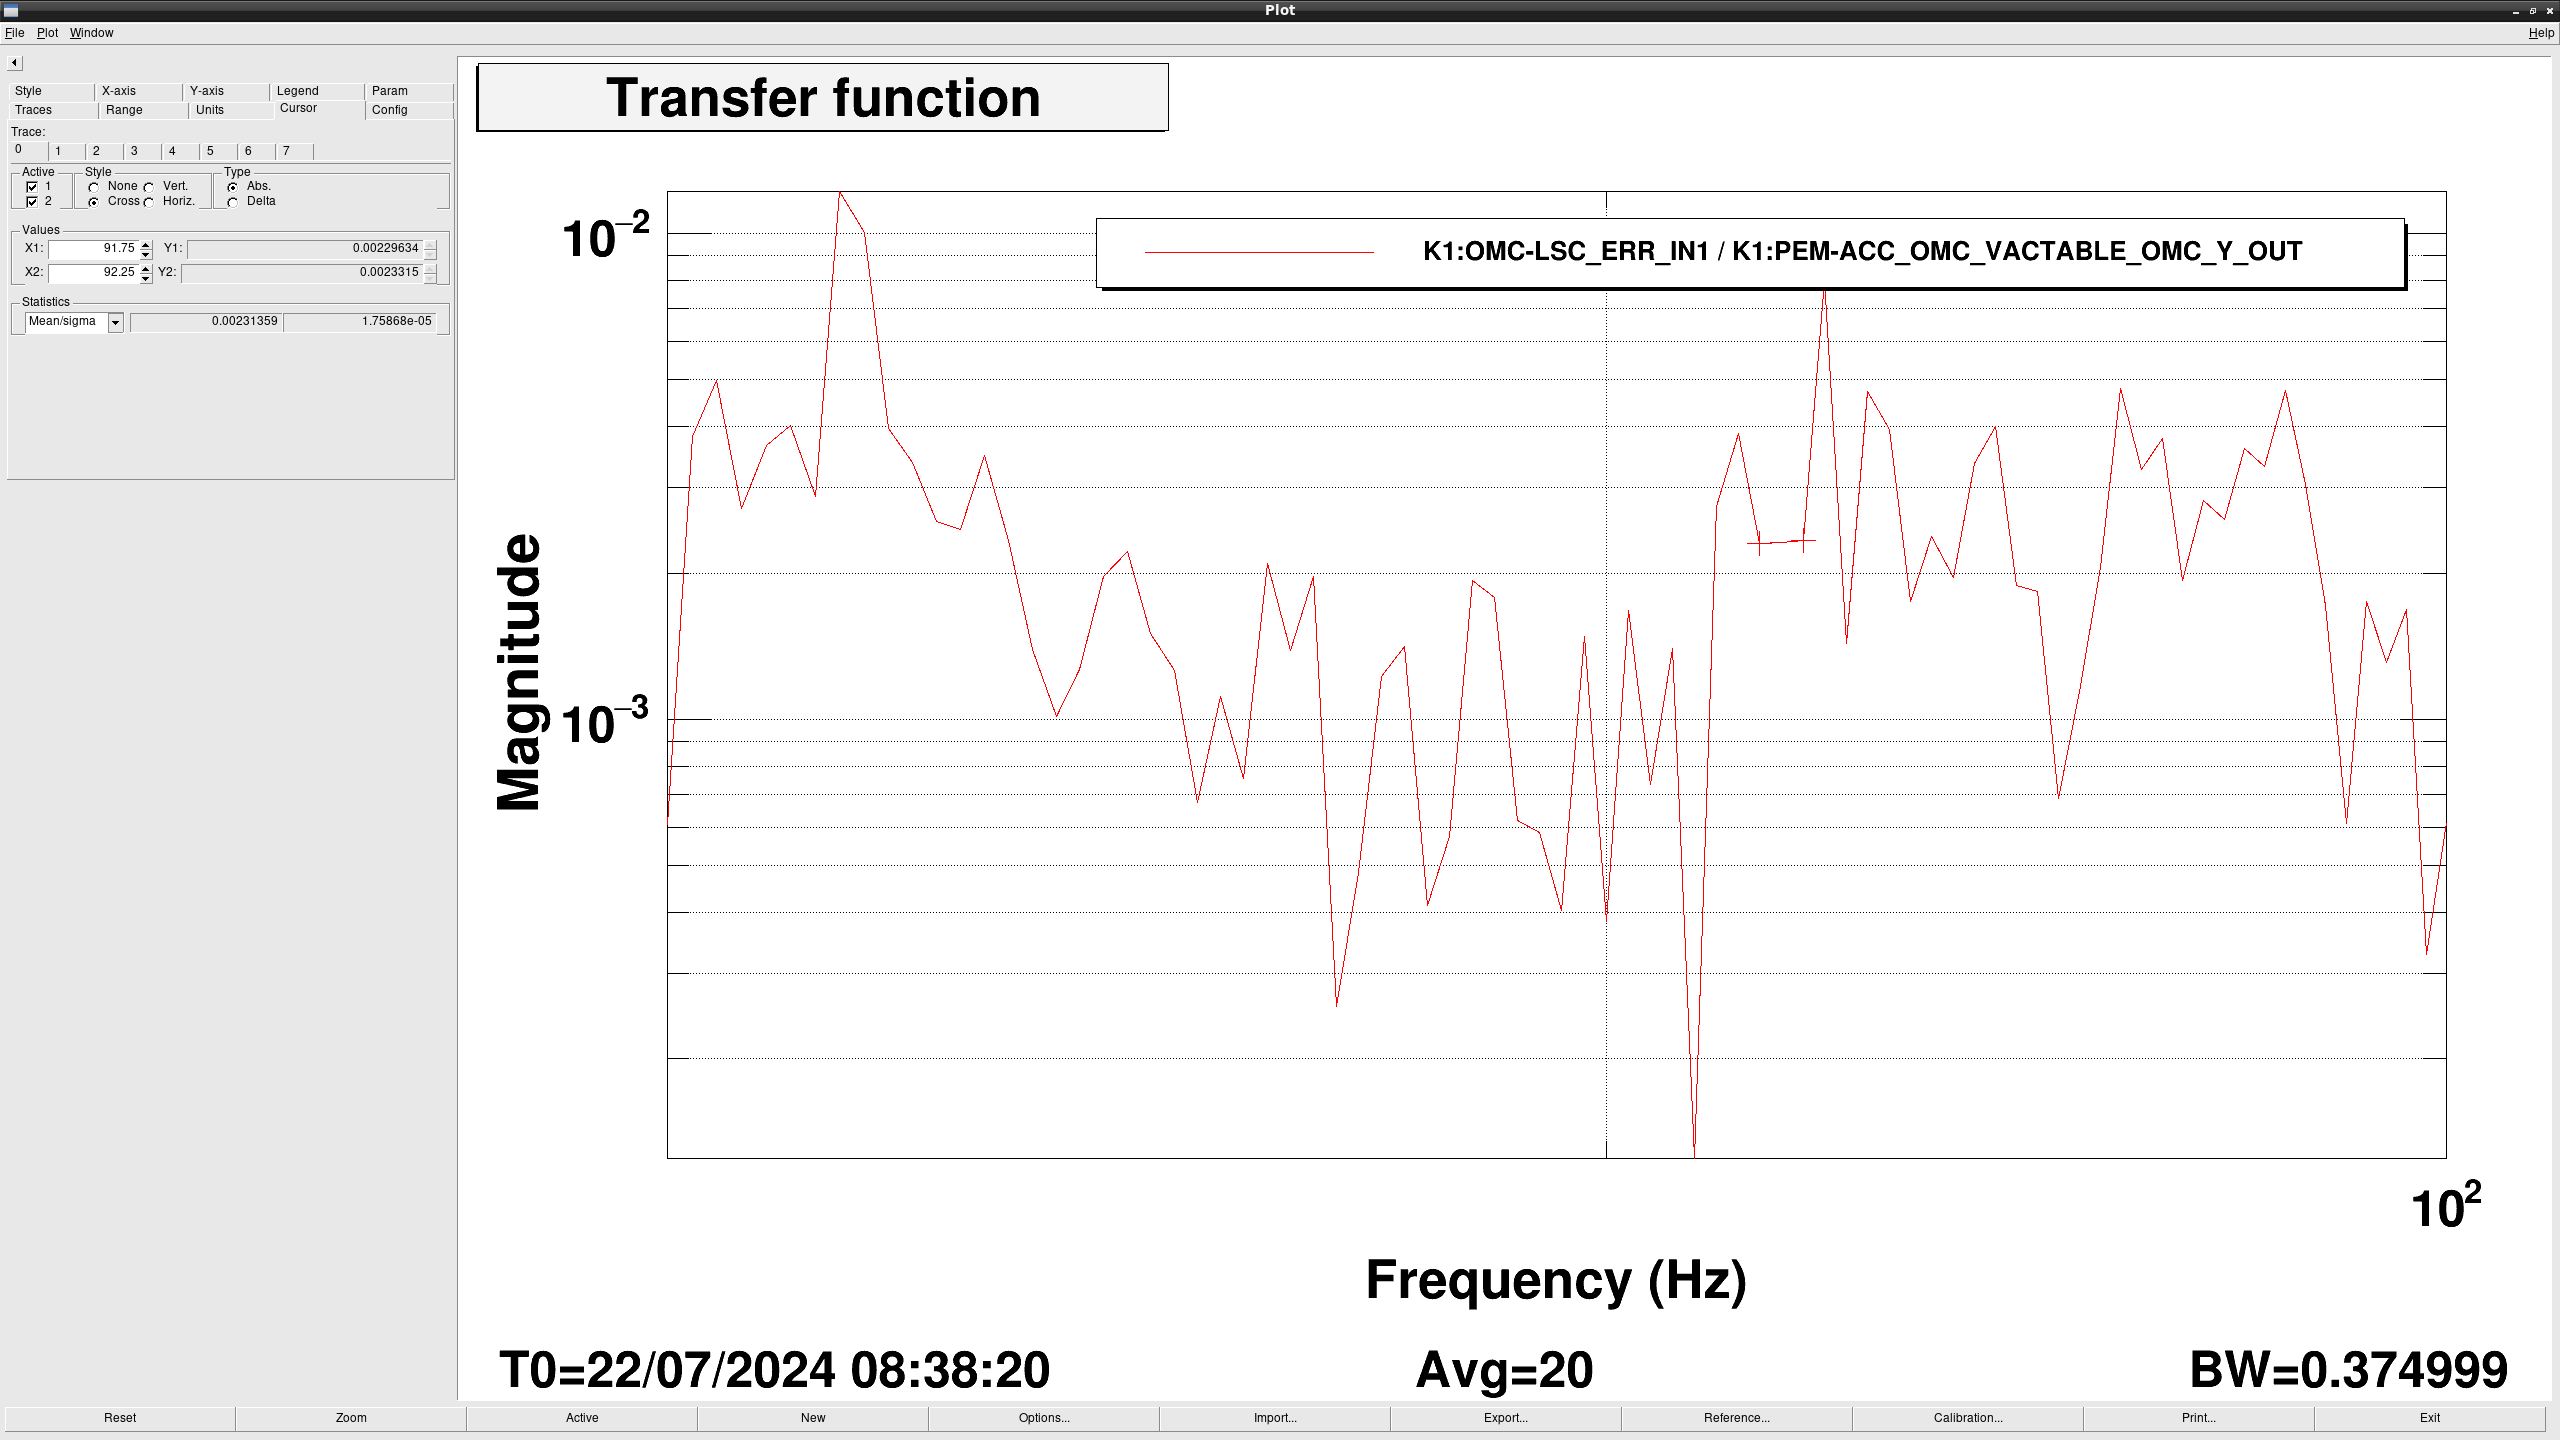
The Q-value of the 90 Hz resonance seems to be around 100, so the transfer function from the optics table to OMC length can be roughly estimated to be ~1e-4.
This value is reasonable, because the vertical seismic isolation factor around 100 Hz is approximately 100, and the common mode rejection of the semi-monolithic OMC can be around 100 due to the low first elastic mode of the OMC breadboard at ~1 kHz.

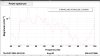
Without the tapping, the displacement of the optics table is ~1e-10 m/√Hz around 100 Hz, leading to ~1e-13 m/√Hz in OMC length noise at the peak and causing the OMC trans RIN of ~1e-7.
Therefore, we cannot reach the shot noise level of OMC trans ~1e-8 /√Hz.

To reduce the acoustic noise and reach the shot noise level around 100 Hz, we should consider some strategies.
Potential strategies are as follows:

  • Improving the vibration isolation of the stack (recovering the stack performance in TAMA era)
  • Improving the common mode rejection of the semi-monolithic OMC
  • Removing the vibration source around 100 Hz
  • Strong control and reduction of OMC length by high-UGF OMC LSC above 100 Hz
  • Lowering the OMC finesse
Images attached to this report
Comments to this report:
takafumi.ushiba - 13:59 Friday 26 July 2024 (30580) Print this report

I crosschecked the OMC length noise from the measurement done on July 22.
Figure 1 shows the diaggui file, which I used for the calculation.

According to the OMC SUM during the measurement (fig2), OMC transmission power was about 29 mW, so I calibrated K1:OMC-TRANS_DC_SUM_OUT_DQ to RIN by dvided with 29.
According to klog30535 and klog50539, the calibration factors estimated from two different method were 5.1e9 and 6.4e9 cnt/m, respectively.
So, I used the averaged value, 5.75e9 cnt/m, for the calibration of error signals to displacement.
I also calibrated geophone signals and seismometner signals to displacement by devided with 2*pi*f (I could not confirm current calibration is um/s for both geophone and seismometer at OMC, so it might be wrong. If so, please let me know).

Around 92 Hz (injection frequency), RMS of OMC error signals were 2.2e-12 m.
According to the PZT actuator efficiency, 1.3e-10 m/cnt (klog30490), and cavity scan of OMC (fig3), FWHM in the unit of meter is 1.3e-10*5.5 = 7.2e-10 m.
So, RIN of OMC transmission generated by the displacement around 92 Hz can be estimated as 2*(2.2e-12/7.2e-10)**2~2e-5.
According to the direct measurment of RIN of OMC transmission, RMS of RIN around 184 Hz, which is double of the injection frequency, is about 1.9e-5 (fig5), which is almost consistent with the value estimated above.
So, the above estimation method from OMC error signals to RIN of OMC transmission seems to work well.

The transfer function from geophone to OMC error signals at 92 Hz is 0.0023, according to the measurement (fig6).
Now, let's say OMC vibration around 92 Hz without excitations is 1e-11 m/rtHz according to the measurement (fig7).
OMC length displacement can be estimated as 1e-11*0.0023=2.3e-14 m/rtHz
So, RIN of OMC transmission will be 2*(2.3e-14/7.2e-10)**2~2e-9, which is lower than shot noise limit of 15mW OMC transmission, 5e-9.

According to the TF measurement from geophone to OMC error signals (klog30521), the gain from geophone to OMC error signals at 92 Hz is larger than that at the other frequency, except for 82 Hz: this means RIN of OMC transmission would be lower than 2e-9 at the other frequencies.
So, it might be difficult to explain the OMC noise floor above 100 Hz only by optical table vibration on the OMC stack.

Images attached to this comment
satoru.takano - 15:48 Friday 26 July 2024 (30588) Print this report

Supplemental material

Response from the displacement (x) of the cavity to the relative intensity (RIN):

RIN(x) = \frac{1}{1 + \left(\frac{x}{HWHM}\right)^2} \simeq 1 -\left(\frac{x}{HWHM}\right)^2

Fluctuation in a certain frequency:

RIN(A\cos\omega t) \simeq 1 -\left(\frac{A\cos\omega t}{HWHM}\right)^2 = 1 - \frac{1}{2}\left(\frac{A}{HWHM} \right)^2 - \frac{1}{2}\left(\frac{A}{HWHM} \right)^2 \cos2\omega t

Amplitude of response at the second harmonics of the original frequency:

RIN \,at \,2\omega = - \frac{1}{2}\left(\frac{A}{HWHM} \right)^2 = -2\left(\frac{A}{FWHM} \right)^2

tatsuki.washimi - 16:50 Monday 29 July 2024 (30613) Print this report

I estimated the frequency-converted noise of the OMC Error -> Trans.
This calculation assumes that this noise amplitude is linear and the response function model is aberable, except for the harmonics.

I used the data of the single-line shaker injections (79, 80, 81, 82, 83, 84, 91, 92, 93 Hz) for the beam duct, performed on July 19. (klog30473)

Fig.1 (top) is the amplitude spectral densities of the OMC Error signals for each injection (colored) and the reference (back).
Fig.1 (middle) is the amplitude spectral densities of the OMC Trans DCPD for each injection (colored), the reference (back), and the projection of the Error->Trans (red). 
Fig.1 (bottom) is the response functions for each injected frequency.

The projected noise spectrum is 1-2 orders smaller than the reference data of the Trans DCPD.


By the way, the response function value corresponding to +60Hz looks to be about 4.5e-3 mW/count, for all injections commonly. 
In Fig.2, I added its projection by assuming this factor is common not only for the injected but also for all frequencies of the OMC Error signal (yellow)
This result is larger than the projection of the broad-band frequency-converted noise.
So the first work of noise hunting may be the 60Hz electrical coupling reduction.

Images attached to this comment
tatsuki.washimi - 10:43 Wednesday 31 July 2024 (30635) Print this report

I checked the coherence between the OMC_Trans and (OMC Error * Electrical noise), for the single-line shaker injections data (on 7/19, Beam duct) and the Non-injection data.

In the attached figure, from the upper, 

  1. ASDs of the OMC chamber voltage, measured by the OMC rack
  2. ASDs of the OMC Error signal
  3. ASDs of the time series of (OMC Error * Electrical noise)
  4. ASDs of the OMC Trans DCPD signal
  5. Coherence between the OMC_Trans and (OMC Error * Electrical noise)
    • black : that for the Non-injection data
    • red :  that for the shaker injection data, at f_inj + 60n Hz (n=1,2,3,4,5)

 There was no coherence in the Non-injection data and found some significant coherence at  f_inj + 60Hz and  f_inj + 180Hz.

Images attached to this comment
dan.chen - 16:52 Wednesday 16 October 2024 (31347) Print this report

[Ushiba, Komori, Sugimoto, Sugioka, Tanaka, Yokozawa, Dan]

Summary

  • As reported by Washimi-san on klog30613, when we injected 82Hz at OMC, DARM noise around 100Hz became noisy broadly.
  • This may be the coupling with the 82Hz injection and noise around 9Hz, which make a broad noise around 100Hz.
  • As there is a small peak noise at 82Hz, we tried estimating the effect on DARM sensitivity.
  • We injected 82Hz signal in the OMC loop and with the shaker (klog31343) by changing the amplitude to see the generated broad noise around 100Hz and tried estimating the effect on the DARM from the real 82Hz peak.
  • But, as the estimated results were negative values, the measurement error could limite the estimation (or the 82Hz peak is really creating the noise around 100Hz?).

Details

  • Injection at the EXC of the inloop filter (K1OMC-LSC_FB_FLT)
    • The diaggui file: /users/Commissioning/data/OMC/2024/1016/SPEC_INJ_82Hz_OMCPZT.xml: Fig001
    • The injected count: 100, 50, 25, 10, 3, 0
    • We looked at 100.125Hz on the DARM_IN1 and recorded the value with the injection counts.
    • Then we used the data for the fitting.
      • Used function was y=ax+b, where x is the square of the injection count, and y is the square of the DARM noise at 100.125Hz. (We used Excel for this fitting.)
      • This is because the function we though is n = sqrt{a + bp^2}}, where n is the noise at DARM, and p is the injection amplitude.
      • Then, we used the function with the estimated parameters to estimate the effect from the real peak: Fig002
    • The result was negative number.
  • The shaker was installed (klog31343).
  • Injection with the shaker
    • We used the shaker and performed similar measurement as the above.
    • The diaggui file: /users/Commissioning/data/OMC/2024/1016/SPEC_INJ_82Hz_SHAKER_DUCT.xml: Fig003
    • Injection was applied at K1:PEM-EXCITATION_SR3_RACK_4_EXC, which is reported on klog31343
    • The injected count: 100, 75, 50, 30, 10, 0
    • Because the relationship between the injection counts and the DARM noise was not so good, we used the 82Hz peak value at OMS-LSC_ERR as the injection amplitude.
    • Then we used the same function to fit the data and estimated the effect from the real peak: Fig004
    • The result was also negative number.
  • From these results, we think the measurement error could limite the estimation (or the 82Hz peak is really creating the noise around 100Hz?).
Images attached to this comment
Search Help
×

Warning

×