Reports 1-1 of 1 Clear search Modify search
CAL (General)
takahiro.yamamoto - 13:01 Thursday 27 April 2023 (24969) Print this report
Full measurements of IFO calibration

[Dan, Sawada, YamaT]

Abstract

We did full measurements of IFO calibration.
Thanks to the recent ASC works, IFO was very stable.
So our measurements was going well.
Data analysis haven't been finished yet.
 

Details

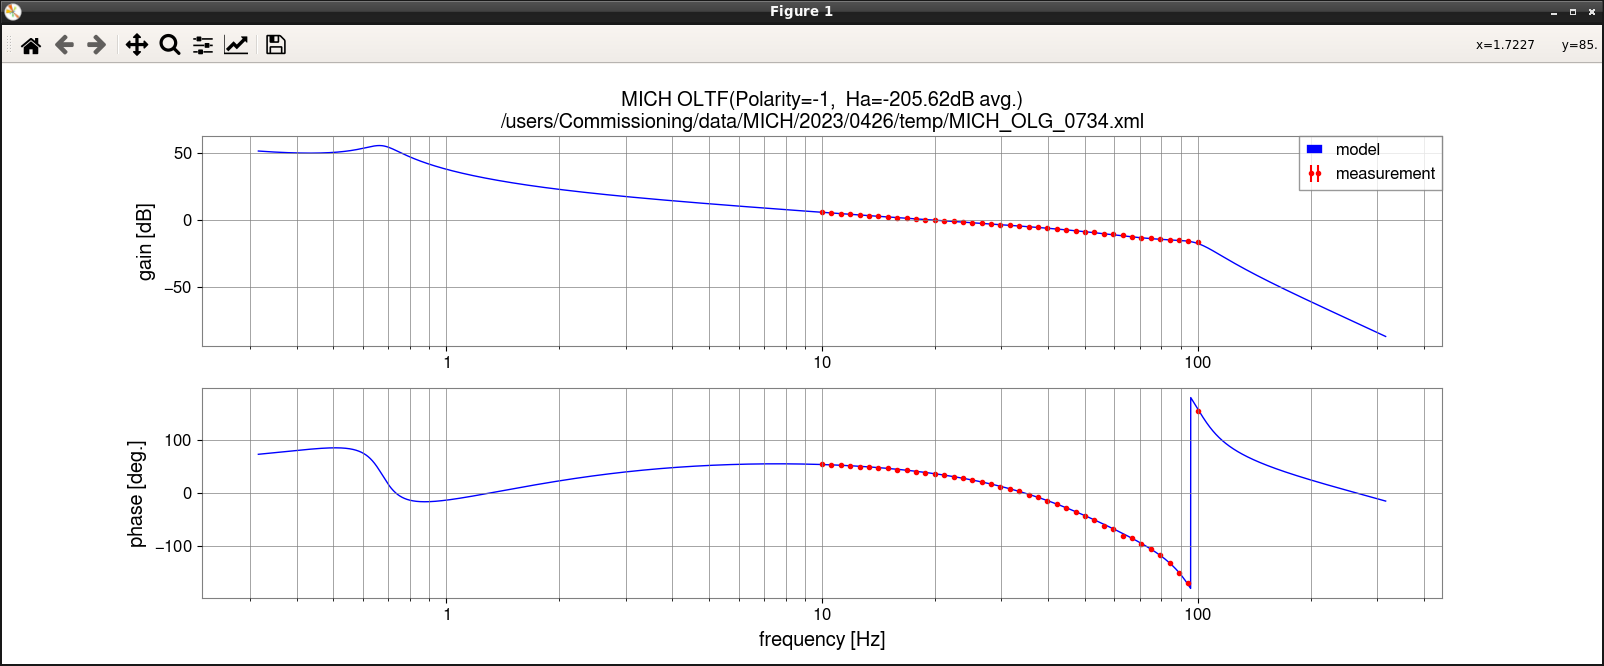
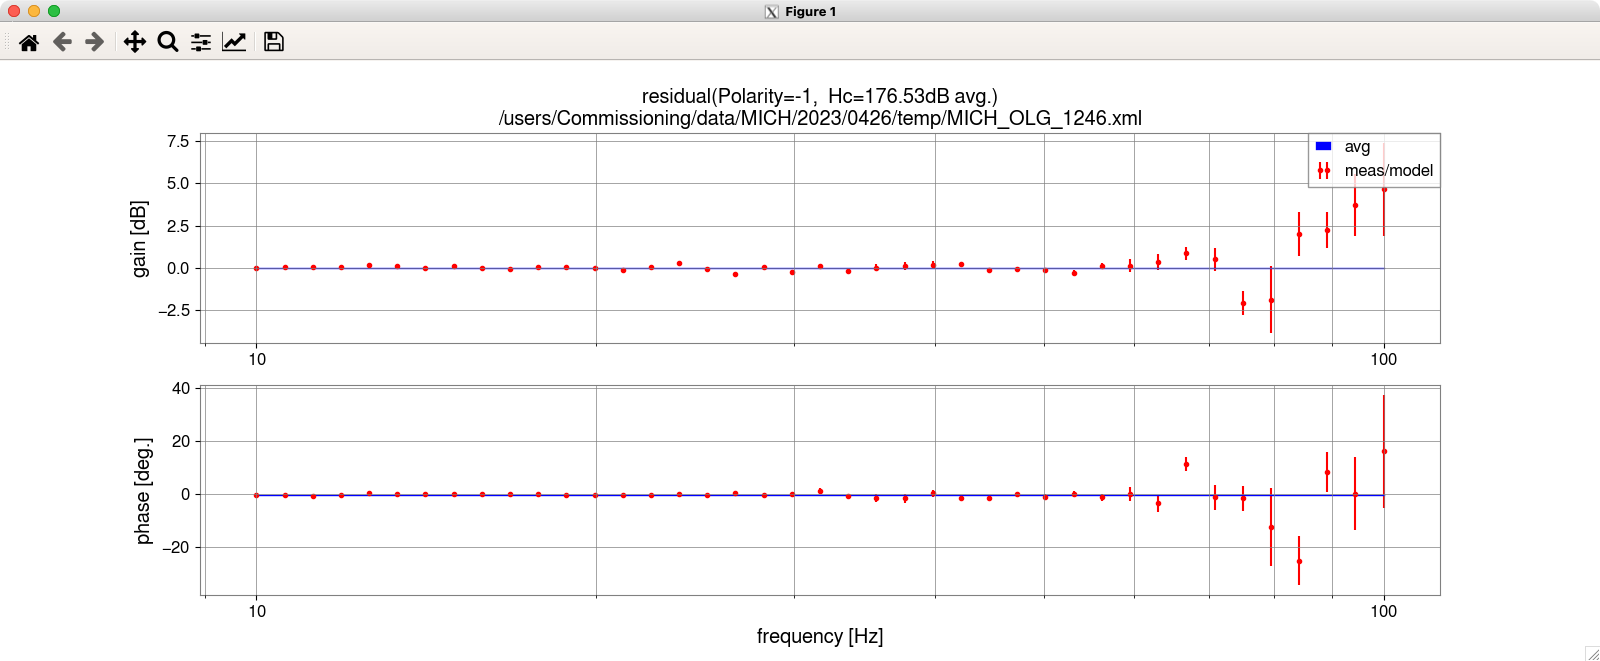
MICH optical gain by Free swinging
We took a 10minute-long fringe data before (7:22 JST-) and after (8:33 JST-) the measurement of MICH OLTF.
Optical gain of MICH was estimated by using POP17Q and POPDC1.
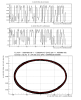
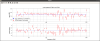
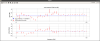
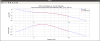
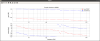
Fig.1 shows one of estimated optical gain from 64second-long data.
(All results are saved in /users/Commissioning/data/MICH/FSM/2023/0426/)

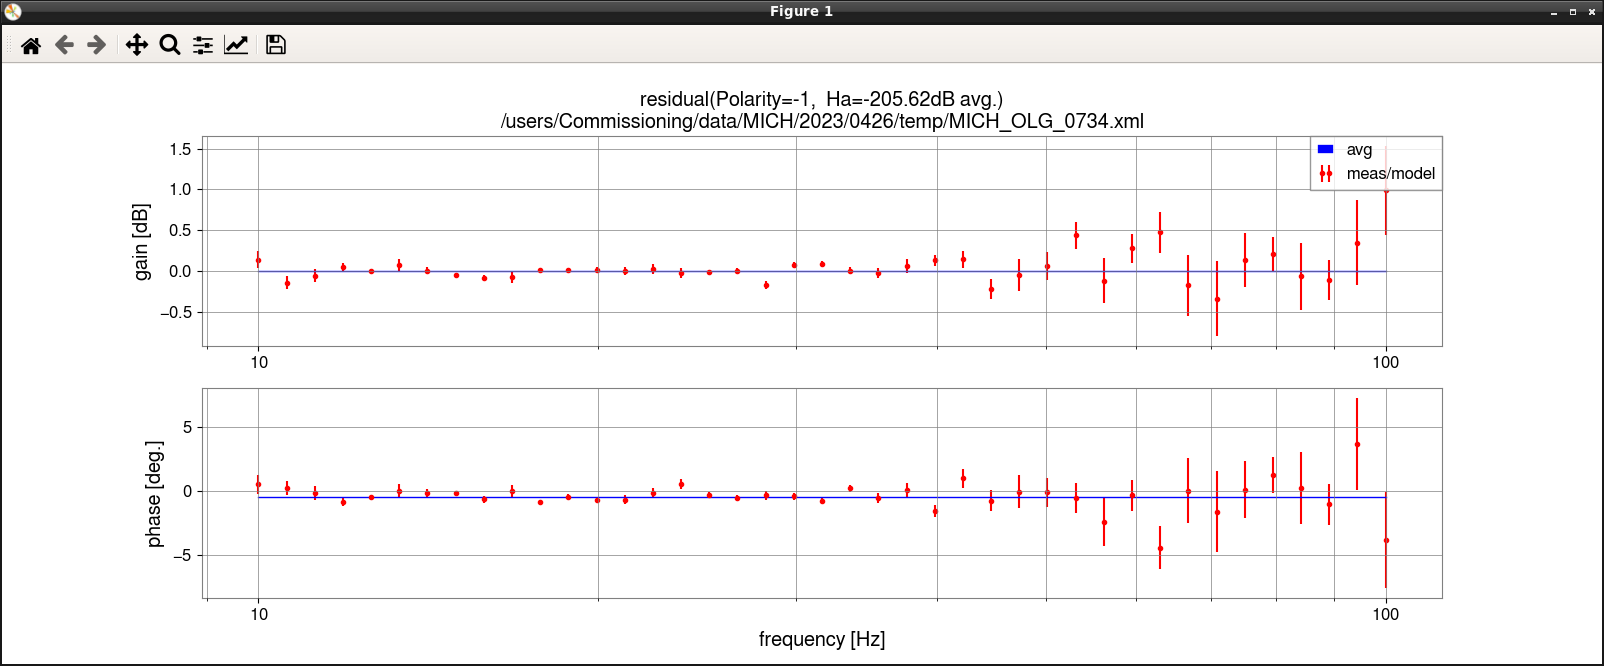
Estimated optical gain is very stable in time.
Statistical fluctuation in time is ~ 0.2%
Hc_mich = (1.0893 +/- 0.0022) * 10^9 [m/ct]
Systematic error haven't been evaluated yet.


Actuator efficiency ratio of ITMX TM and BS TM with MICH
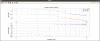
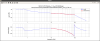
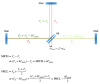
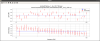
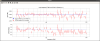
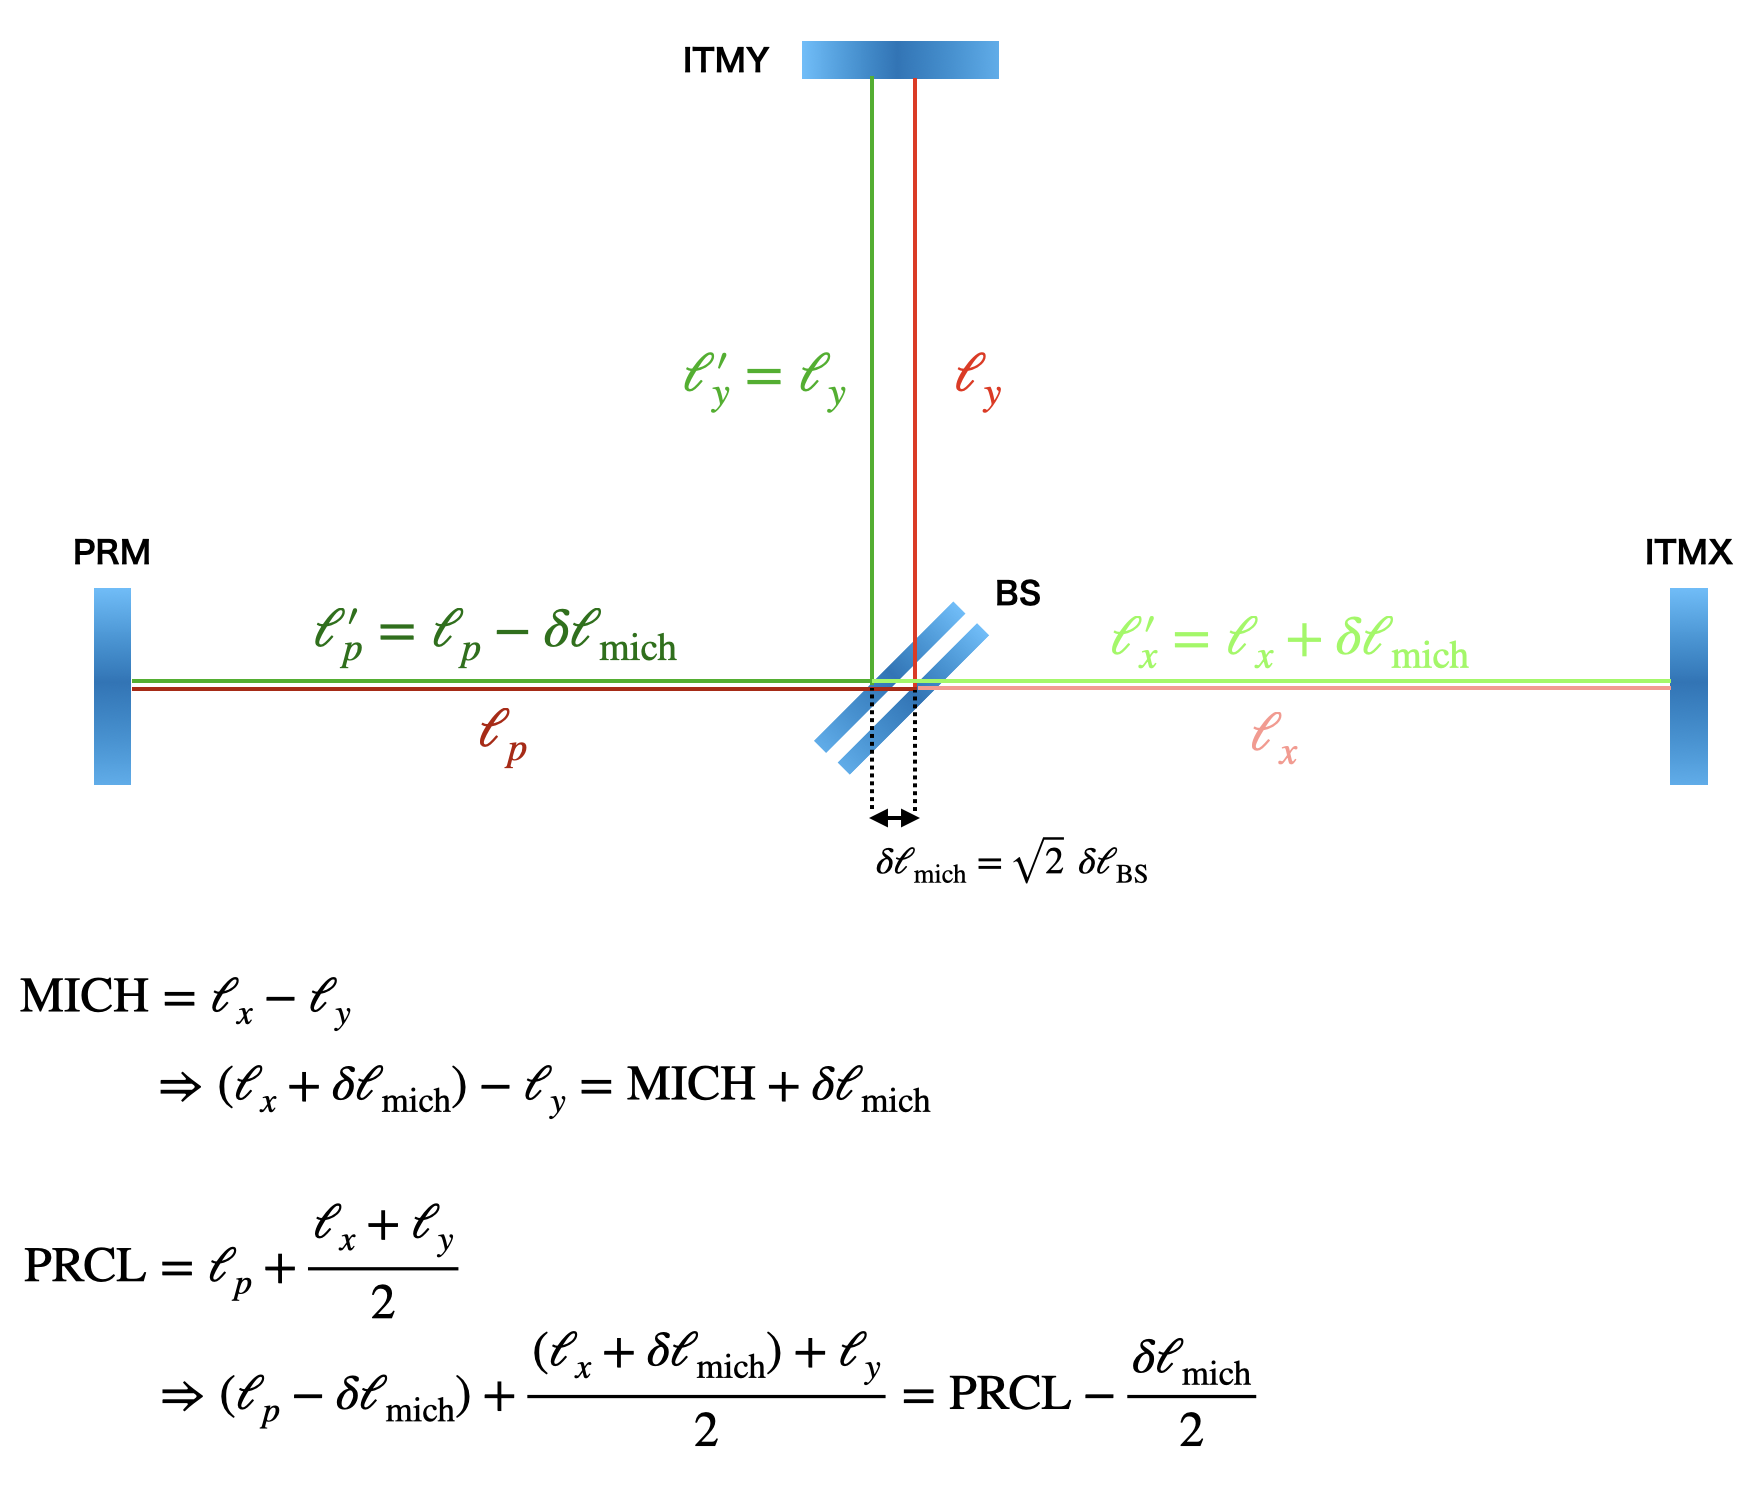
In order to decide the actuator efficiency of ITMX TM, transfer function from BS TM and ITMX TM to MICH error signal were measured.
These results are shown in Fig.2.
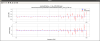
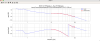
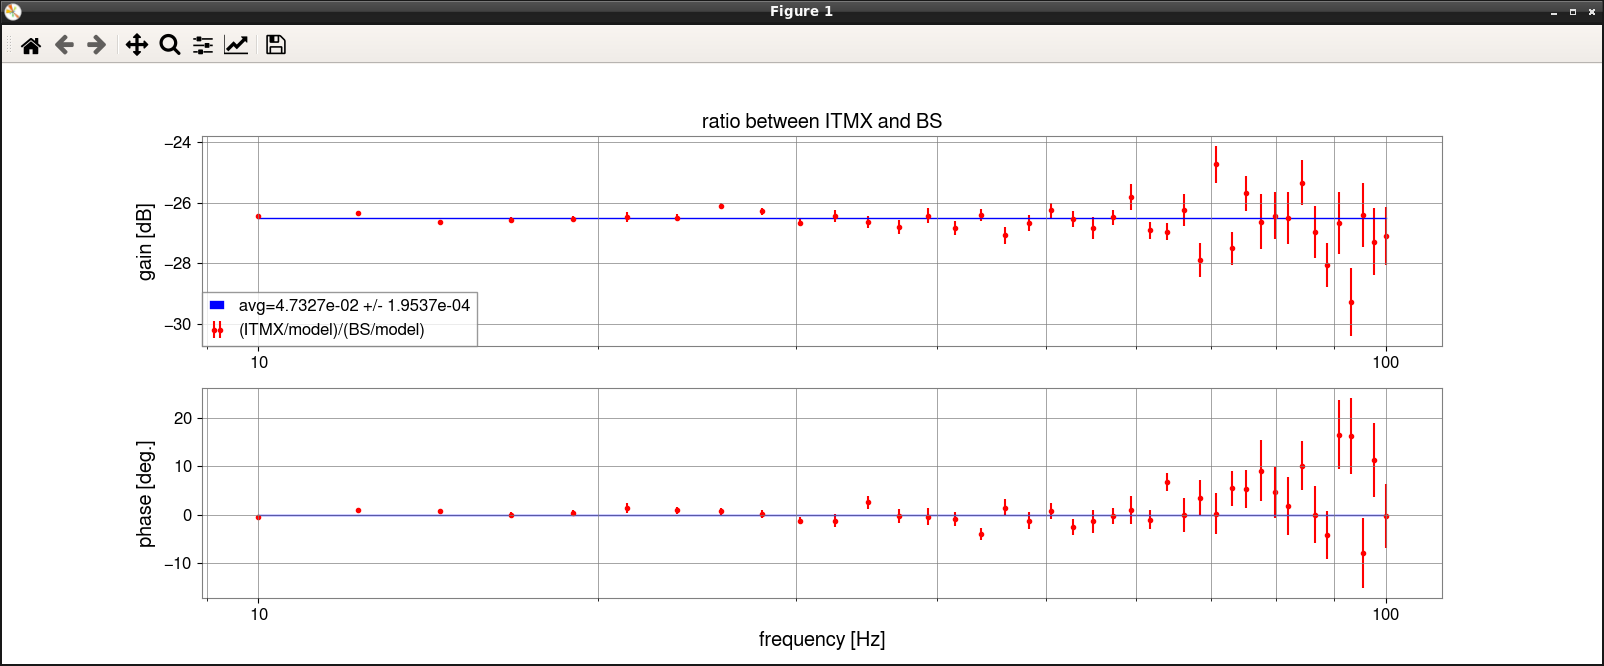
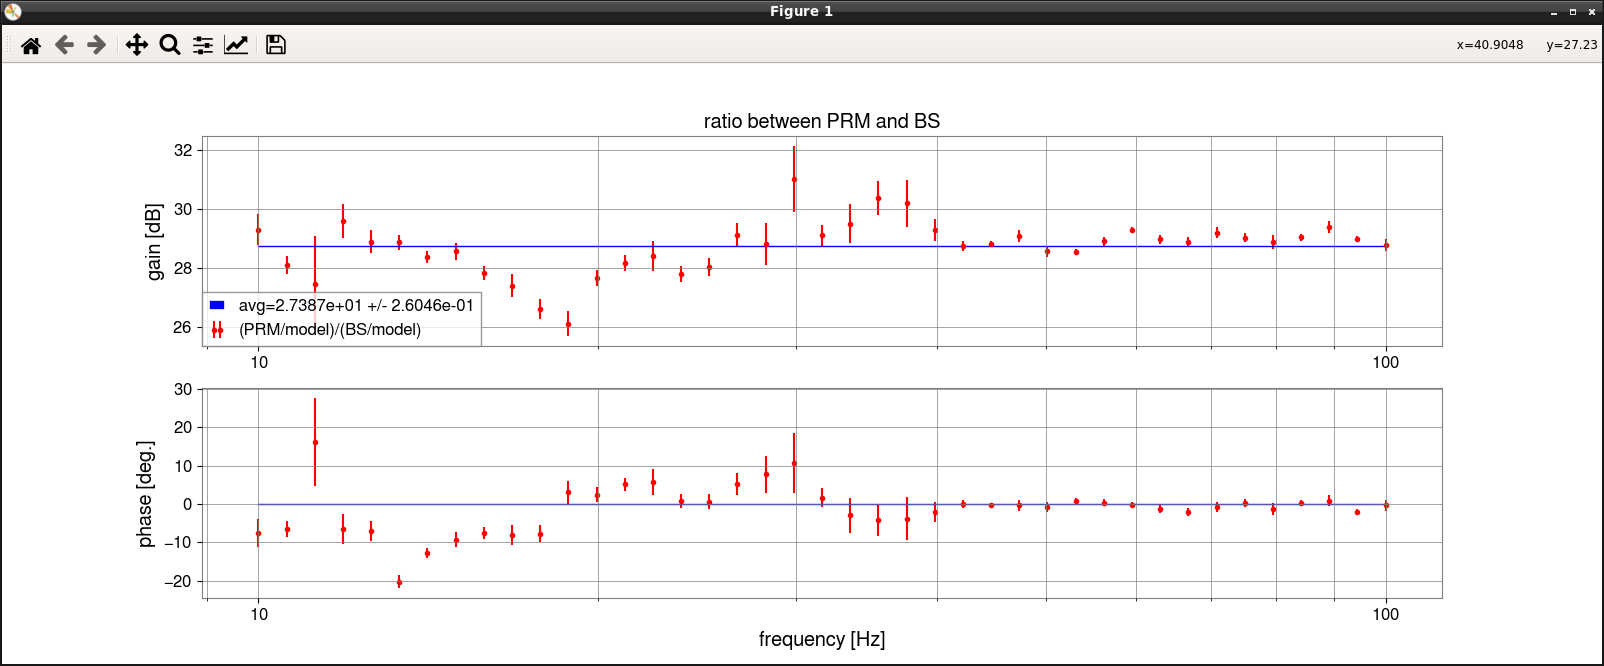
Actuator efficiency ratio was estimated by the ratio of these two transfer functions and estimated value is ITMX/BS = 0.04732 as shown in Fig.3
Note that corner frequency around 30Hz in measured transfer function is unknown effect in MICH length loop model.
It may come from coupling from other DoF. So it should be checked more carefully.

Actuator efficiency ratio of ETMX TM and ITMX TM with DARM
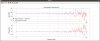
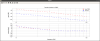
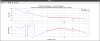
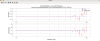
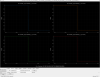
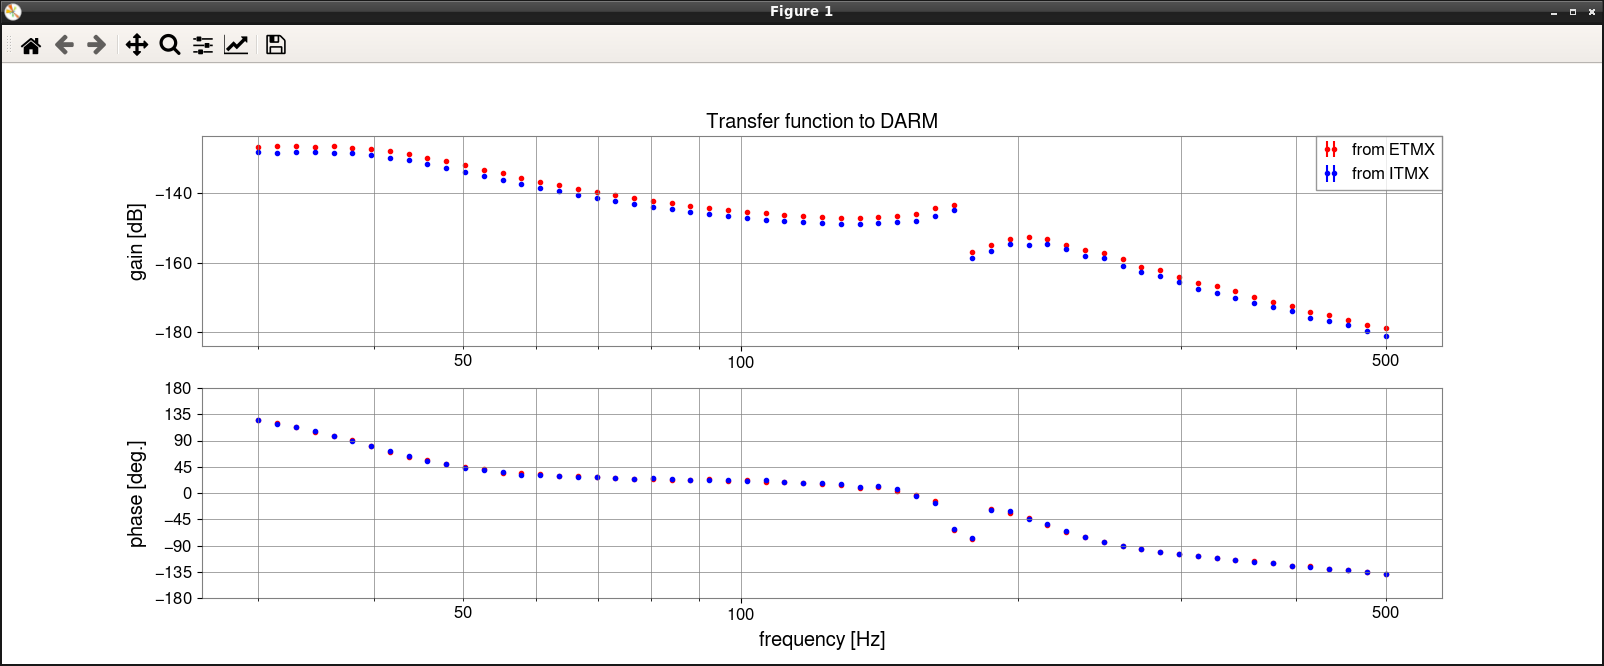
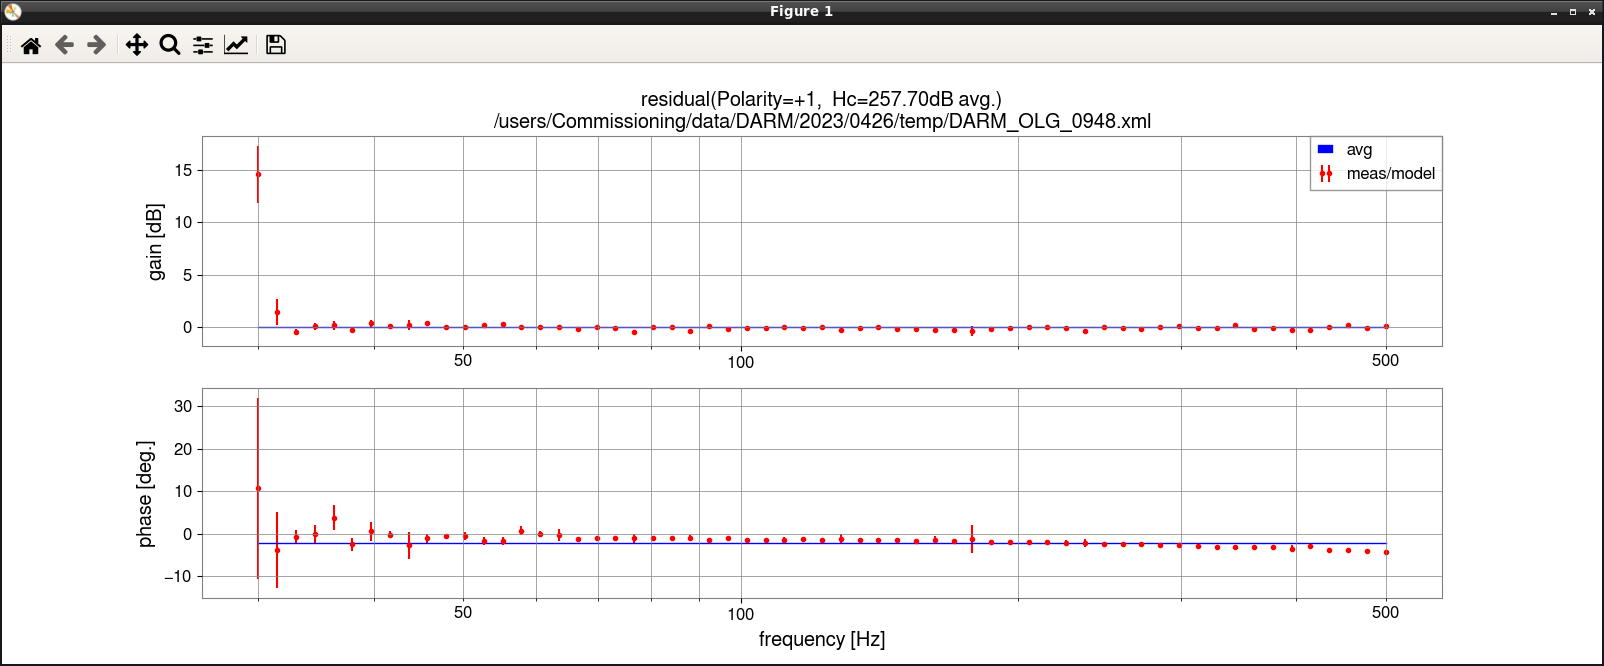
Actuator efficiency ratio of ETMX and ITMX is also estimated by measuring transfer functions from each suspension to DARM error signal.
Results are shown in Fig.4.
Gap around 180Hz comes from the violin mode. (Violin mode seems to be coherency in the time scale of injected swept sine.)
It must be removed from injected frequency points in the measurement just before O4a.
But in this time, we didn't remeasure it. We removed these measured points by analytically.
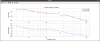
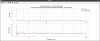
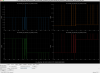
Estimated actuator efficiency ratio is ETMX/ITMX = 1.223 as shown in Fig.5.

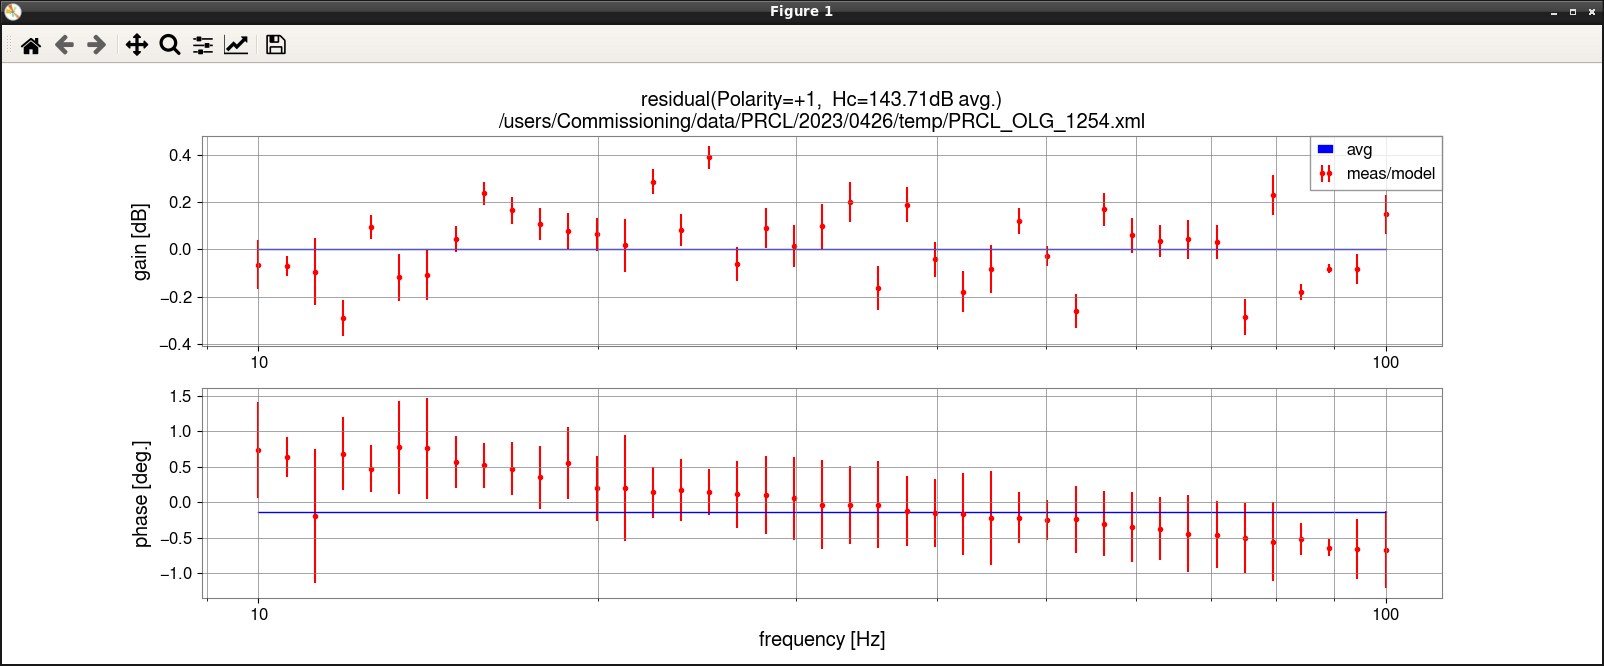
We also measured TFs from IM stage and MN stages. But analysis haven't been finished.
In this time we measured TF from 30Hz to 500Hz.
In order to obtain better coherence for IM and MN stages, we planned to add measurement frequency points below 30Hz in the next measurement.

Images attached to this report
Comments to this report:
takahiro.yamamoto - 3:02 Friday 28 April 2023 (24980) Print this report

Cont'd work

Actuator efficiency of BS TM
Now we have MICH optical gain, Hc, by Michelson fringes just before and after the measurement of MICH open loop transfer function in klog#24969. (Hc = 1.0893e9)
By using Hc as a standard of the calibration, actuator efficiency of BS TM, Ha, can be estimated from OLTF in short Michelson lock.
Measured and model OLTF and residual of measurement and model are shown in Fig.1 and Fig.2, respectively.
Estimated Ha is (5.238 +/- 0.074) * 1e-11 / f^2. This is 12% different from previous estimated value (5.9e-13 / f^2).
Note that this value is MICH_L basis. So actuator efficiency in BS_L basis is sqrt(2) times smaller.

Actuator efficiency of ETMX TM
Actuator efficiency of ETMX can be estimated as
H_{\rm etmx, tm} = (\rm ETMX/ITMX)_{\rm DARM} \times (\rm ITMX/BS)_{mich} \times H_{\rm bs, tm}^{\rm mich}
= (0.04733 +/- 0.00020) * (1.2228 +/- 0.0029) * (5.238 +/- 0.074) * 1e-11 / f^2
= (3.031 +/- 0.045) * 1e-12 / f^2
This is ~14% change from previous estimated value based on Green AOM (3.524e-12 / f^2).

Actuator efficiency of PRM TM
In order to decide the actuator efficiency of PRM, we also measured the transfer functions from PRM and BS to PRCL error signals.
A ratio of these two TFs indicates a ratio of actuator efficiency of PRM and BS.
Figure 3 and 4 shows the measured TFs and ratio of them.
From these results, actuator efficiency ratio between PRM and BS is estimated as 27.39 +/- 0.26.

As shown in Fig.5, BS actuator efficiency in PRCL basis is 2 times smaller than one in MICH basis.
So we can compute PRM actuator efficiency in PRCL basis as
H_{\rm prm,tm} = (\rm PRM/BS)_{\rm PRCL} \times \frac{1}{2}H_{bs,tm}^{mich}
= (27.39 +/- 0.26) * 0.5 * (5.238 +/- 0.074) * 1e-11 / f^2
= (7.17 +/- 0.12) * 1e-10 / f^2
This is 30% different from klog#13020 (1.0e-9) and 4 times different from klog#14555 (2.96e-9).
Hmm...

Optical gains
Optical gain of DARM, PRCL, MICH in PRFPMI can be estimated from open loop transfer functions and actuator efficiency of ETMX, PRM and BS as
H_c^{\rm dof} = G_{\rm meas.}^{\rm dof} / (C_{0, \rm model}^{\rm dof} D A_{\rm model}^{\rm optic})

Measured and model OLTF and their residual are shown as Fig.6, 7 (DARM), Fig. 8, 9 (PRCL), Fig.10 and 11 (MICH) and estimated optical gains are as follows.
Hc_DARM = (7.67 +/- 0.11) * 1e12
Hc_PRCL = (1.533 +/- 0.026) * 1e7
Hc_MICH = (6.707 +/- 0.096) * 1e8

Images attached to this comment
takahiro.yamamoto - 20:23 Saturday 29 April 2023 (25024) Print this report

Cont'd work 2

Actuator efficiency of ETMX TM by pcal
With the same manner of estimating actuator efficiency ratio between two suspensions,
Actuator efficiency of ETMX TM was also estimated from the two transfer functions from Pcal-X and ETMX TM to DARM error signals.
A ratio between these transfer function represents
\left(\frac{\rm DARM~error}{\rm ETMX~TM}\right )\left(\frac{\rm DARM~error}{\rm Pcal}\right)^{-1} = \frac{A_{\rm etmx,tm}}{A_{\rm pcal}}
where A_{etmx,tm} contains actuator efficiency, filterbanks from DRIVEALIGN to COILOUTF, digital AI, 61us digital delay between VIS and IOP, DAC, analog AI, coil driver and pendulum response,
and also A_{pcal} contains pcal efficiency, pendulum response, optical loss of pcal, analog AA, ADC, digital AA.
(Detailed components and calculation theory are described in JGW-T2113446.)

Pcal actuator efficiency is already know by the laser power calibration by integration spheres as 7.521e-12/f^2 [m/W]
(This value already contains the optical loss between ETM and RxPD).

Two transfer functions and residual of them are shown in Fig.1 and Fig.2, respectively.
Pcal-X pushes ETMX to AR direction and the definition of DARM is Lx - Ly.
So "+" (push) direction of Pcal is "+DARM" direction (= "-L" direction of ETMX suspension).
As a results, actuator efficiency of ETMX TM was estimated as (-3.5185 +/- 0.0085)e-12 / f^2.
(Total systematic errors of Pcal haven't been taken into account yet.)

Summary
 

  ETMX to DARM ITMX to DARM BS to MICH PRM to PRCL klog
'23/04/26 Pcal (-3.5185+/-0.0085)e-12 (-2.8774+/-0.0097)e-12 (6.080+/-0.033)e-11 (-8.326+/-0.091)e-10 This post
'23/04/26 FSM (*1) (-3.031 +/- 0.045)e-12 (-2.479+/-0.036)e-12 (5.238+/-0.074)e-11 (-7.17+/-0.12)e-10 klog#24969, #24980
'22/10/22 OpLev       -6.96e-10 (*2)
'22/10/11 Gr AOM -3.524e-12       klog#22434, #21630
'22/08/03 FSM (*1)     5.9e-11   klog#21676
'20/06/17 FSM Post O3GK (*1)     6.28e-11 -2.98e-9 klog#14557, #14555
'20/04/21 FSM O3GK (*1) -4.46e-12 (*3) -5.17e-12 (*3) 5.63e-11   klog#14194
'20/04/21 Pcal O3GK -4.59e-12 (*3)       klog#14554, #14265
'20/04/16 Pcal O3GK -4.71e-12 (*3)       klog#14194
'20/04/07 Pcal O3GK -4.66e-12 (*3)       klog#14073
'20/02/18 FSM Pre O3GK (*1)     6.02e-11 -1.01e-9 klog#11754, #13020


(*1) Because FSM method cannot decide the sign of actuator efficiency, sign is decided based on suspension L direction defined by VIS/CRY groups.
(*2) I fitted /kagra/Dropbox/Measurements/VIS/PLANT/PRM/2022/07/PLANT_PRM_ISOLATED_TM_TEST_L_202207251949.xml and set it on filterbank on 2022-10-22 by my personal memo.
I couldn't find the klog post about this. So I forgot it...
(*3) Actuator efficiency is ~1.33 times different between O3 and O4 because convention in CAL (SUMOUT_GAIN=1.5 was included in efficiency during O3), and
in VIS/CRY (EUL2COIL and COILOUTF_GAIN were changed from 1.0 to 0.25 and from ~0.5 to ~1.0, respectively) were changed.

Images attached to this comment
takahiro.yamamoto - 2:31 Sunday 30 April 2023 (25030) Print this report

I checked the past data and klog to see why estimated values of the PRM actuator efficiency has so large (2-3 times) difference between O3 and O4.

1) TM_EUL2COIL matrix was changed as 1.0->0.25 on Jun. 22nd, 2022
There is no exact log on this day. But we updated EUL2COIL for Type-Bp TOWER on Jun. 21nd, 2022 reported as klog#21220.
And also, TM_EUL2COIL elements were surely changed on this day as shown in Fig.1.
During O3, Only Type-B matrices were computed as an inverse matrix of the geometrical one.
For this reason, elements for L direction were set 1.0 for Type-A and Type-Bp and 0.25 for Type-B.
In O4 preparation, we unified the convention of EUL2COIL as the inverse matrices of the geometrical one for all types of suspension.

Nakano-kun's measurement (-2.98e-9 m/ct) on Jun. 17th, 2020 reported as klog#14555
must be multiply a factor of 0.25 in order to compare the three results in O4 (-8.326e-10, -7.17e-10, and -6.96e-10 m/ct).
The result after correcting a factor of 0.25 (-2.98e-9 * 0.25 = -7.45e-10 m/ct) is consistent with O4 results as ~20%.


2-a) Sign flip was fixed on Mar. 5th, 2020
This was reported by Aso-san as klog#13350.
Because sign only for H1 coil was wrong, actuator efficiency of L direction increased as a factor of 2.0 by fixing this bug.

2-b) Coil balancing was done on Mar. 18th 2020
This was reported by Ushiba-kun as klog#13658.
According to past data, changes in gain are as follows (See also Fig.2).
- H1: 2.0 => 2.0 (no change, the reason why it's 2.0 instead of 1.0 is klog#20155)
- H2: -1.0 => -0.994
- H3: 1.0 => 0.729
- H4: -1.0 => -0.788
So the actuator efficiency for L direction should decrease as ~12% by this change.

Considering 2-a) and 2-b), Nakano-kun's measurement reported as klog#14555 (after 2-a and 2-b)
should be ~2.3 times larger than Michimura-san's measurement reported as klog#13020 (before 2-a and 2-b).
After this correction, these two results are consistent within ~30%.

Images attached to this comment
Search Help
×

Warning

×