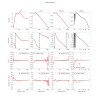
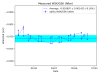
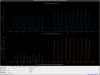
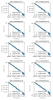
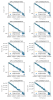
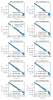
The fitting results for the individual SRX and SRY peaks in klog:37381 are shown below. The measurement data are stored in:
SRX: Dropbox → All files/Dropbox KAGRA/Measurements/IFO/SRCL/SRCL_OMC_REFL_beat_signal_PZT_sweep/2026_08_19_SRX
SRY: Dropbox → All files/Dropbox KAGRA/Measurements/IFO/SRCL/SRCL_OMC_REFL_beat_signal_PZT_sweep/2026_08_19_SRY
SRX
Fig. 1: Around 1.6 GHz, without a linear background. Using data from 1624.5 MHz to 1626 MHz, the fitted peak frequency is 1625.482(10) MHz.
Fig. 2: Around 1.6 GHz, with a linear background. Using data from 1624.5 MHz to 1626 MHz, the fitted peak frequency is 1625.392(27) MHz.
Fig. 3: Around 800 MHz, without a linear background. Using data from 805.8 MHz to 807.6 MHz, the fitted peak frequency is 806.6576(56) MHz.
Fig. 4: Around 800 MHz, with a linear background. Using data from 805.8 MHz to 807.6 MHz, the fitted peak frequency is 806.583(13) MHz.
Fig. 5: Around −800 MHz, without a linear background. Using data from 781.4 MHz to 783.5 MHz, the fitted peak frequency is 782.5641(65) MHz.
Fig. 6: Around −800 MHz, with a linear background. Using data from 781.4 MHz to 783.5 MHz, the fitted peak frequency is 782.669(11) MHz.
Fig. 7: Around −1.6 GHz, without a linear background. Using data from 1602.5 MHz to 1604.4 MHz, the fitted peak frequency is 1603.5358(58) MHz.
Fig. 8: Around −1.6 GHz, with a linear background. Using data from 1602.5 MHz to 1604.4 MHz, the fitted peak frequency is 1603.670(14) MHz.
SRY
Fig. 9: Around 1.6 GHz, without a linear background. Using data from 1629.5 MHz to 1631.5 MHz, the fitted peak frequency is 1630.4461(51) MHz.
Fig. 10: Around 1.6 GHz, with a linear background. Using data from 1629.5 MHz to 1631.5 MHz, the fitted peak frequency is 1630.5078(68) MHz.
Fig. 11: Around 800 MHz, without a linear background. Using data from 824 MHz to 825.8 MHz, the fitted peak frequency is 825.0175(40) MHz.
Fig. 12: Around 800 MHz, with a linear background. Using data from 824 MHz to 825.8 MHz, the fitted peak frequency is 825.0011(74) MHz.
Fig. 13: Around −800 MHz, without a linear background. Using data from 833.3 MHz to 835.3 MHz, the fitted peak frequency is 834.3511(42) MHz.
Fig. 14: Around −800 MHz, with a linear background. Using data from 833.3 MHz to 835.3 MHz, the fitted peak frequency is 834.3217(59) MHz.
Fig. 15: Around −1.6 GHz, without a linear background. Using data from 1599.75 MHz to 1601.5 MHz, the fitted peak frequency is 1600.5574(35) MHz.
Fig. 16: Around −1.6 GHz, with a linear background. Using data from 1599.75 MHz to 1601.5 MHz, the fitted peak frequency is 1600.5458(49) MHz.
I tried to modify SRM ADS.
There seems to be a peak at 26 Hz, which is close to the dither frequency of SRM YAW ADS in POP90 with no excitation. So I tried to changed the dither frequencies, PIT: 26.125Hz -> 22.125 Hz, YAW: 28.125 Hz -> 24.125 Hz. Also, I perfomed the phasing for SRM PIT and YAW dither at these frequencies and checked the reproducibilities. Before this, I implemented the bandpass filters for these frequencies. The phases seems to have somehow reproducible if we implemented resG filters for these frequencies in the SRCL loop. I applied theire phase (PIT:174.5 deg, YAW: 144.9 deg) for demodulation phases and modified the comb filters in DEMOD_{PIT, YAW}.
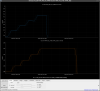
Fig.1 shows the timeseries of ADS error/feedback signals, buildup sideband powers in PRCL/SRCL and REFL and AS DC powers. After engaging SRM ADSs with PRM, IMMT2 ADSs and calming down, AS34 seems to be improved slightly. However unfortunately, earthquake occured. So I gave up tonight work. Tomorrow, I will evaluate them in terms of stability and reproducibility.
After that, I (might be) restored the ADS setups.
Saito-kun reported today’s SRX/SRY length measurement yielded an unexpected result.
So I independently performed a cross-check of the SRX data analysis and obtained a result which is consistent with the previous measurement.
Fig. 1 shows the FSR index vs. beat frequency plot for today’s SRX measurement, obtained by applying the today's measurement data to the analysis code that I previously used (klog #37184).
The fitted SRX lengths are
L_SRX_measured (my code) = 68.2862(18) mL_SRX_measured (Saito-kun's code) = 68.2261(18) mFor comparison,
L_SRX_measured (previous measurement: klog #37260) = 68.2842(13) mL_SRX_design = 68.2562 mThe result obtained with my code is consistent with the previous measurement, and this suggests that there may be an issue with Saito-kun’s analysis code.
We would like to discuss this tomorrow.
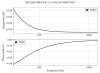
I post the power spec. I'd also like to look into the sn ratio.
[Fujimoto, Tanaka, Hirose]
This is a continuation of klog37368.
Based on the demodulation phase plots of the sensing matrix measured in klog37368, we adjusted the demodulation phases of the WFS signals. And we tried to WFS control to BS roughly.
For REFL QPDA1 RF17, the responses of PR3, SR3, and BS were almost orthogonal in the demodulation phase plot. Therefore, we rotated the demodulation phase by 73.5deg to minimize the PR3 response in the I signal.
However, when we checked the power spectrum, the WFS signal still showed a correlation with the PR3 OPLEV signal, as seen before. Therefore, we concluded that it is difficult to use REFL QPDA1 RF17 for BS control. (I will summarize the details later.)
For AS QPDA2 RF28, we set the demodulation phase to +46.6 deg to reduce the SR3 and PR3 responses in the I signal as much as possible. At this phase, the expected response ratio of BS, SR3, and PR3 is [BS : PR3: SR3 = 0.148[cnt/urad]: 0.0401[cnt/urad]: 0.0472[cnt/urad] = 1 : 0.271 : 0.319].
To check whether the measured responses follow the demodulation phase plot of the sensing matrix, we measured the transfer functions with the demodulation phases set to 0 deg, +46.6 deg, and −46.6 deg.
When BS was excited, the measured response approximately followed the demodulation phase plot of the sensing matrix. However, this was not the case when SR3 was excited. The reproducibility of the SR3 measurement needs to be checked. (I will summarize the details later.)
After rotating the demodulation phase of AS QPDA2 RF28 by +46.6 deg, we also measured the sensing matrix in the YAW direction. Since the signal was larger in Q than in I for YAW, we decided to use the I signal for PIT and the Q signal for YAW.
For each direction, we calculated the inverse of QPD signal / OPLEV signal and used it as the coefficient in the input matrix. The input matrix was applied to the MICH filter on ASC_OVERVIEW MEDM screen.
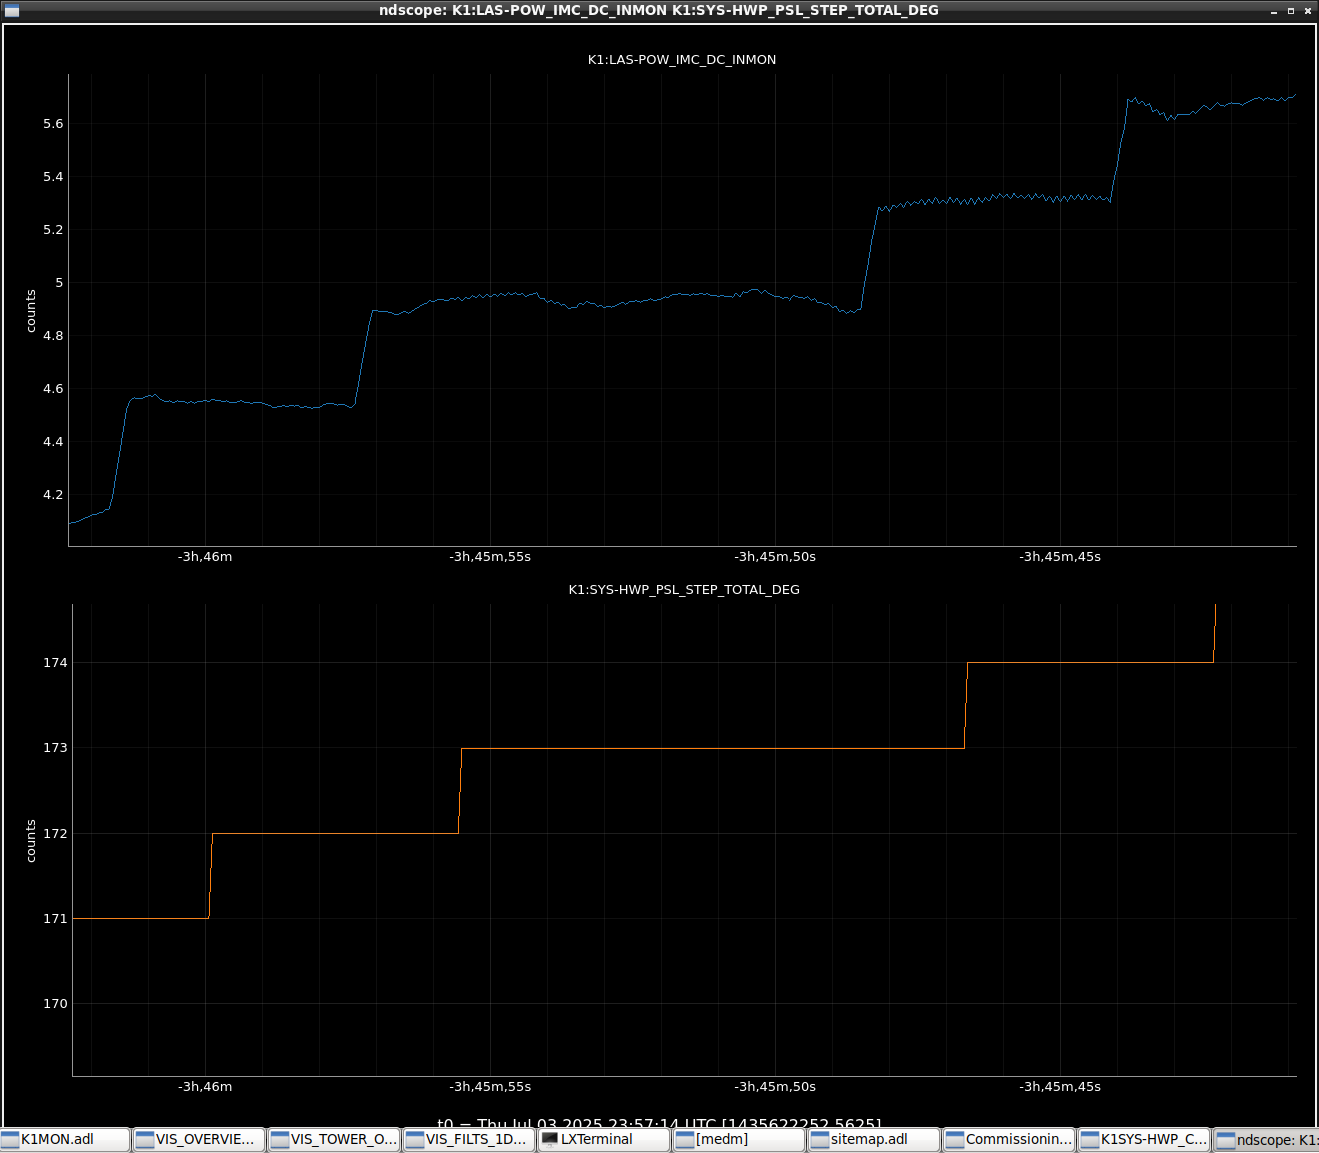
With this configuration, we added an integrator and (very low) gain and turned on the BS WFS control. Before turning on the control, we added an offset so that the error signal stayed at the same position as before the control was engaged. (FIG5)
The control did not oscillate. However, when we increased the gain further, the fluctuation of POPRF90 became larger, possibly due to gain peaking.
When the SRM ADS was turned on together with the BS WFS control, both SRM and BS continued to move in the same direction at DC. This may indicate that the BS WFS and SRM ADS are competing with each other.
Also, when the WFS offset was set to zero, both POP90 and AS34 decreased.(FIG6)
[Tanaka, Fujimoto, Saito]
After aligning the sub-laser, the single-pass beam profile became much cleaner than before the lens-height adjustment (Fig. 1 in klog:37121). The SRX and SRY lengths were then measured following the same procedure as in klog:37260. The deviations from the design values were found to be −3.01(18) cm for SRX and −3.516(42) cm for SRY. Compared with the results of klog:37250 and klog:37260, namely 2.80(13) cm for SRX and 1.757(50) cm for SRY, the differences are -3.01(18) cm-2.80(13) cm=−5.81(22) cm for SRX and -3.516(42) cm-1.757(50) cm−5.273(65) cm for SRY, indicating a significant discrepancy. The cause is currently unknown. In addition, the maximum beat-signal amplitude was only about 1 mV, whereas it had been about 4 mV in klog:37250 and klog:37260, suggesting that the mode-matching ratio may have degraded. Using the same procedure as in klog:37260, the SRC length and Schnupp asymmetry were also calculated, yielding 66.55867(92) m and 3.33486(185) m, respectively. Compared with the klog:37260 results of 66.61409(70) m for SRC and 3.34023(139) m for the Schnupp asymmetry derived from SRC, the differences are 66.55867(92) m-66.61409(70) m=−5.54(12) cm for SRC and 3.33486(185)m-3.34023(139)m=0.537(231) cm for the Schnupp asymmetry, indicating that the SRC result also differs significantly.
The measured peaks were fitted both with and without a linear background. The fitting results for the individual peaks will be posted separately. From the fitted peak frequencies and their uncertainties, the minimum and maximum frequencies within the uncertainty range were determined, and the overall uncertainty was defined as the combined range from both fitting methods. The following frequency ranges were then used to determine the SRX and SRY lengths.
SRX
Minimum (MHz) Maximum (MHz)
1625.3644 1625.4925
806.5704 806.6633
-782.6801 -782.5577
-1603.6842 -1603.5300
SRY
Minimum (MHz) Maximum (MHz)
1630.4411 1630.5146
824.9937 825.0215
-834.3554 -834.3158
-1600.5609 -1600.5409
The midpoint of each frequency range was divided by the FSR calculated from the design lengths of 68.2562 m for SRX and 64.9264 m for SRY. The resulting values were rounded to the nearest integers, and the measured frequencies were fitted with the function AN+B where A and B are fitting parameters and N is an integer. The fitting results are:
SRX (Fig. 12)
A: 2.197053(57) MHz
B: −0.036(30) MHz
SRY (Fig. 13)
A: 2.309961(15) MHz
B: 0.1600(86) MHz
Since A corresponds to the FSR, the cavity lengths are:
SRX
Fitted length: 68.2261(18) m
Design length: 68.2562 m
Difference (fitted − design): −3.01(18) cm
SRY
Fitted length: 64.89124(42) m
Design length: 64.9264 m
Difference (fitted − design): −3.516(42) cm
Compared with the klog:37250 and klog:37260 results of 2.80(13) cm for SRX and 1.757(50) cm for SRY, the differences are:
SRX: -3.01(18) cm - 2.80(13) cm = −5.81(22) cm
SRY: -3.516(42) cm - 1.757(50) cm = −5.273(65) cm
These discrepancies are substantial, and their cause remains unknown. Furthermore, the maximum beat-signal amplitude was only about 1 mV, compared with about 4 mV in the previous measurements(klog:37250, klog:37260), suggesting that the mode-matching ratio may have decreased.
Using these results, the SRC length and Schnupp asymmetry were calculated following the same procedure as in klog:37260.
SRC
Calculated length: 66.55867(92) m
Design length: 66.5913 m
Difference (calculated − design): −3.263(92) cm
Schnupp asymmetry
Value derived from SRC: 3.33486(185) m
Design value: 3.3298 m
Difference (derived − design): 0.506(185) cm
Compared with the klog:37260 results of 66.61409(70) m for SRC and 3.34023(139) m for the Schnupp asymmetry derived from SRC, the differences are:
SRC: 66.55867(92) m - 66.61409(70) m = −5.54(12) cm
Schnupp asymmetry derived from SRC: 3.33486(185) m - 3.34023(139) m = 0.537(231) cm
Thus, the SRC result also differs significantly from the previous measurement.
with Misato Onishi
We connected the new Pcal-Y laser to the existing control PC, caleyal, via USB.
The original laser is still recognized normally as /dev/ttyUSB0 with the pl2303 driver (067b:2303). The new laser was detected by lsusb as 067b:23a3, but no serial driver was bound to it and /dev/ttyUSB1 was not created.
Since we had limited time today, we did not modify any software or services to avoid affecting the existing laser control system.
The USB connection of the new laser will be kept as is. The interlock key was removed before leaving, so the new laser cannot be turned on in the current state.
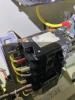
I found that the plug that should be connected to the PZT OUTPUT for REFL QPD3 PIT was disconnected.
After reconnecting it, I aligned the beam to the center of the QPD. I then injected an excitation signal into the PZT and confirmed that the beam moved on the QPD.
I resumed preparations for making effective use of the DetChar cluster, including k1detms0 and the computing nodes k1detcl[012]. (past log: klog31462, related slide)
I configured the computing environment to avoid potential issues with Conda and the system clocks.
I found that the wrong disk had been mounted via NFS, so I corrected the configuration to use the proper server.
I started testing the automatic production of segment files using HTCondor. I will continue monitoring the generated files and logs to confirm stable operation.
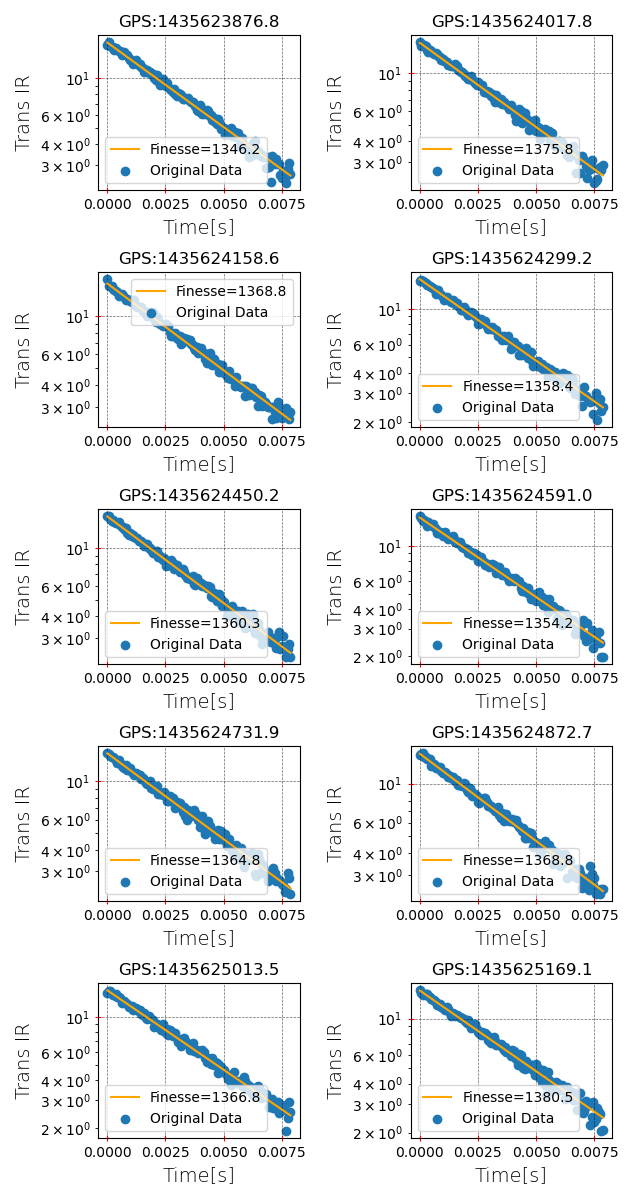
I am attaching one of the measurement results from this work.
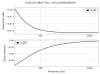
This is the noise measurement on the LPD (the photodiode located immediately after the laser head), comparing the original laser (= “old laser”) and the new laser. The results show that the new laser has approximately 10 times better noise performance.
(Other results, including noise measurements around the OFS and OLTF measurements, will be reported later.)
[Fujimoto, Tanaka, Hirose]
We measured the WFS sensing matrix in the DRMI1f lock configuration. The SRM and BS ADS loops were turned off during the measurement.
The DC centering loops were engaged for the WFS QPDs. However, the DC centering loop for REFL QPD3 PIT could not be engaged. We previously replaced and checked the PZT mirror mount, but there may still be a problem with the connection. Therefore, REFL QPD3 PIT was measured without the DC centering loop.
The sensing matrix was measured for all WFS QPDs using the PIT direction of BS, SRM, SR3, and PR3.
At first, each mirror was excited at 22.125 Hz. However, we found a phase shift of more than 50 degrees between the WFS signal and the OPLEV signal. This phase shift may come from the OPLEV low-pass filters and/or the whitening filters of the QPD signals. Since it was difficult to identify the sign for each degree of freedom, we repeated the measurement at a lower frequency of 2 Hz.
For each QPD, the responses of BS, SRM, SR3, and PR3 were plotted on a polar plot as a function of the demodulation phase.(FIG1-FIG8)
(Data: /users/Commissioning/data/ASC/2026/DRMI/0818/RFQPD_OPLEV_{BS, SRM, SR3, PR3}_P_260818.xml )
For REFL RF17 in the PIT direction, the BS response is nearly orthogonal to the other degrees of freedom. Therefore, it seems possible to separate the BS signal from the other signals by adjusting the demodulation phase. However, the responses from SR3 and PR3 are relatively large.
For AS RF28, the responses from SR3 and PR3 are also large. If the demodulation phase is set approximately 45 degrees from the BS response, we may obtain a signal that is more sensitive to SR3 and PR3 than to BS.
We also organized the script used for this measurement. In this measurement, all mirror degrees of freedom are excited at the same frequency using diaggui, and the WFS and OPLEV signals are measured. The script reads the saved diaggui files and plots the WFS responses in the complex plane to investigate the demodulation phase.
The scripts are stored in the directory below: /users/Commissioning/scripts/asc/WFS_sensingmatrix
The main settings are specified in "main.py". However, some paths in the Python scripts used to load the data may need to be changed. I plan to modify the scripts so that most of the settings can be controlled only from "main.py".
I found that the plug that should be connected to the PZT OUTPUT for REFL QPD3 PIT was disconnected.
After reconnecting it, I aligned the beam to the center of the QPD. I then injected an excitation signal into the PZT and confirmed that the beam moved on the QPD.
I post the power spec. I'd also like to look into the sn ratio.
I am attaching one of the measurement results from this work.
This is the noise measurement on the LPD (the photodiode located immediately after the laser head), comparing the original laser (= “old laser”) and the new laser. The results show that the new laser has approximately 10 times better noise performance.
(Other results, including noise measurements around the OFS and OLTF measurements, will be reported later.)
[Kimura and Yasui]
We stopped the X-end cryo-duct shield cryo-coolers and started heating the cryo-duct shields.
The cryo-duct shield cryo-coolers were stopped between 2:59 p.m. and 3:00 p.m.
Before stopping the cryo-coolers, we switched the vacuum exhaust pumps from the ion pumps to the turbo molecular pump.s
The switchover took place between 1:47 PM and 2:39 PM.
[Tanaka, Fujimoto, Saito]
The height of the lens was adjusted so that the main-laser beam passed through its center, addressing the issue reported in klog:37116. Accordingly, the height of one mirror and one BS was also adjusted. The main-laser beam profile was then measured, and the resulting mode-matching ratio relative to the beam before the lens adjustment was approximately 89%. Therefore, it is considered unnecessary to redo the mode matching. The next step will be to align the sub-laser.
Next, the main-laser beam profile was measured and fitted (Fig. 1). The green and yellow curves show the previous results (klog:37116), while the red and blue curves show the current results. The origin is defined as the position of the mirror immediately after the BS where the sub-laser beam enters toward the interferometer. The fitted waist positions and waist radii are as follows.
Previous (klog:37116)
x-direction: waist position = 303.2 ± 8.8 mm, waist radius = 0.0545 ± 0.0022 mm
y-direction: waist position = 330.3 ± 10.6 mm, waist radius = 0.0609 ± 0.0026 mm
→Average: waist position = 317 mm, waist radius = 0.058 mm
Current
x-direction: waist position = 302.8 ± 3.6 mm, waist radius = 0.0557 ± 0.0009 mm
y-direction: waist position = 317.8 ± 6.3 mm, waist radius = 0.0619 ± 0.0017 mm
→Average: waist position = 310 mm, waist radius = 0.059 mm
The mode-matching ratio between these two beam profiles is approximately 89%. Therefore, it is considered unnecessary to redo the mode matching. The next step will be to align the sub-laser.
[Tanaka, Fujimoto, Saito]
After aligning the sub-laser, the single-pass beam profile became much cleaner than before the lens-height adjustment (Fig. 1 in klog:37121). The SRX and SRY lengths were then measured following the same procedure as in klog:37260. The deviations from the design values were found to be −3.01(18) cm for SRX and −3.516(42) cm for SRY. Compared with the results of klog:37250 and klog:37260, namely 2.80(13) cm for SRX and 1.757(50) cm for SRY, the differences are -3.01(18) cm-2.80(13) cm=−5.81(22) cm for SRX and -3.516(42) cm-1.757(50) cm−5.273(65) cm for SRY, indicating a significant discrepancy. The cause is currently unknown. In addition, the maximum beat-signal amplitude was only about 1 mV, whereas it had been about 4 mV in klog:37250 and klog:37260, suggesting that the mode-matching ratio may have degraded. Using the same procedure as in klog:37260, the SRC length and Schnupp asymmetry were also calculated, yielding 66.55867(92) m and 3.33486(185) m, respectively. Compared with the klog:37260 results of 66.61409(70) m for SRC and 3.34023(139) m for the Schnupp asymmetry derived from SRC, the differences are 66.55867(92) m-66.61409(70) m=−5.54(12) cm for SRC and 3.33486(185)m-3.34023(139)m=0.537(231) cm for the Schnupp asymmetry, indicating that the SRC result also differs significantly.
The measured peaks were fitted both with and without a linear background. The fitting results for the individual peaks will be posted separately. From the fitted peak frequencies and their uncertainties, the minimum and maximum frequencies within the uncertainty range were determined, and the overall uncertainty was defined as the combined range from both fitting methods. The following frequency ranges were then used to determine the SRX and SRY lengths.
SRX
Minimum (MHz) Maximum (MHz)
1625.3644 1625.4925
806.5704 806.6633
-782.6801 -782.5577
-1603.6842 -1603.5300
SRY
Minimum (MHz) Maximum (MHz)
1630.4411 1630.5146
824.9937 825.0215
-834.3554 -834.3158
-1600.5609 -1600.5409
The midpoint of each frequency range was divided by the FSR calculated from the design lengths of 68.2562 m for SRX and 64.9264 m for SRY. The resulting values were rounded to the nearest integers, and the measured frequencies were fitted with the function AN+B where A and B are fitting parameters and N is an integer. The fitting results are:
SRX (Fig. 12)
A: 2.197053(57) MHz
B: −0.036(30) MHz
SRY (Fig. 13)
A: 2.309961(15) MHz
B: 0.1600(86) MHz
Since A corresponds to the FSR, the cavity lengths are:
SRX
Fitted length: 68.2261(18) m
Design length: 68.2562 m
Difference (fitted − design): −3.01(18) cm
SRY
Fitted length: 64.89124(42) m
Design length: 64.9264 m
Difference (fitted − design): −3.516(42) cm
Compared with the klog:37250 and klog:37260 results of 2.80(13) cm for SRX and 1.757(50) cm for SRY, the differences are:
SRX: -3.01(18) cm - 2.80(13) cm = −5.81(22) cm
SRY: -3.516(42) cm - 1.757(50) cm = −5.273(65) cm
These discrepancies are substantial, and their cause remains unknown. Furthermore, the maximum beat-signal amplitude was only about 1 mV, compared with about 4 mV in the previous measurements(klog:37250, klog:37260), suggesting that the mode-matching ratio may have decreased.
Using these results, the SRC length and Schnupp asymmetry were calculated following the same procedure as in klog:37260.
SRC
Calculated length: 66.55867(92) m
Design length: 66.5913 m
Difference (calculated − design): −3.263(92) cm
Schnupp asymmetry
Value derived from SRC: 3.33486(185) m
Design value: 3.3298 m
Difference (derived − design): 0.506(185) cm
Compared with the klog:37260 results of 66.61409(70) m for SRC and 3.34023(139) m for the Schnupp asymmetry derived from SRC, the differences are:
SRC: 66.55867(92) m - 66.61409(70) m = −5.54(12) cm
Schnupp asymmetry derived from SRC: 3.33486(185) m - 3.34023(139) m = 0.537(231) cm
Thus, the SRC result also differs significantly from the previous measurement.
Saito-kun reported today’s SRX/SRY length measurement yielded an unexpected result.
So I independently performed a cross-check of the SRX data analysis and obtained a result which is consistent with the previous measurement.
Fig. 1 shows the FSR index vs. beat frequency plot for today’s SRX measurement, obtained by applying the today's measurement data to the analysis code that I previously used (klog #37184).
The fitted SRX lengths are
L_SRX_measured (my code) = 68.2862(18) mL_SRX_measured (Saito-kun's code) = 68.2261(18) mFor comparison,
L_SRX_measured (previous measurement: klog #37260) = 68.2842(13) mL_SRX_design = 68.2562 mThe result obtained with my code is consistent with the previous measurement, and this suggests that there may be an issue with Saito-kun’s analysis code.
We would like to discuss this tomorrow.
The fitting results for the individual SRX and SRY peaks in klog:37381 are shown below. The measurement data are stored in:
SRX: Dropbox → All files/Dropbox KAGRA/Measurements/IFO/SRCL/SRCL_OMC_REFL_beat_signal_PZT_sweep/2026_08_19_SRX
SRY: Dropbox → All files/Dropbox KAGRA/Measurements/IFO/SRCL/SRCL_OMC_REFL_beat_signal_PZT_sweep/2026_08_19_SRY
SRX
Fig. 1: Around 1.6 GHz, without a linear background. Using data from 1624.5 MHz to 1626 MHz, the fitted peak frequency is 1625.482(10) MHz.
Fig. 2: Around 1.6 GHz, with a linear background. Using data from 1624.5 MHz to 1626 MHz, the fitted peak frequency is 1625.392(27) MHz.
Fig. 3: Around 800 MHz, without a linear background. Using data from 805.8 MHz to 807.6 MHz, the fitted peak frequency is 806.6576(56) MHz.
Fig. 4: Around 800 MHz, with a linear background. Using data from 805.8 MHz to 807.6 MHz, the fitted peak frequency is 806.583(13) MHz.
Fig. 5: Around −800 MHz, without a linear background. Using data from 781.4 MHz to 783.5 MHz, the fitted peak frequency is 782.5641(65) MHz.
Fig. 6: Around −800 MHz, with a linear background. Using data from 781.4 MHz to 783.5 MHz, the fitted peak frequency is 782.669(11) MHz.
Fig. 7: Around −1.6 GHz, without a linear background. Using data from 1602.5 MHz to 1604.4 MHz, the fitted peak frequency is 1603.5358(58) MHz.
Fig. 8: Around −1.6 GHz, with a linear background. Using data from 1602.5 MHz to 1604.4 MHz, the fitted peak frequency is 1603.670(14) MHz.
SRY
Fig. 9: Around 1.6 GHz, without a linear background. Using data from 1629.5 MHz to 1631.5 MHz, the fitted peak frequency is 1630.4461(51) MHz.
Fig. 10: Around 1.6 GHz, with a linear background. Using data from 1629.5 MHz to 1631.5 MHz, the fitted peak frequency is 1630.5078(68) MHz.
Fig. 11: Around 800 MHz, without a linear background. Using data from 824 MHz to 825.8 MHz, the fitted peak frequency is 825.0175(40) MHz.
Fig. 12: Around 800 MHz, with a linear background. Using data from 824 MHz to 825.8 MHz, the fitted peak frequency is 825.0011(74) MHz.
Fig. 13: Around −800 MHz, without a linear background. Using data from 833.3 MHz to 835.3 MHz, the fitted peak frequency is 834.3511(42) MHz.
Fig. 14: Around −800 MHz, with a linear background. Using data from 833.3 MHz to 835.3 MHz, the fitted peak frequency is 834.3217(59) MHz.
Fig. 15: Around −1.6 GHz, without a linear background. Using data from 1599.75 MHz to 1601.5 MHz, the fitted peak frequency is 1600.5574(35) MHz.
Fig. 16: Around −1.6 GHz, with a linear background. Using data from 1599.75 MHz to 1601.5 MHz, the fitted peak frequency is 1600.5458(49) MHz.
Fujimoto, Tanaka
We also performed the MICH actuator diagonalization by using 1f sensors with the same procedure as 3f sensors in klog37352, in order to check whether the diagonalization value by 1f sensors become the same as the value by 3f sensors. This time, we did not perform the 1f sensor diagonalization before the actuator diagonalization.
The values are summarized as below
Also, we compared these ratios with the ratios of the actuator effeciecies measued by Length OPLEVs. According to suspensions' plant models in FM10 of {PRM,SRM,BS}_TM_OLDAMP, the actuator effieciencies @ 100 Hz are as below,
From above the efficiecies, the ratio between BS and PRM efficiencies is -143dB - (-171dB) = 28 dB. The diagonalization ratio between BS and PRM is also 20*log10(1/0.0425) = 27dB. They seem to be almost consistent. Similarly, the ratio between BS and SRM efficiencies is -157dB - (-171dB) = 14 dB. The diagonalization ratio between BS and SRM is also 20*log10(1/0.25) = 12dB. They have 3dB discrepancy.
We input these values in LSC OUTPUT MTRX and these value are implemented by the VERTEX guardian if the guardain are requested to DRMI_1F_LOCKED.
[Hirose, Tanaka, Ushiba, Komori (remote), Fujimoto]
We performed the MICH diagonalization for the DRMI 3f lock again, this time with the POP17I removed from the MICH signal.
The OLTFs were still clean by the MICH diagonalization, but the lock duration was only a few minutes, unlike the previous lock.
Further investigation is necessary to understand the cause of the short lock duration.
Possible causes are:
As Yokozawa-san pointed out, in the previous MICH diagonalization work (klog #37352), POP17I was mistakenly sent to MICH with a factor of 2.06500.
This time, we turned off this POP17I path and performed the MICH diagonalization using only the 3f signals.
Since the procedure was the same as before, please refer to the previous klog for the details.
Removal of PRCL coupling
We excited PRM in the length direction above the control bandwidth and removed the PRCL signal from MICH and SRCL.
Fig. 1 shows the peaks after reducing the coupling from PRCL.
The factors were changed as follows.
The coupling to MICH was reduced by about a factor of 4, and the coupling to SRCL was reduced by about a factor of 5.
These values were implemented in the guardian.
Removal of SRCL coupling
In the same way, we excited SRM above the control bandwidth and tried to remove the SRCL signal from PRCL and MICH.
However, as in the previous measurement, the coupling from SRCL was already sufficiently small, as shown in Fig. 2.
Therefore, we did not perform any further coupling reduction for SRCL.
Diagonalization of the MICH actuator
Fig. 3 shows the spectra when we diagonalized the MICH actuator by combining BS, PRM, and SRM.
The reference traces show the spectra when only BS was excited.
The OUTPUT_MTRX values to BS, PRM, and SRM used in this adjustment were as follows.
With this adjustment, the coupling to SRCL was reduced by about a factor of 10, and the coupling to PRCL was reduced by about a factor of 80.
Using the ratios obtained here, we changed the MICH actuator settings in the OUTPUT_MTRX of LSC_OVERVIEW as follows.
These values were also implemented in the guardian.
OLTFs
After the sensor and actuator diagonalization described above, we measured the OLTFs of MICH, PRCL, and SRCL, and adjusted the overall gains.
Figs. 4, 5, and 6 show the OLTFs of MICH, PRCL, and SRCL after the gain adjustment, respectively.
The current overall gains and filters are as follows.
As in the previous measurement, the OLTF shapes themselves were clean, and the strange-shape problem seen without the diagonalization was again resolved.
In addition, since the MICH output tended to be close to saturation, we changed the roll-off filter from ELP500 to ELP100 to reduce the RMS of the output.
Lock duration
Although the OLTFs were as clean as those obtained in the previous measurement, where POP17I was mixed into MICH, the lock duration was only a few minutes.
The cause of the short lock duration is still unclear, and further investigation is necessary.
Possible causes include:
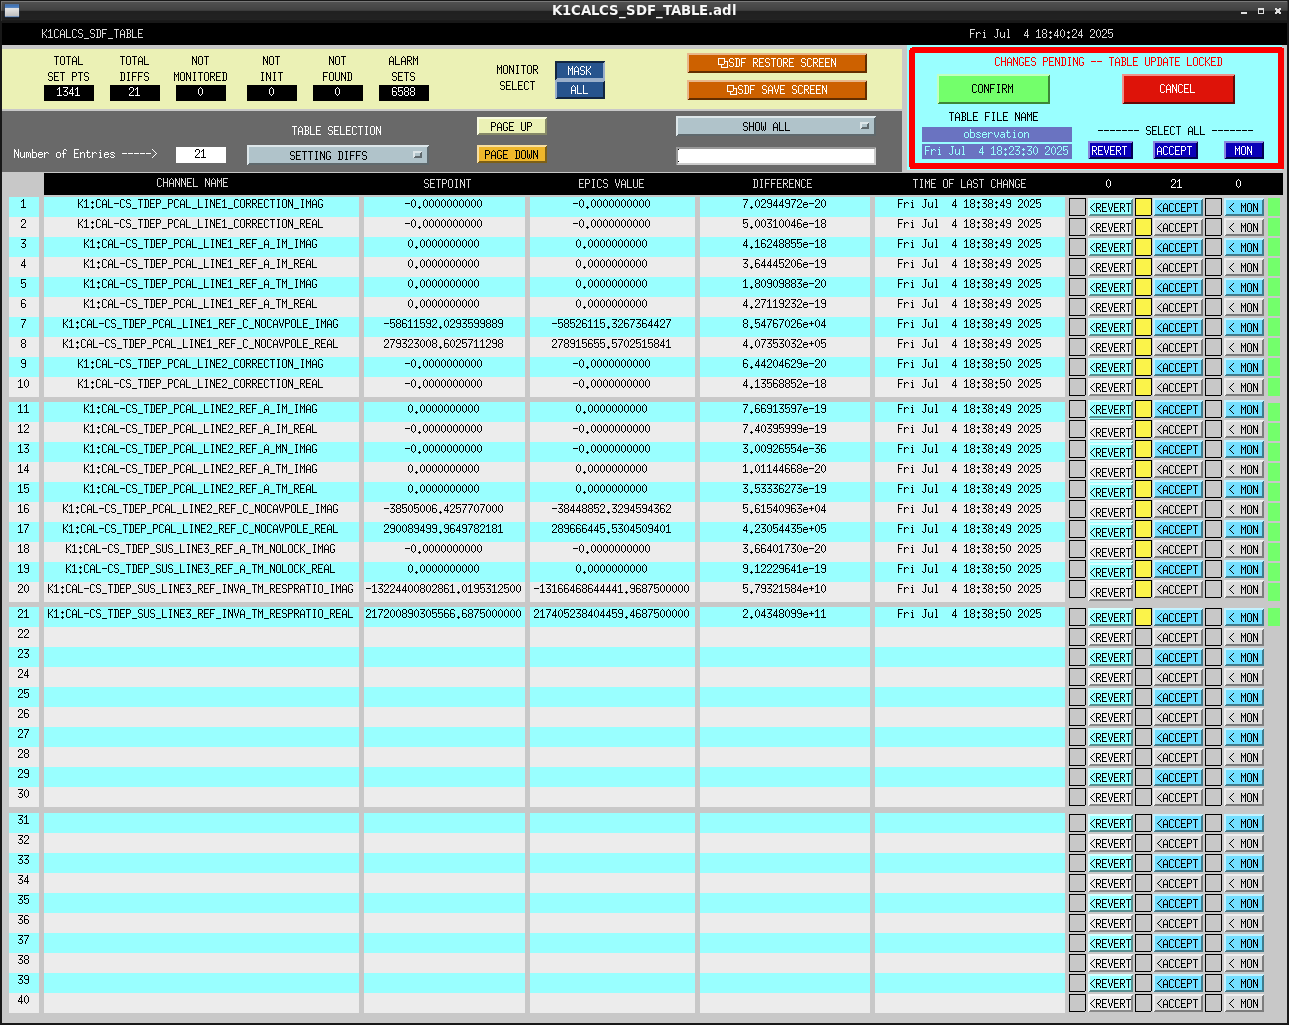
The first possibility is briefly discussed below.
Possible mis-diagonalization of the sensors and actuators
In this measurement, the following OUTPUT matrix elements were obtained as a result of the MICH actuator diagonalization.
On the other hand, according to the suspension model checked by Ushiba-san, the actuator efficiencies at 100 Hz are:
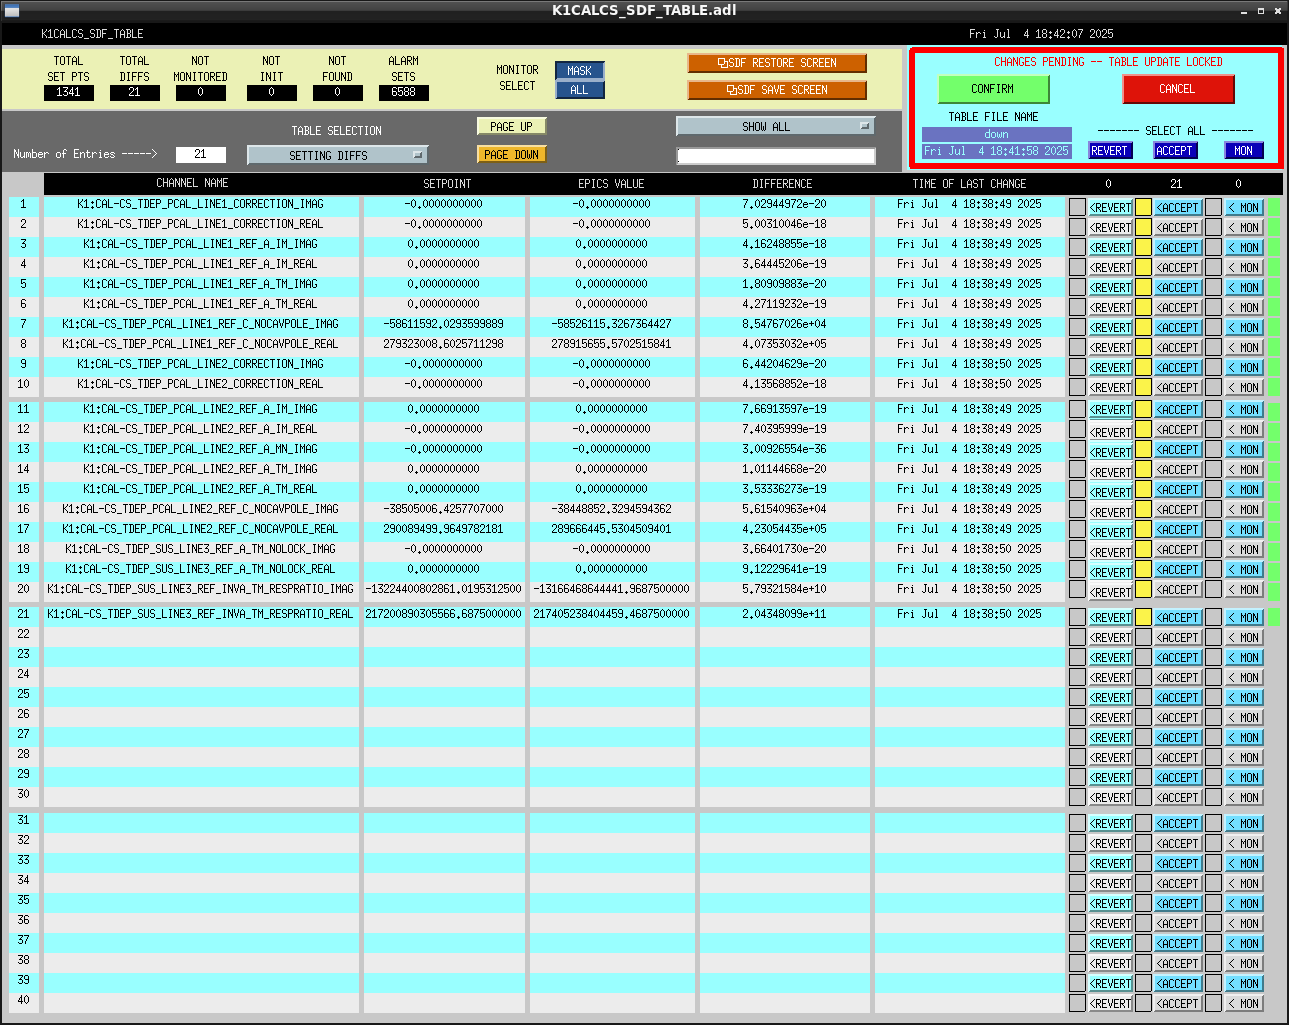
From these values, the theoretically expected absolute values of the MICH actuator factors, including the correction for the 45-degree angle of BS, are:
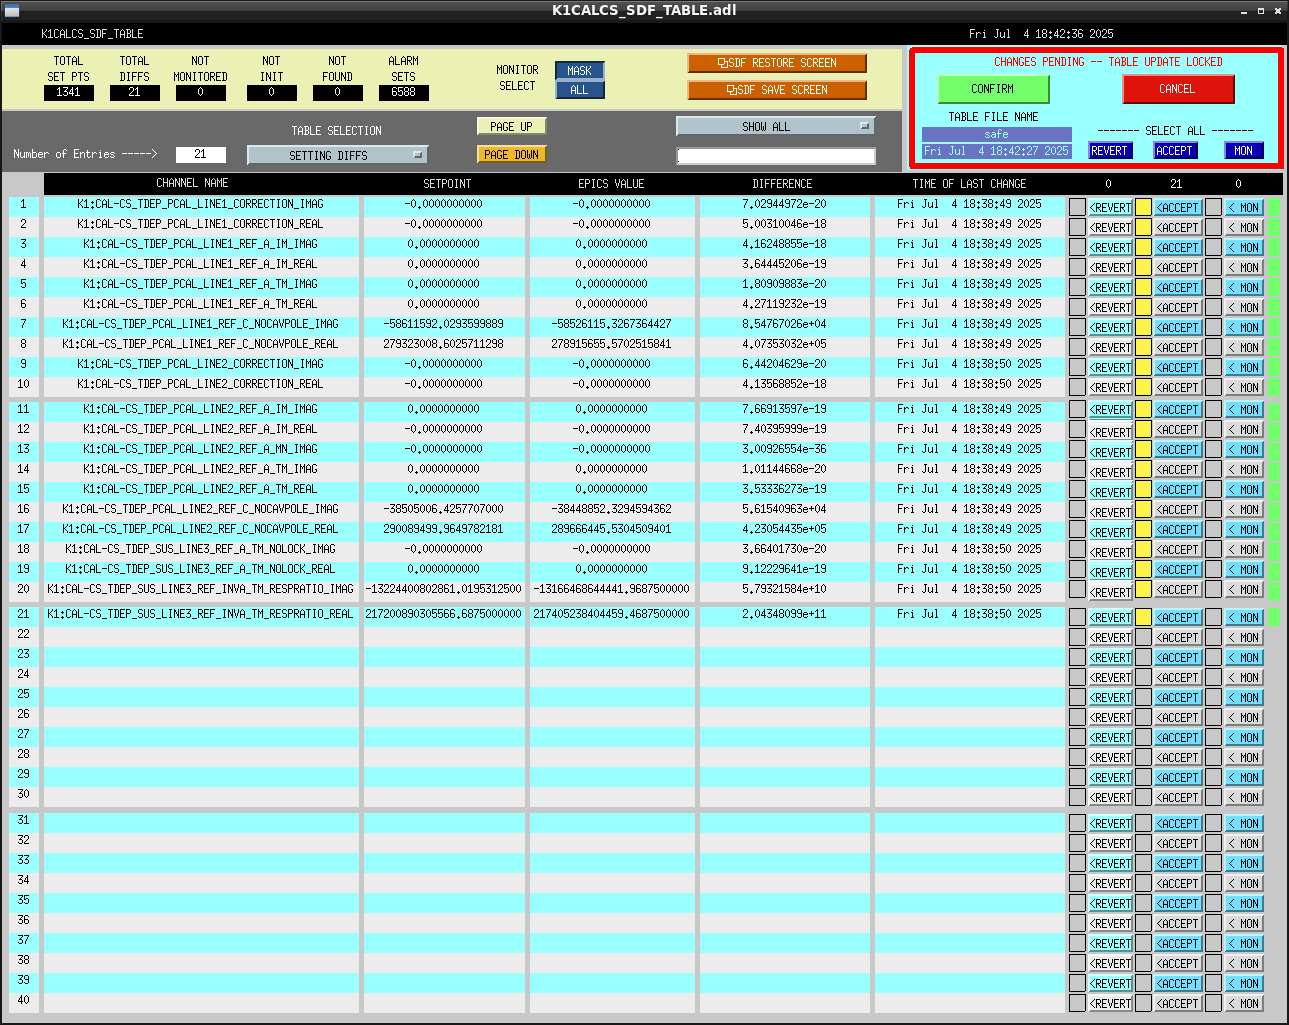
The measured MICH_to_PRM factor is roughly consistent with the model prediction.
However, the measured MICH_to_SRM factor is about 1.8 times larger than the model prediction.
One possible reason is that the demodulation phase of REFL51I/Q was not well tuned, and the MICH signal leaked into REFL51I.
Therefore, it may be useful to assume that the values from the suspension model correctly produce a pure MICH actuator, and then use this actuator to phase REFL51I/Q.
One possible plan is to implement the ADS loops for SRM and BS in DRMI in order to improve the alignment reproducibility.
This will help us check whether the lock duration depends strongly on the alignment.
Also, as mentioned in the discussion above, it may be useful to construct a pure MICH actuator using the theoretical values from the suspension model, or using the length oplev signals as suggested by Ushiba-san.
Then, we can use this pure MICH actuator to determine the sensor diagonalization.
[Shaojin, Washimi]
Today we finished the masurement at the X-end outside, and cleaned up out setup.
After that, we moved them and started at Mozumi area.
A check of package/module dependency for user Guardian codes on the new Guardian server was finished.
I'll be probably able to migrate the new server in next time.
-----
All user codes in userapps/release/*/{k1,common}/guardian/*.py were checked on the new environment.
- Some minor fixes in SyntaxError/Warning in Python3.13 were applied.
- Some missing packages/modules were newly installed on the new server.
- VIS_* Guardians were able to reach LOCK_ACQUISITION state.
- IO guardian was able to reach PROVIDING_STABLE_LIGHT state.
- Guardian nodes not directly related to IFO control e.g. SYS_* worked fine.
Hopefully, the Guardian server will be able to be migrated to the new system in next time
BTW, don't leave unnecessary codes in userapps/release/*/{k1,common}/guardian/.
Especially, don't put LIGO's user codes in {k1,common}.
Make {l1,h1} directory and put there, if you need LIGO's code as a reference.
I lost few hours to run common/guardian/OMC_LOCK.py which seems old H1 OMC guardian code.
Additional unnecessary packages to operate it became not to be removed from the new system due to dependency hell.
Maybe it's easier to re-install OS than to solve dependency hell for cleaning up unnecessary settings.
It's just an only reason why I couldn't complete the Guardian server migration today.