Reports 1-1 of 1 Clear search Modify search
ISC (General)
shun.saito - 15:44 Tuesday 18 August 2026 (37369) Print this report
Improving the sub-laser alignment for the PRCL/SRCL measurements

[Tanaka, Fujimoto, Saito]

The height of the lens was adjusted so that the main-laser beam passed through its center, addressing the issue reported in klog:37116. Accordingly, the height of one mirror and one BS was also adjusted. The main-laser beam profile was then measured, and the resulting mode-matching ratio relative to the beam before the lens adjustment was approximately 89%. Therefore, it is considered unnecessary to redo the mode matching. The next step will be to align the sub-laser.
 

  • The lens height was adjusted so that the main-laser beam passed through the center of the lens, resolving the issue reported in klog:37116. After this adjustment, the beam was found to strike the lower part of the downstream mirror, so the mirror height was adjusted accordingly. The height of the downstream BS was then adjusted to maintain the beam path.
     
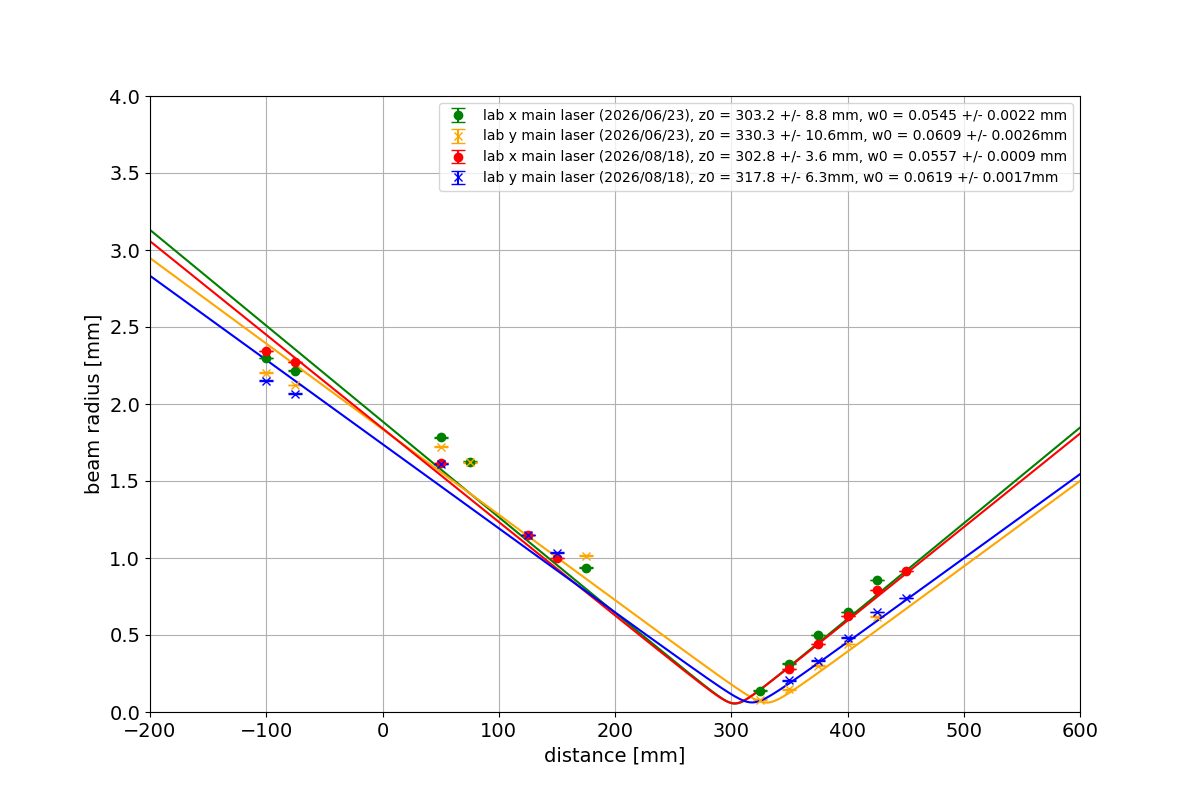
  • Next, the main-laser beam profile was measured and fitted (Fig. 1). The green and yellow curves show the previous results (klog:37116), while the red and blue curves show the current results. The origin is defined as the position of the mirror immediately after the BS where the sub-laser beam enters toward the interferometer. The fitted waist positions and waist radii are as follows.

    Previous (klog:37116)

    x-direction: waist position = 303.2 ± 8.8 mm, waist radius = 0.0545 ± 0.0022 mm
    y-direction: waist position = 330.3 ± 10.6 mm, waist radius = 0.0609 ± 0.0026 mm
    →Average: waist position = 317 mm, waist radius = 0.058 mm

    Current

    x-direction: waist position = 302.8 ± 3.6 mm, waist radius = 0.0557 ± 0.0009 mm
    y-direction: waist position = 317.8 ± 6.3 mm, waist radius = 0.0619 ± 0.0017 mm
    →Average: waist position = 310 mm, waist radius = 0.059 mm

    The mode-matching ratio between these two beam profiles is approximately 89%. Therefore, it is considered unnecessary to redo the mode matching. The next step will be to align the sub-laser.

Images attached to this report
Comments to this report:
shun.saito - 1:19 Thursday 20 August 2026 (37381) Print this report

[Tanaka, Fujimoto, Saito]

After aligning the sub-laser, the single-pass beam profile became much cleaner than before the lens-height adjustment (Fig. 1 in klog:37121). The SRX and SRY lengths were then measured following the same procedure as in klog:37260. The deviations from the design values were found to be −3.01(18) cm for SRX and −3.516(42) cm for SRY. Compared with the results of klog:37250 and klog:37260, namely 2.80(13) cm for SRX and 1.757(50) cm for SRY, the differences are -3.01(18) cm-2.80(13) cm=−5.81(22) cm for SRX and -3.516(42) cm-1.757(50) cm−5.273(65) cm for SRY, indicating a significant discrepancy. The cause is currently unknown. In addition, the maximum beat-signal amplitude was only about 1 mV, whereas it had been about 4 mV in klog:37250 and klog:37260, suggesting that the mode-matching ratio may have degraded. Using the same procedure as in klog:37260, the SRC length and Schnupp asymmetry were also calculated, yielding 66.55867(92) m and 3.33486(185) m, respectively. Compared with the klog:37260 results of 66.61409(70) m for SRC and 3.34023(139) m for the Schnupp asymmetry derived from SRC, the differences are 66.55867(92) m-66.61409(70) m=−5.54(12) cm for SRC and 3.33486(185)m-3.34023(139)m=0.537(231) cm for the Schnupp asymmetry, indicating that the SRC result also differs significantly.
 

  • First, the irises were repositioned so that the sub-laser alignment could be performed using only the sub-laser beam. Two irises were installed between the lens and the mirror whose heights had been adjusted in klog:37369, with the largest possible separation, and the main-laser beam was centered through both irises. SRY was then locked, and the main laser was turned off. Next, the sub-laser PZT was driven with a 10 Hz, 4 Vpp triangular waveform, and the sub-laser alignment was adjusted using the mirror and BS while monitoring the OMC REFL DC PD signal. When the beam was centered through both irises, the OMC REFL DC PD signal changed, so the alignment was further optimized to maximize the signal. After misaligning the SRM and observing the OMC REFL camera, the beam profile appeared as shown in Fig. 1. Before the lens-height adjustment, the mode had been horizontally elongated, as shown in Fig. 1 of klog:37121, whereas it became nearly circular after the adjustment.
     
  • The main laser was then turned on, and SRY was measured following the same procedure as in klog:37260. The sub-laser PZT was driven with a 0.3 Hz, 4 Vpp triangular waveform, and the spectrum analyzer's Max Hold function was used to acquire transmitted-power data as a function of frequency near beat frequencies of 1.6 GHz (Fig. 2), 800 MHz (Fig. 3), −800 MHz (Fig. 4), and −1.6 GHz (Fig. 5). Negative frequencies indicate that the sub-laser frequency was lower than the main-laser frequency.


  • The same procedure was then attempted for SRX. However, near 1.6 GHz, the beat signal exhibited two clearly separated peaks (Fig. 6). The sub-laser alignment was therefore readjusted (Fig. 7), but little improvement was observed, suggesting that higher-order modes of the main laser may be affecting the measurement. Data were then acquired near beat frequencies of 1.6 GHz (Fig. 8), 800 MHz (Fig. 9), −800 MHz (Fig. 10), and −1.6 GHz (Fig. 11). Figures 8–11 also suggest that the relative heights of the two peaks vary with the beat frequency.
     
  • The measured peaks were fitted both with and without a linear background. The fitting results for the individual peaks will be posted separately. From the fitted peak frequencies and their uncertainties, the minimum and maximum frequencies within the uncertainty range were determined, and the overall uncertainty was defined as the combined range from both fitting methods. The following frequency ranges were then used to determine the SRX and SRY lengths.

    SRX
    Minimum (MHz) Maximum (MHz)
    1625.3644  1625.4925
    806.5704   806.6633
    -782.6801  -782.5577
    -1603.6842 -1603.5300

    SRY

    Minimum (MHz) Maximum (MHz)
    1630.4411  1630.5146
    824.9937   825.0215
    -834.3554  -834.3158
    -1600.5609 -1600.5409

    The midpoint of each frequency range was divided by the FSR calculated from the design lengths of 68.2562 m for SRX and 64.9264 m for SRY. The resulting values were rounded to the nearest integers, and the measured frequencies were fitted with the function AN+B where A and B are fitting parameters and N is an integer. The fitting results are:

    SRX (Fig. 12)
    A: 2.197053(57) MHz
    B: −0.036(30) MHz

    SRY (Fig. 13)
    A: 2.309961(15) MHz
    B: 0.1600(86) MHz

    Since A corresponds to the FSR, the cavity lengths are:

    SRX
    Fitted length: 68.2261(18) m
    Design length: 68.2562 m
    Difference (fitted − design): −3.01(18) cm

    SRY
    Fitted length: 64.89124(42) m
    Design length: 64.9264 m
    Difference (fitted − design): −3.516(42) cm

    Compared with the klog:37250 and klog:37260 results of 2.80(13) cm for SRX and 1.757(50) cm for SRY, the differences are:

    SRX: -3.01(18) cm - 2.80(13) cm = −5.81(22) cm
    SRY: -3.516(42) cm - 1.757(50) cm = −5.273(65) cm

    These discrepancies are substantial, and their cause remains unknown. Furthermore, the maximum beat-signal amplitude was only about 1 mV, compared with about 4 mV in the previous measurements(klog:37250, klog:37260), suggesting that the mode-matching ratio may have decreased.
     

  • Using these results, the SRC length and Schnupp asymmetry were calculated following the same procedure as in klog:37260.

    SRC
    Calculated length: 66.55867(92) m
    Design length: 66.5913 m
    Difference (calculated − design): −3.263(92) cm

    Schnupp asymmetry
    Value derived from SRC: 3.33486(185) m
    Design value: 3.3298 m
    Difference (derived − design): 0.506(185) cm

    Compared with the klog:37260 results of 66.61409(70) m for SRC and 3.34023(139) m for the Schnupp asymmetry derived from SRC, the differences are:

    SRC: 66.55867(92) m - 66.61409(70) m = −5.54(12) cm

    Schnupp asymmetry derived from SRC: 3.33486(185) m - 3.34023(139) m = 0.537(231) cm

    Thus, the SRC result also differs significantly from the previous measurement.

Images attached to this comment
Hiroki Fujimoto - 3:53 Thursday 20 August 2026 (37384) Print this report

Saito-kun reported today’s SRX/SRY length measurement yielded an unexpected result.
So I independently performed a cross-check of the SRX data analysis and obtained a result which is consistent with the previous measurement.

Fig. 1 shows the FSR index vs. beat frequency plot for today’s SRX measurement, obtained by applying the today's measurement data to the analysis code that I previously used (klog #37184).

The fitted SRX lengths are

  • L_SRX_measured (my code) = 68.2862(18) m
  • L_SRX_measured (Saito-kun's code) = 68.2261(18) m

For comparison,

  • L_SRX_measured (previous measurement: klog #37260) = 68.2842(13) m
  • L_SRX_design = 68.2562 m

The result obtained with my code is consistent with the previous measurement, and this suggests that there may be an issue with Saito-kun’s analysis code.
We would like to discuss this tomorrow.

Images attached to this comment
shun.saito - 5:43 Thursday 20 August 2026 (37386) Print this report

The fitting results for the individual SRX and SRY peaks in klog:37381 are shown below. The measurement data are stored in:
SRX: Dropbox → All files/Dropbox KAGRA/Measurements/IFO/SRCL/SRCL_OMC_REFL_beat_signal_PZT_sweep/2026_08_19_SRX
SRY: Dropbox → All files/Dropbox KAGRA/Measurements/IFO/SRCL/SRCL_OMC_REFL_beat_signal_PZT_sweep/2026_08_19_SRY
 

  • SRX
    Fig. 1: Around 1.6 GHz, without a linear background. Using data from 1624.5 MHz to 1626 MHz, the fitted peak frequency is 1625.482(10) MHz.
    Fig. 2: Around 1.6 GHz, with a linear background. Using data from 1624.5 MHz to 1626 MHz, the fitted peak frequency is 1625.392(27) MHz.

    Fig. 3: Around 800 MHz, without a linear background. Using data from 805.8 MHz to 807.6 MHz, the fitted peak frequency is 806.6576(56) MHz.
    Fig. 4: Around 800 MHz, with a linear background. Using data from 805.8 MHz to 807.6 MHz, the fitted peak frequency is 806.583(13) MHz.

    Fig. 5: Around −800 MHz, without a linear background. Using data from 781.4 MHz to 783.5 MHz, the fitted peak frequency is 782.5641(65) MHz.
    Fig. 6: Around −800 MHz, with a linear background. Using data from 781.4 MHz to 783.5 MHz, the fitted peak frequency is 782.669(11) MHz.

    Fig. 7: Around −1.6 GHz, without a linear background. Using data from 1602.5 MHz to 1604.4 MHz, the fitted peak frequency is 1603.5358(58) MHz.
    Fig. 8: Around −1.6 GHz, with a linear background. Using data from 1602.5 MHz to 1604.4 MHz, the fitted peak frequency is 1603.670(14) MHz.
     

  • SRY
    Fig. 9: Around 1.6 GHz, without a linear background. Using data from 1629.5 MHz to 1631.5 MHz, the fitted peak frequency is 1630.4461(51) MHz.
    Fig. 10: Around 1.6 GHz, with a linear background. Using data from 1629.5 MHz to 1631.5 MHz, the fitted peak frequency is 1630.5078(68) MHz.

    Fig. 11: Around 800 MHz, without a linear background. Using data from 824 MHz to 825.8 MHz, the fitted peak frequency is 825.0175(40) MHz.
    Fig. 12: Around 800 MHz, with a linear background. Using data from 824 MHz to 825.8 MHz, the fitted peak frequency is 825.0011(74) MHz.

    Fig. 13: Around −800 MHz, without a linear background. Using data from 833.3 MHz to 835.3 MHz, the fitted peak frequency is 834.3511(42) MHz.
    Fig. 14: Around −800 MHz, with a linear background. Using data from 833.3 MHz to 835.3 MHz, the fitted peak frequency is 834.3217(59) MHz.

    Fig. 15: Around −1.6 GHz, without a linear background. Using data from 1599.75 MHz to 1601.5 MHz, the fitted peak frequency is 1600.5574(35) MHz.
    Fig. 16: Around −1.6 GHz, with a linear background. Using data from 1599.75 MHz to 1601.5 MHz, the fitted peak frequency is 1600.5458(49) MHz.

Images attached to this comment
shun.saito - 22:48 Thursday 20 August 2026 (37393) Print this report

Following Fujimoto-san's result in klog:37384, the FSR index assignment was changed to a method based on the frequency differences between the measured resonance peaks. With this revised method, the deviations from the design values became 3.01(18) cm for SRX and 2.385(42) cm for SRY. Compared with the results of klog:37250 and klog:37260, namely 2.80(13) cm for SRX and 1.757(50) cm for SRY, the SRX result is considered consistent, while the SRY result is closer than the previous value reported in klog:37381 but still shows a small discrepancy. Using the same procedure as in klog:37381, the SRC length and Schnupp asymmetry derived from SRC were also calculated, yielding 66.61828(92) m and 3.33605(185) m, respectively. Compared with the klog:37260 results of 66.61409(70) m for SRC and 3.34023(139) m for the Schnupp asymmetry derived from SRC, the agreement improved relative to klog:37381, although small differences remain. Furthermore, the beat frequency closest to 0 Hz, as obtained from the fitting results, was found to be approximately four times larger than that obtained in klog:37250 and klog:37260. Since this value should ideally be 0 Hz, the larger offset observed here is unexpected, and its cause is currently unknown.
 

  • Following Fujimoto-san's result in klog:37384, the FSR index assignment was revised. The peak near −1.6 GHz was assigned an FSR index of 0, and the frequency difference between adjacent peaks was divided by the design FSR. The resulting values were rounded to the nearest integer to assign the FSR indices. The measured frequencies were then fitted with AN+B where A and B are fitting parameters and N is the FSR index. The fitting results are as follows.

    SRX (Fig. 1)
    A: 2.195115(57) MHz
    B: −1603.604(57) MHz

    SRY (Fig. 2)
    A: 2.307862(15) MHz
    B: −1600.5506(94) MHz

    Since A corresponds to the FSR, the cavity lengths become:

    SRX
    Fitted length: 68.2863(18) m
    Design length: 68.2562 m
    Difference (fitted − design): 3.01(18) cm

    SRY
    Fitted length: 64.95025(42) m
    Design length: 64.9264 m
    Difference (fitted − design): 2.385(42) cm

    Compared with the klog:37250 and klog:37260 results of 2.80(13) cm for SRX and 1.757(50) cm for SRY, the SRX result is considered consistent. The SRY result is closer than the value reported in klog:37381, although a small discrepancy remains.
     

  • Using these results, the SRC length and Schnupp asymmetry were calculated following the same procedure as in klog:37381.

    SRC
    Calculated length: 66.61828(92) m
    Design length: 66.5913 m
    Difference (calculated − design): 2.698(92) cm

    Schnupp asymmetry
    Value derived from SRC: 3.33605(185) m
    Design value: 3.3298 m
    Difference (derived − design): 0.625(185) cm

    Compared with the klog:37260 results of 66.61409(70) m for SRC and 3.34023(139) m for the Schnupp asymmetry derived from SRC, these values are closer than those reported in klog:37381, although small differences remain.
     

  • In addition, in the previous fitting (klog:37381), adding +1 to the FSR indices of the two positive-frequency peaks, or subtracting 1 from the FSR indices of the two negative-frequency peaks, reproduces the same results obtained here. This indicates that the FSR indices of two resonance peaks had been assigned incorrectly for both SRX and SRY in the previous analysis.
     

  • Following this revision, the analyses in klog:37250 and klog:37260 were also rechecked. No changes were found in any of those measurement results, indicating that the FSR indices used in klog:37250 and klog:37260 had been assigned correctly.
     

  • Finally, the beat frequency closest to 0 Hz was calculated from the fitting results for both the present analysis and the results of klog:37250 and klog:37260, yielding the following values.

    Present results
    SRX:1.025065 MHz
    SRY:1.105628 MHz

    klog:37250 and klog:37260
    SRX:0.25572 MHz
    SRY:0.24769 MHz
    PRX:−0.034825 MHz
    PRY:−0.042492 MHz

    Ideally, these beat frequencies should be 0 Hz, but the offsets in the present measurements are substantially larger. The reason for this discrepancy remains unknown.
     

Images attached to this comment
Search Help
×

Warning

×