[Smith, Tanaka, Hirose, Fujimoto, Saito]
The sub-laser beam was aligned to the main laser beam, and after blocking the main laser, SRY fringes were observed using the OMC REFL PD. The alignment was optimized using two mirrors to maximize the fringe amplitude. The measured FSR was approximately 2.3 MHz. Since this value is very close to the expected FSR, we conclude that the observed signal corresponds to SRY fringes. Measurements of the main laser and sub-laser beam profiles showed that the beam waist positions differed by approximately 65 mm. Therefore, a beam profiler was placed at the main laser waist position, and the positions of the two lenses were adjusted so that the sub-laser beam waist would be located there. After blocking the main laser again and observing the SRY fringes with the OMC REFL PD, the alignment was optimized using two mirrors. As a result, the fringe amplitude increased to approximately 1.3 μW. However, the mode shape was not circular. In addition, both the main laser and sub-laser beams were found to be incident on the lower part of a lens that had originally been installed in the optical path. Next time, we plan to further adjust the positions of the two lenses to determine whether the fringe amplitude can be increased. We are also considering adjusting the height of the existing lens so that the beams pass through its center.
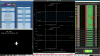
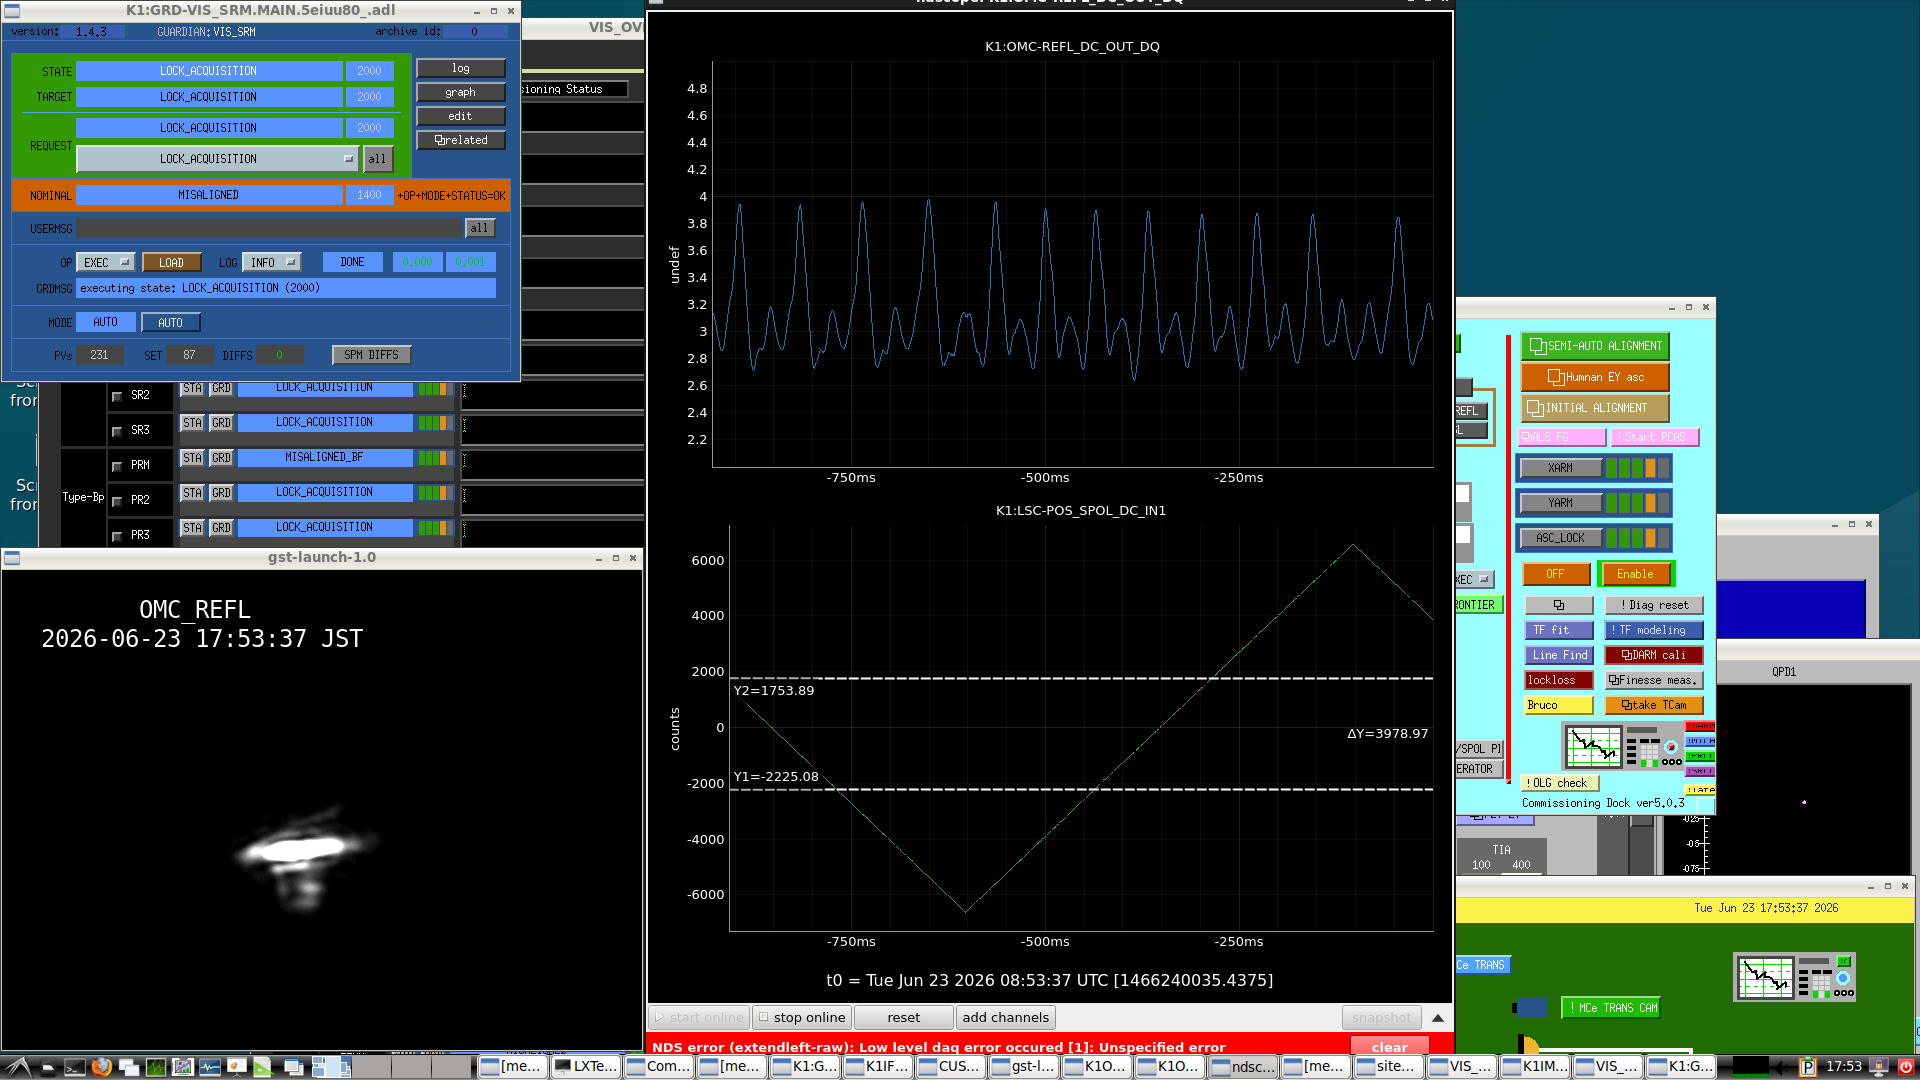
- First, the alignment was performed using two irises. After blocking the main-laser beam, SRY fringes were observed using the OMC REFL PD. The alignment was then optimized using two mirrors to maximize the fringe amplitude (Fig. 1). The sub-laser PZT was driven with an 8 Vpp triangular waveform. In Fig. 1, the upper trace of the ndscope display shows the OMC REFL PD signal, while the lower trace shows the signal applied to the PZT. From the plot, an 8 V change corresponds to approximately 6.5 FSR. Since the PZT efficiency of the sub-laser measured at Kashiwa was 1.871 MHz/V, the FSR is estimated as FSR=(1.871 MHz/V)×(8 V)/6.5=2.3 MHz. Because this value agrees well with the expected FSR, we conclude that the observed signal is indeed the SRY fringe.
-
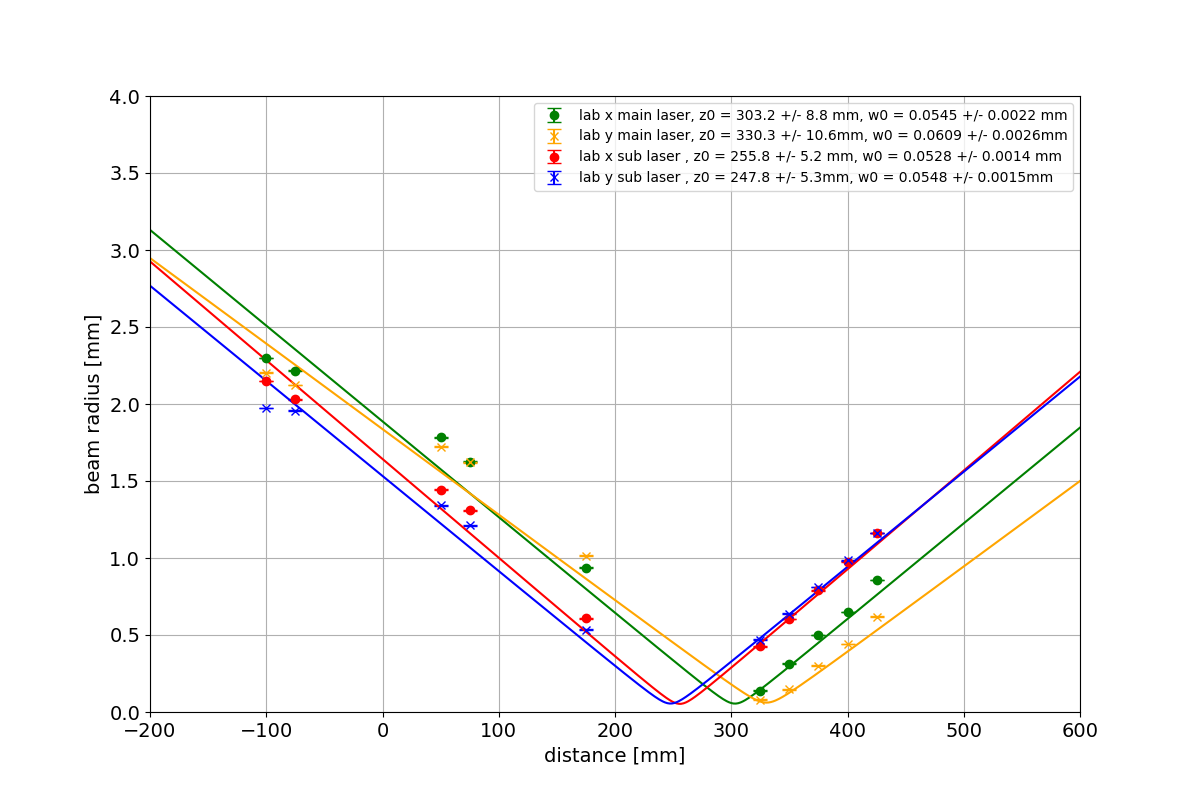
Next, the beam profiles of the main laser and sub-laser were measured to evaluate the mode matching. The sub-laser beam profile remained distorted, similar to what was observed previously (klog:37093). When the beam profile was examined from upstream toward the waist, the beam initially had a reasonably clean shape (Fig. 2), then gradually became distorted into a vortex-like pattern (Fig. 3), and finally returned to a cleaner shape near the waist region (Fig. 4). The measured beam profiles were then fitted (Fig. 5). The resulting waist positions and waist radii are listed below. The origin is defined as the position of the mirror immediately after the BS in the path through which the sub-laser enters the interferometer.
Main laser
x direction: Waist position = 303.2 ± 8.8 mm, Waist radius = 0.0545 ± 0.0022 mm
y direction: Waist position = 330.3 ± 10.6 mm, Waist radius = 0.0609 ± 0.0026 mm
→Average: Waist position = 317 mm, Waist radius = 0.058 mmSub-laser
x direction: Waist position = 255.8 ± 5.2 mm, Waist radius = 0.0528 ± 0.0014 mm
y direction: Waist position = 247.8 ± 5.3 mm, Waist radius = 0.0548 ± 0.0015 mm
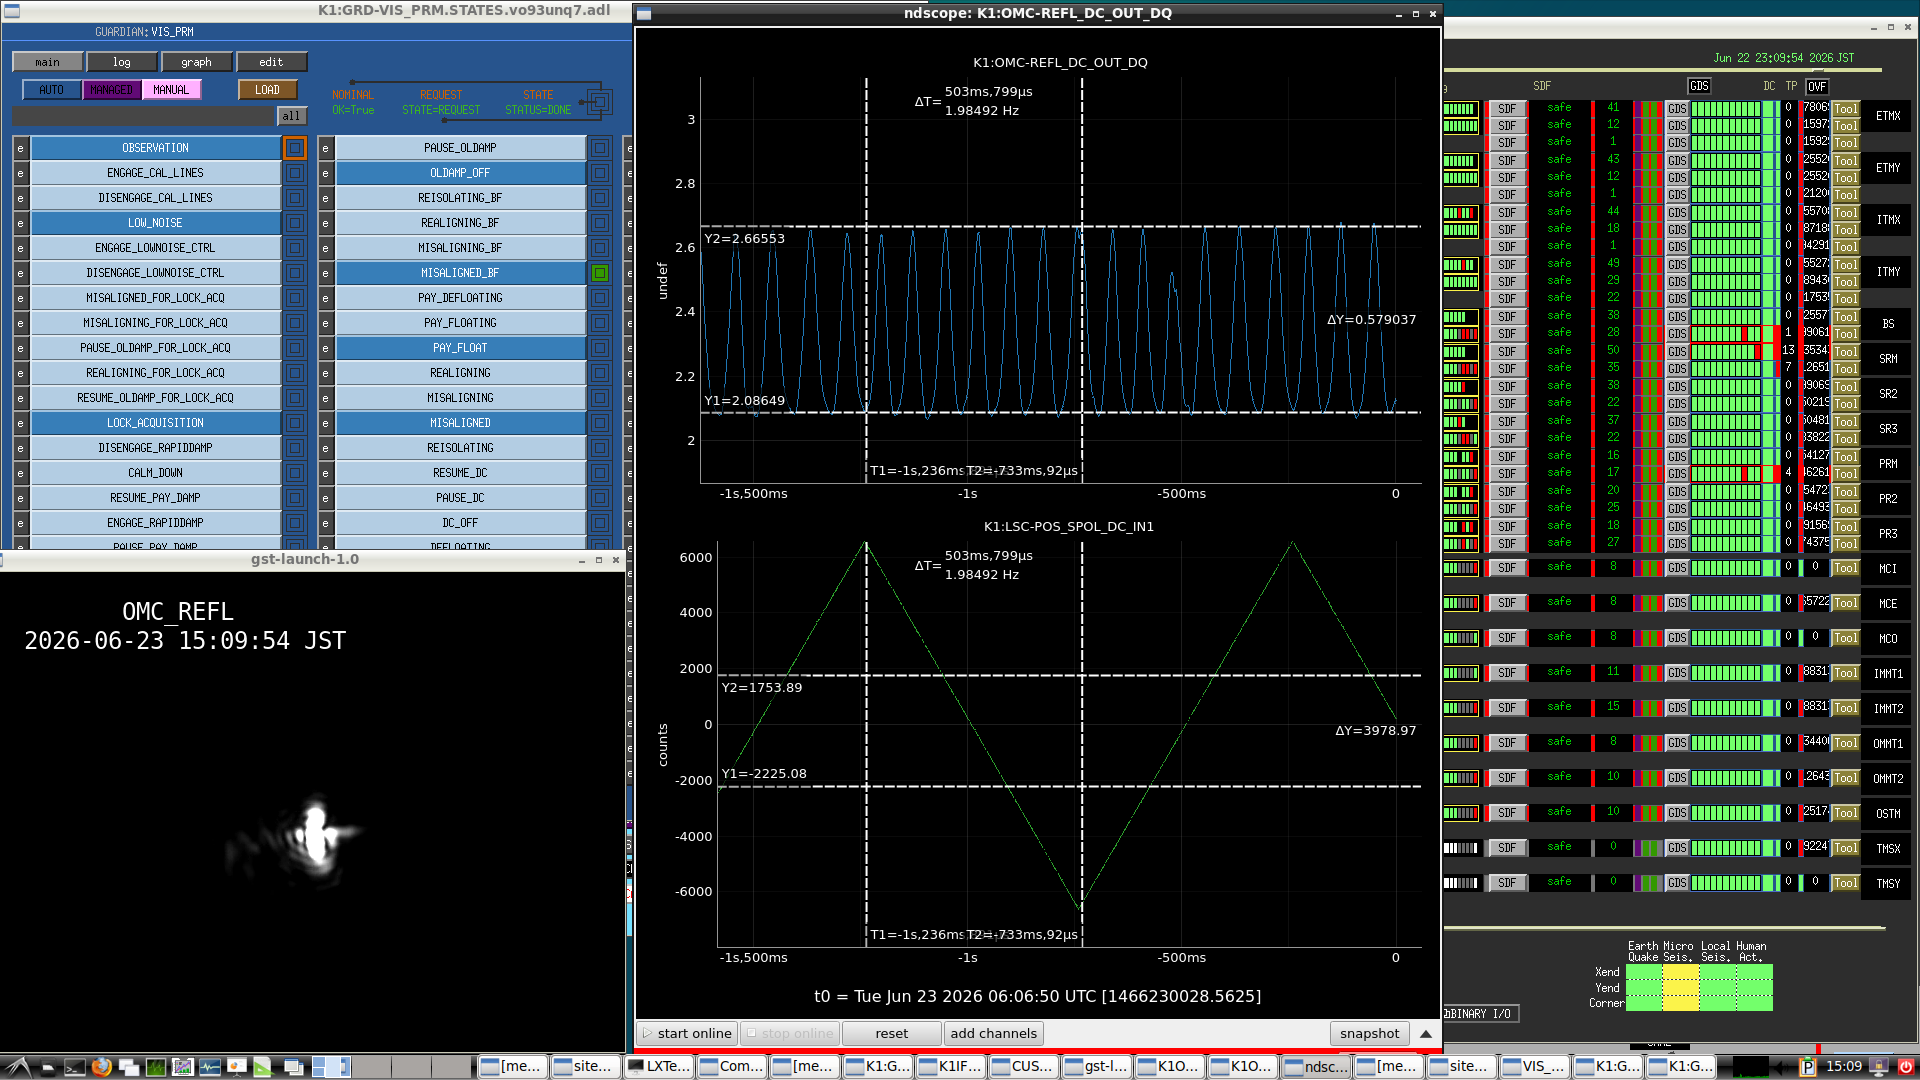
→Average: Waist position = 252 mm, Waist radius = 0.054 mmFrom these results, the mode-matching ratio was estimated to be approximately 7.5%. Since the waist positions differed by about 65 mm, the beam profiler was placed at the main laser waist position, and the positions of the 200 mm and 150 mm focal-length lenses were adjusted so that the sub-laser beam waist would coincide with that position. After blocking the main laser and observing the SRY fringes with the OMC REFL PD, the alignment was optimized again using two mirrors. The fringe amplitude became larger than that shown in Fig. 1 (Fig. 6), reaching approximately 1.3 μW. However, as shown in the camera image in the lower-left corner of Fig. 6, the mode shape was not circular. Therefore, next time we plan to further adjust the positions of the two lenses and investigate whether the fringe amplitude can be increased further.
-
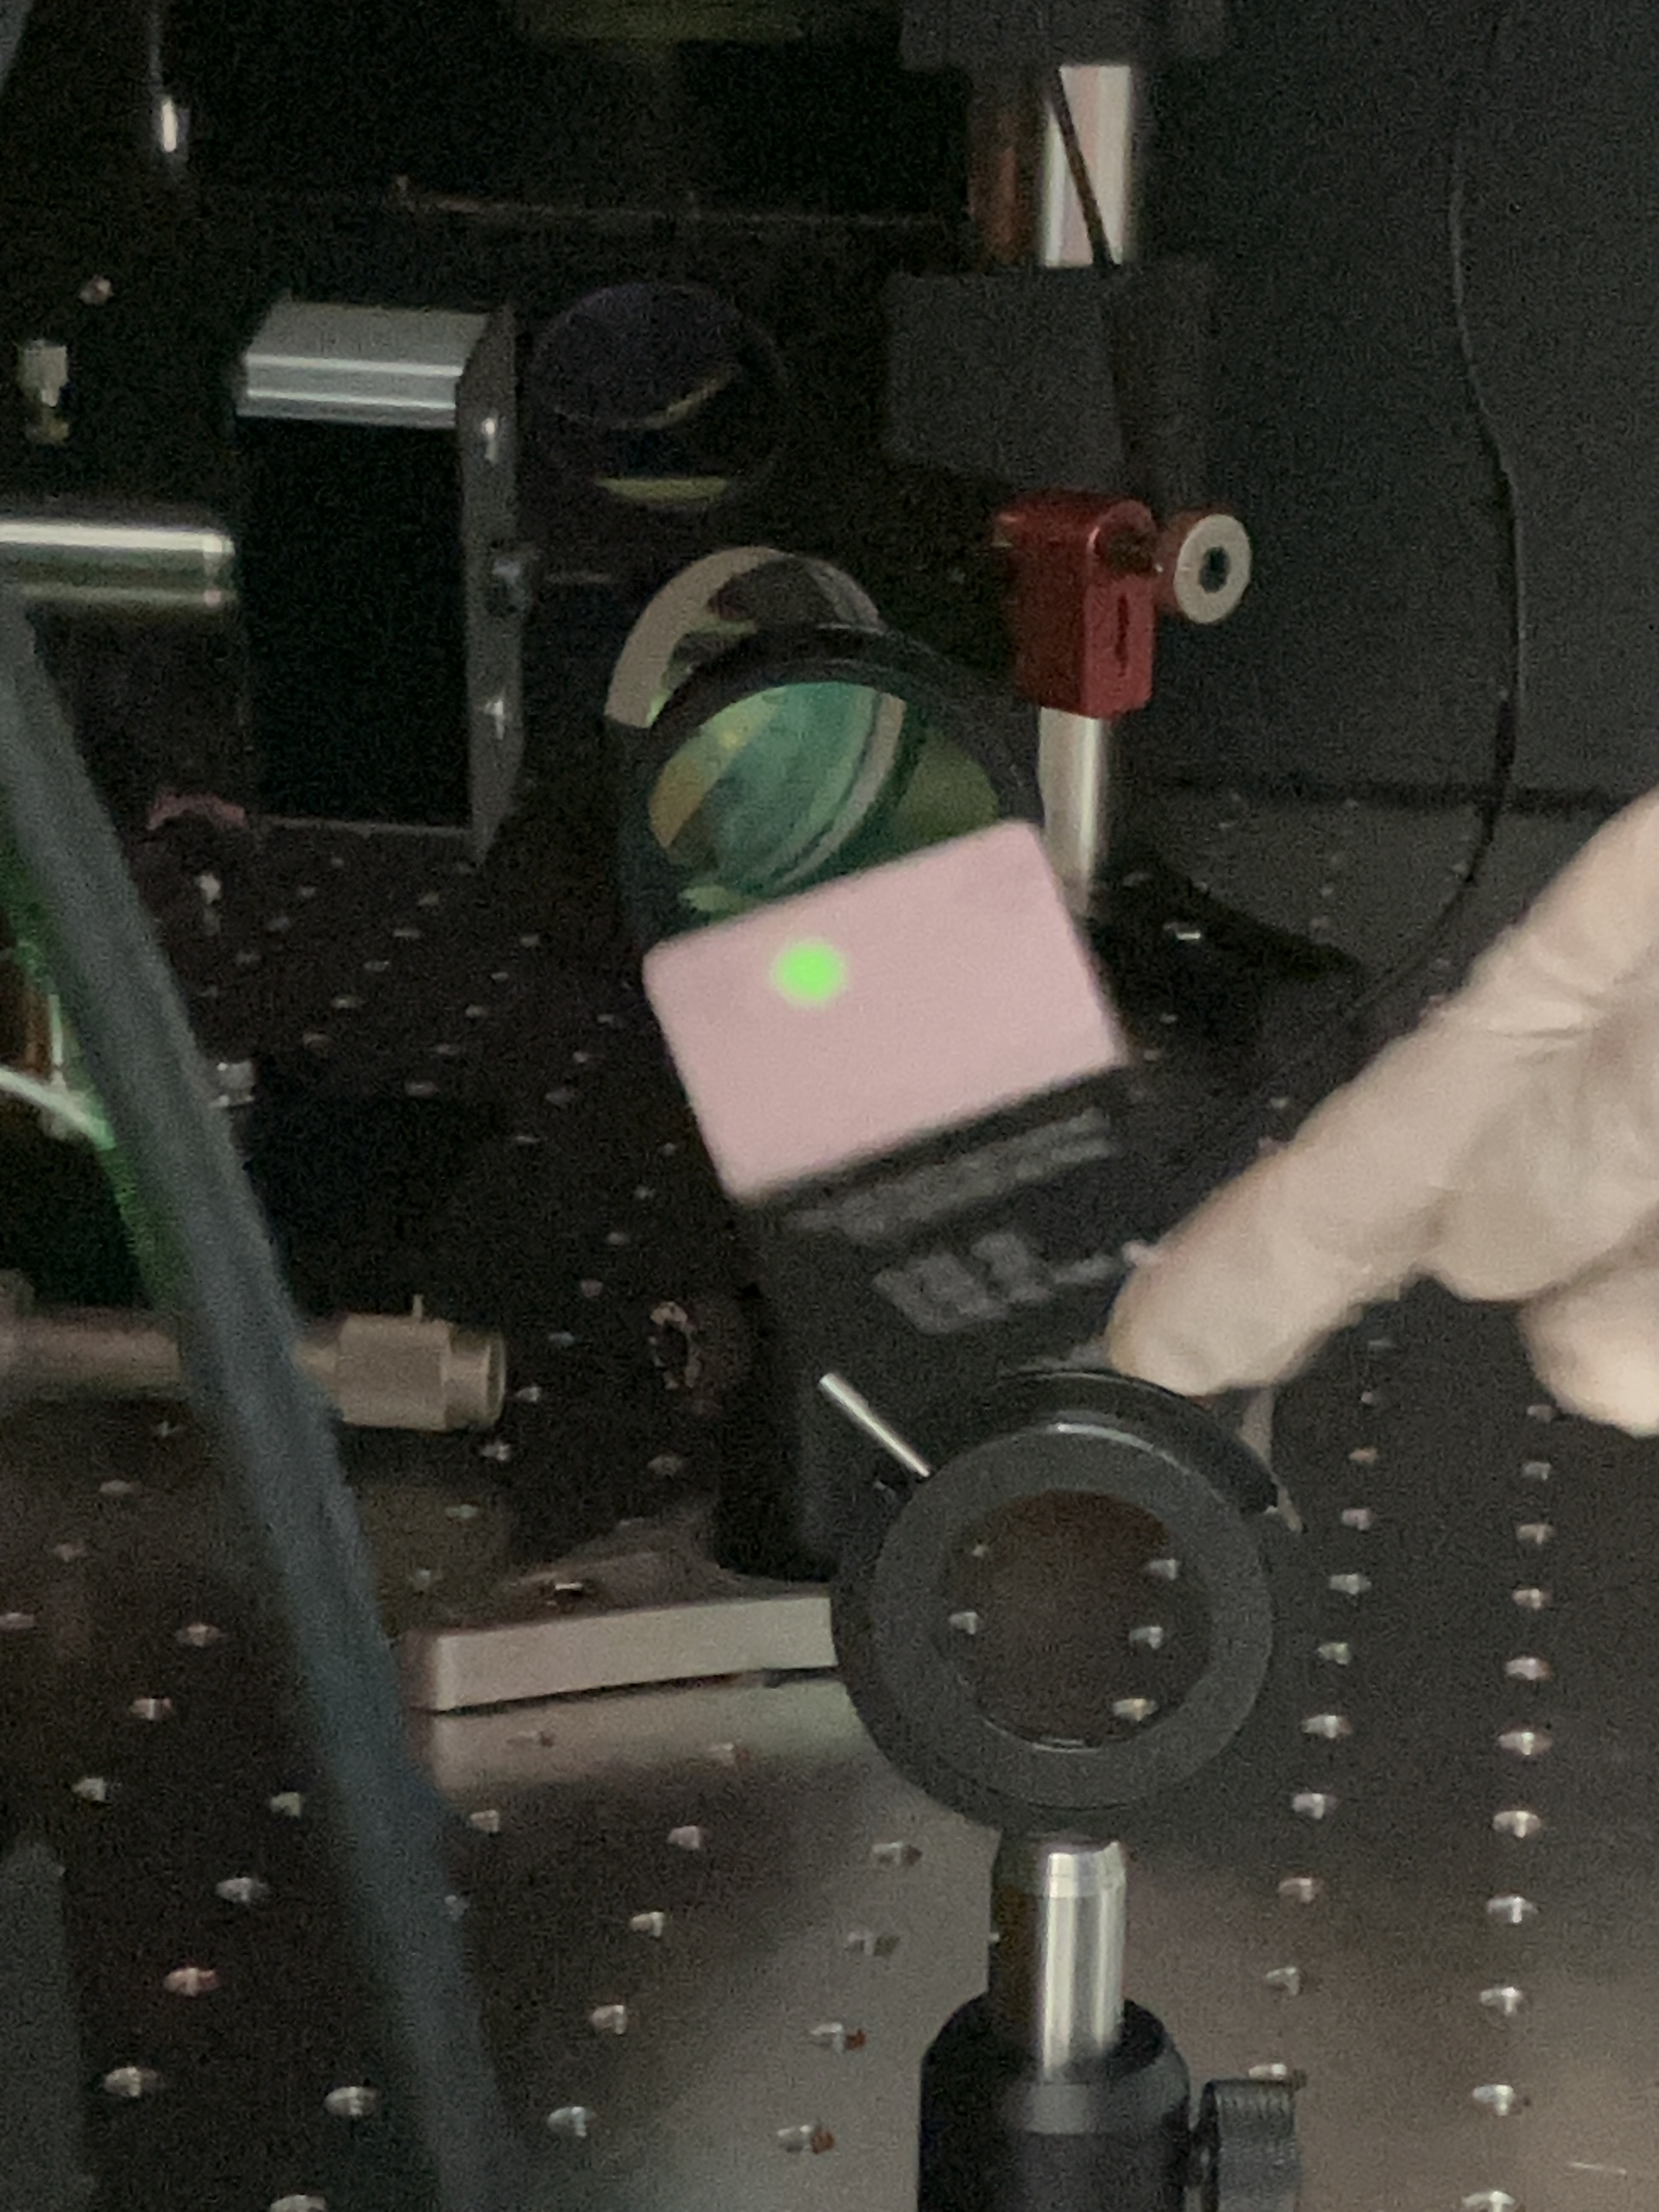
In addition, the position of the sub-laser beam was checked at the location of the lens that had originally been installed downstream of the iris. The beam was not passing through the center of the lens (Fig. 7). The same was true for the main laser beam. It is possible that the fact that the sub-laser beam enters the interferometer while passing through the lower part of the lens is affecting the observed performance.

