[Takano, Tanaka, Fujimoto]
Summary
We measured the carrier buildup factor (ratio of on-resonance to off-resonance power) and the carrier reduction factor (ratio of off-resonance to single-path power) for the four SRY transmission ports: REFL, POP, POS, and AS.
In particular, the measured carrier buildup factors were:
- Design value: 7.3
- REFL: 5.0
- POP: 1.3
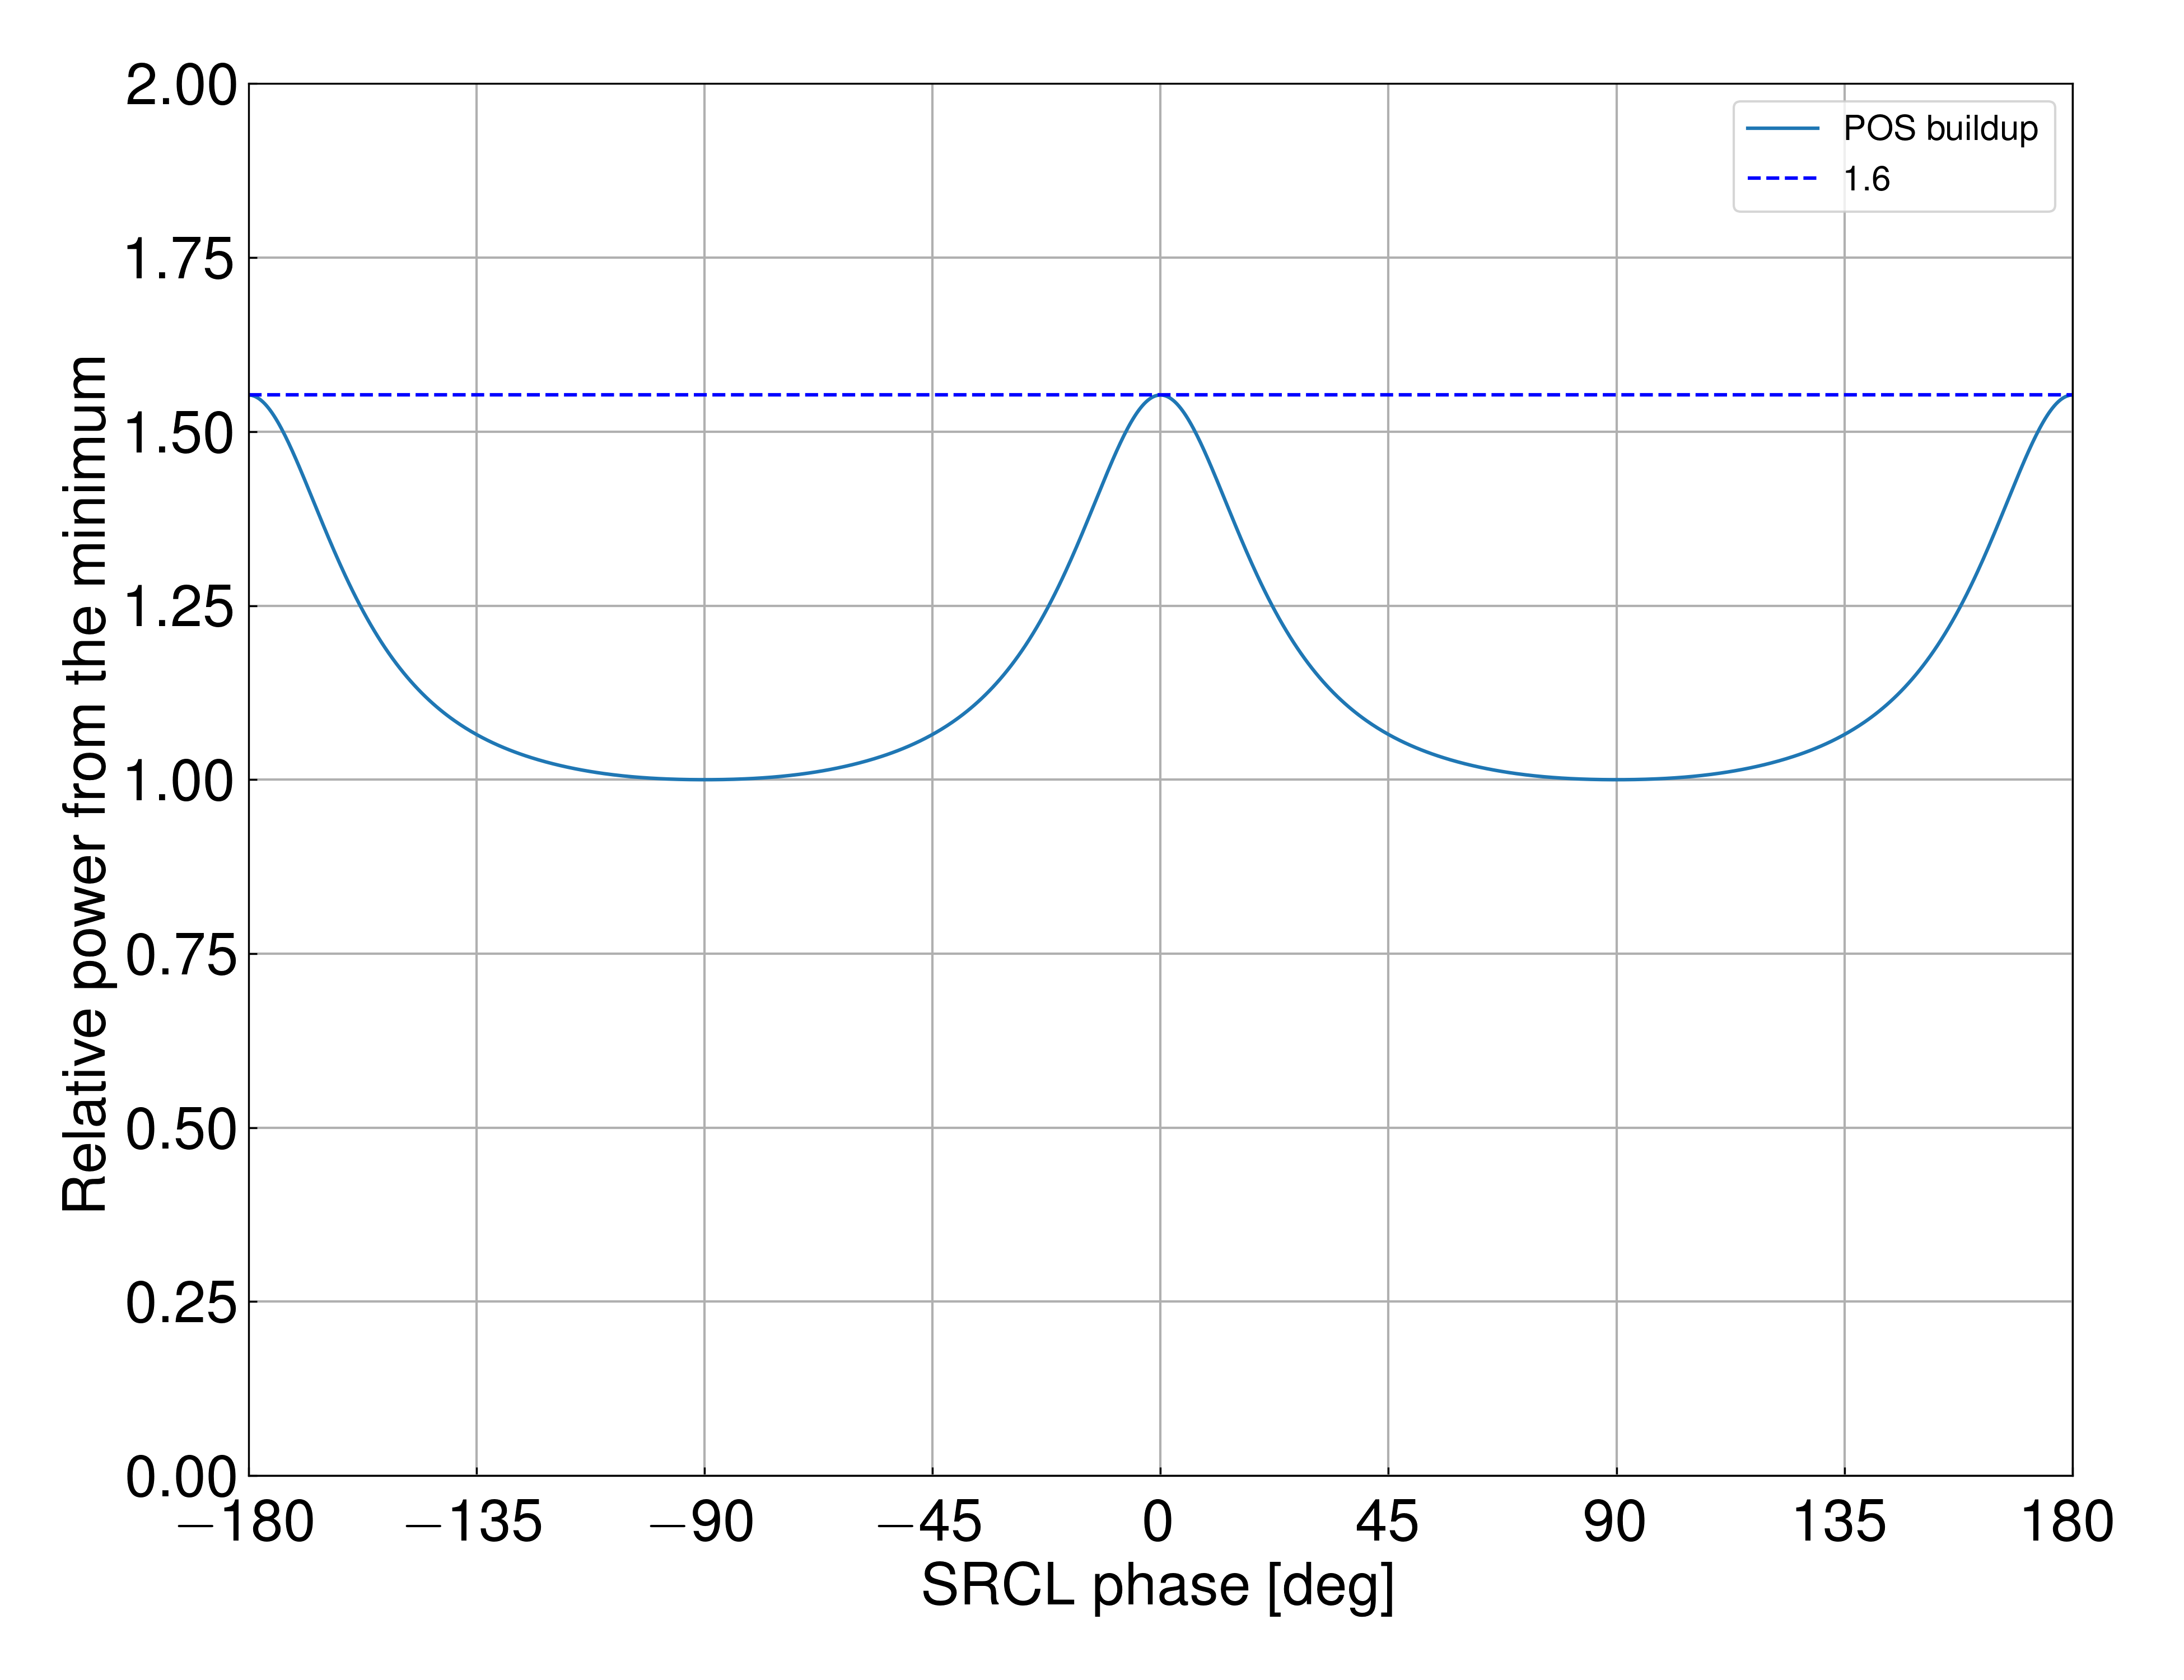
- POS: 1.6
- AS: 5.0
The REFL and AS values are somewhat lower than the design value, and POP and POS show significantly larger mismatches.
These mismatches could be caused by additional losses inside the SRY or optical offsets in the PD signals.
One possible origin is s-pol to p-pol conversion caused by birefringence in the ITMY substrate.
Details
As described in our previous klog (#36881), the true reflection port of the SRY is the port transmitted toward the ITMX side, while the interferometer REFL port acts as a transmission port for the SRY. Therefore, the currently available transmission ports for monitoring the SRY carrier buildup are REFL,POP, POS and AS.
For these ports, we performed:
-
Measurement of the carrier buildup factor (ratio of on-resonance to off-resonance)
-
Check for offsets in the PD outputs
-
Measurement of the carrier reduction factor (ratio of off-resonance to single-path)
We also discussed the discrepancies between the measured values and the design values.
Measurement of carrier buildup
Fig. 1 shows the DCPD time-series data for each transmission port (REFL, POP, POS, AS) of the freely swinging SRY.
From these data, the carrier buildup factor (ratio of resonant to non-resonant power) for each transmission port was obtained.
The measured values are:
- Carrier buildup factor:
- REFL: 5.0
- POP: 1.3
- POS: 1.6
- AS: 5.0
- Design value: 7.3 (considering R_{BS}=0.5, R_{IY}=0.996, R_{SRM}=0.85)
Check of PD offsets
Fig. 2 shows the PD outputs with the laser shutter closed and no laser injected into the interferometer.
The offsets of all PDs are nearly zero compared to the on-resonance and off-resonance signals, indicating that they do not contribute significantly to the underestimation of the carrier buildup factor.
Measurement of carrier reduction
Fig. 3 shows the time-series data when the SRM was misaligned and the carrier entered each transmission port (REFL, POP, POS, AS) through a single path.
The cursors in the figure indicate the on-resonance and off-resonance levels.
From these data, the carrier reduction factor (ratio of off-resonance to single-path power) for each transmission port was obtained.
- Measured carrier reduction factor:
- REFL: 0.55
- POS: ~1
- POP: ~1
- AS: 0.57
- Design value: 0.47
Discussion
First, the carrier buildup/reduction factors observed at AS and REFL are generally consistent with each other. However, they still show discrepancies from the design values.
One possible explanation is additional losses inside the SRY.
Additional loss decreases the carrier buildup factor while increasing the reduction factor, which is consistent with the observed trend.
Additional loss can be estimated from the measurement results as follows. The buildup factor b and reduction factor q are given by:
b = ((1+r)/(1-r))^2
q = 1/(1+r)^2
where r is the product of all amplitude reflectivities inside the cavity.
Using the measured values and these equations, the additional loss can be estimated.
However, for the AS results, the additional loss estimated from the buildup factor is 31%, and that estimated from the reduction factor is 50%, which seem too large and also are inconsistent with each other.
Therefore, the discrepancy from the design value cannot be explained solely by additional cavity loss.
Another possible explanation is some offset in the PD outputs.
From the present measurements, we confirmed that there is no significant PD offset when no laser is injected into the interferometer.
However, if there exists an offset that appears only when the laser is injected, it would lead to underestimation of the buildup factor and overestimation of the reduction factor.
As a possible source of such an offset, Tanaka-san pointed out p-pol. light generated by birefringence in the ITMY substrate.
The p-pol. light generated inside the SRY does not interfere with the main s-pol. carrier and can therefore appear as a PD offset.
Moreover, this p-pol. light directly enters the POS and POP ports, while it is rejected at AS and REFL by the OFI and IFI, respectively.
This could also explain why the mismatches observed at POS and POP are particularly large.
This hypothesis can be tested by placing PBSs at POS and POP to remove the p-polarized light and checking whether the buildup/reduction factors improve.
A similar effect should also appear in the PRY, so investigating the buildup/reduction factors at the PRY POS and POP ports may also be useful.


