Reports 1-1 of 1 Clear search Modify search
MIF (General)
tomotada.akutsu - 0:12 Tuesday 28 February 2023 (24187) Print this report
Projection of IMMT1T PIT onto DARM

Summary

Following 24177. It seems pitch jitter of the input beam would contribute to DARM now.

Details

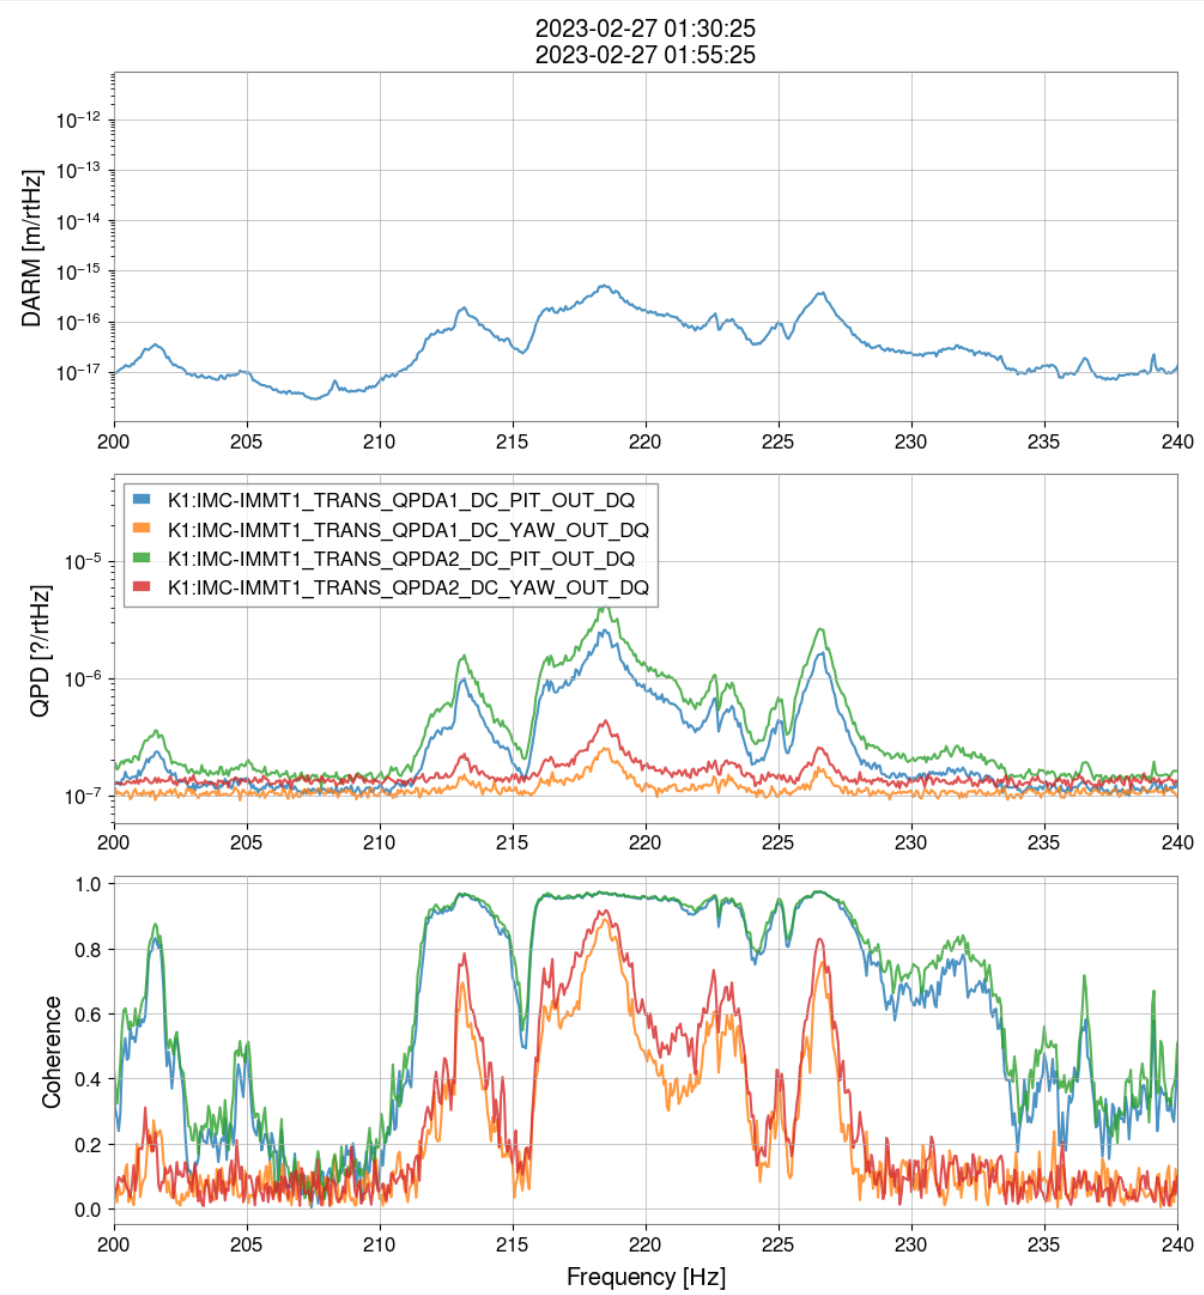
To check the assumption that the angular jitter of the light beam incident on the main interferometer would become noise in DARM somehow, I projected K1:IMC-IMMT1_TRANS_QPDA1_DC_PIT_OUT_DQ onto K1:CAL-CS_PROC_DARM_DISPLACEMENT_DQ. Firstly I tried to use pastavi noise budget mode but failed somehow (TF xml file was not reloaded...), so I just did it by hand.

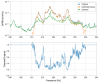
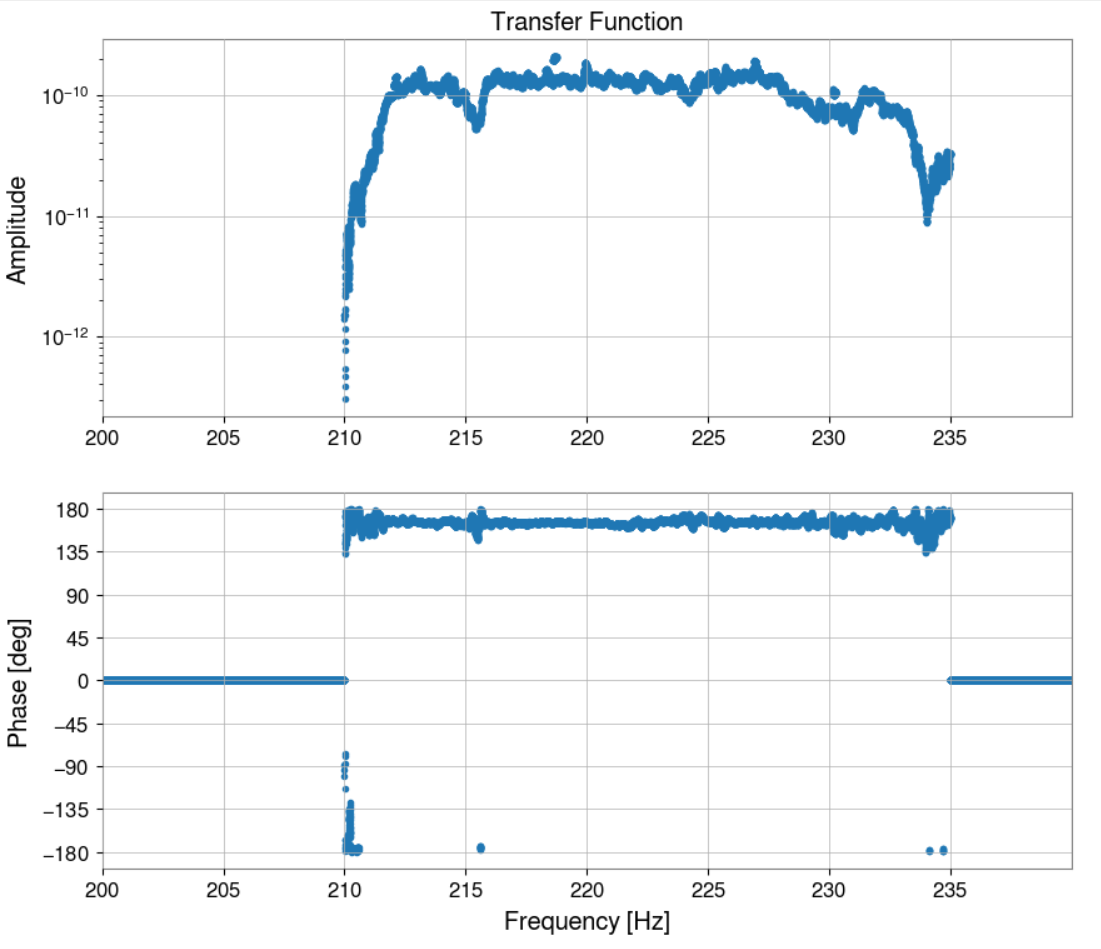
To estimate the transfer function from the beam jitter to DARM, I took advantage of the data when MCO to DARM transfer function was measured on 2023 Feb 14 JST. More specifically, ...Measurements/NoiseBudget/TFs/2023/0214/MCO_P_256.xml, where someone (Tamaki-kun?) shook MCO in pitch to measure transfer function from it to DARM. Fortunately IMMT1T QPDs were also recorded simultaneously in the same xml file, it is possible to re-construct the transfer function from IMMT1T pitch to DARM while shaking MCO in pitch, which would correspond to the situation that a certain level of beam jitter is being injected.

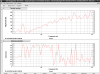
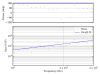
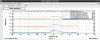
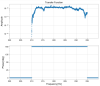
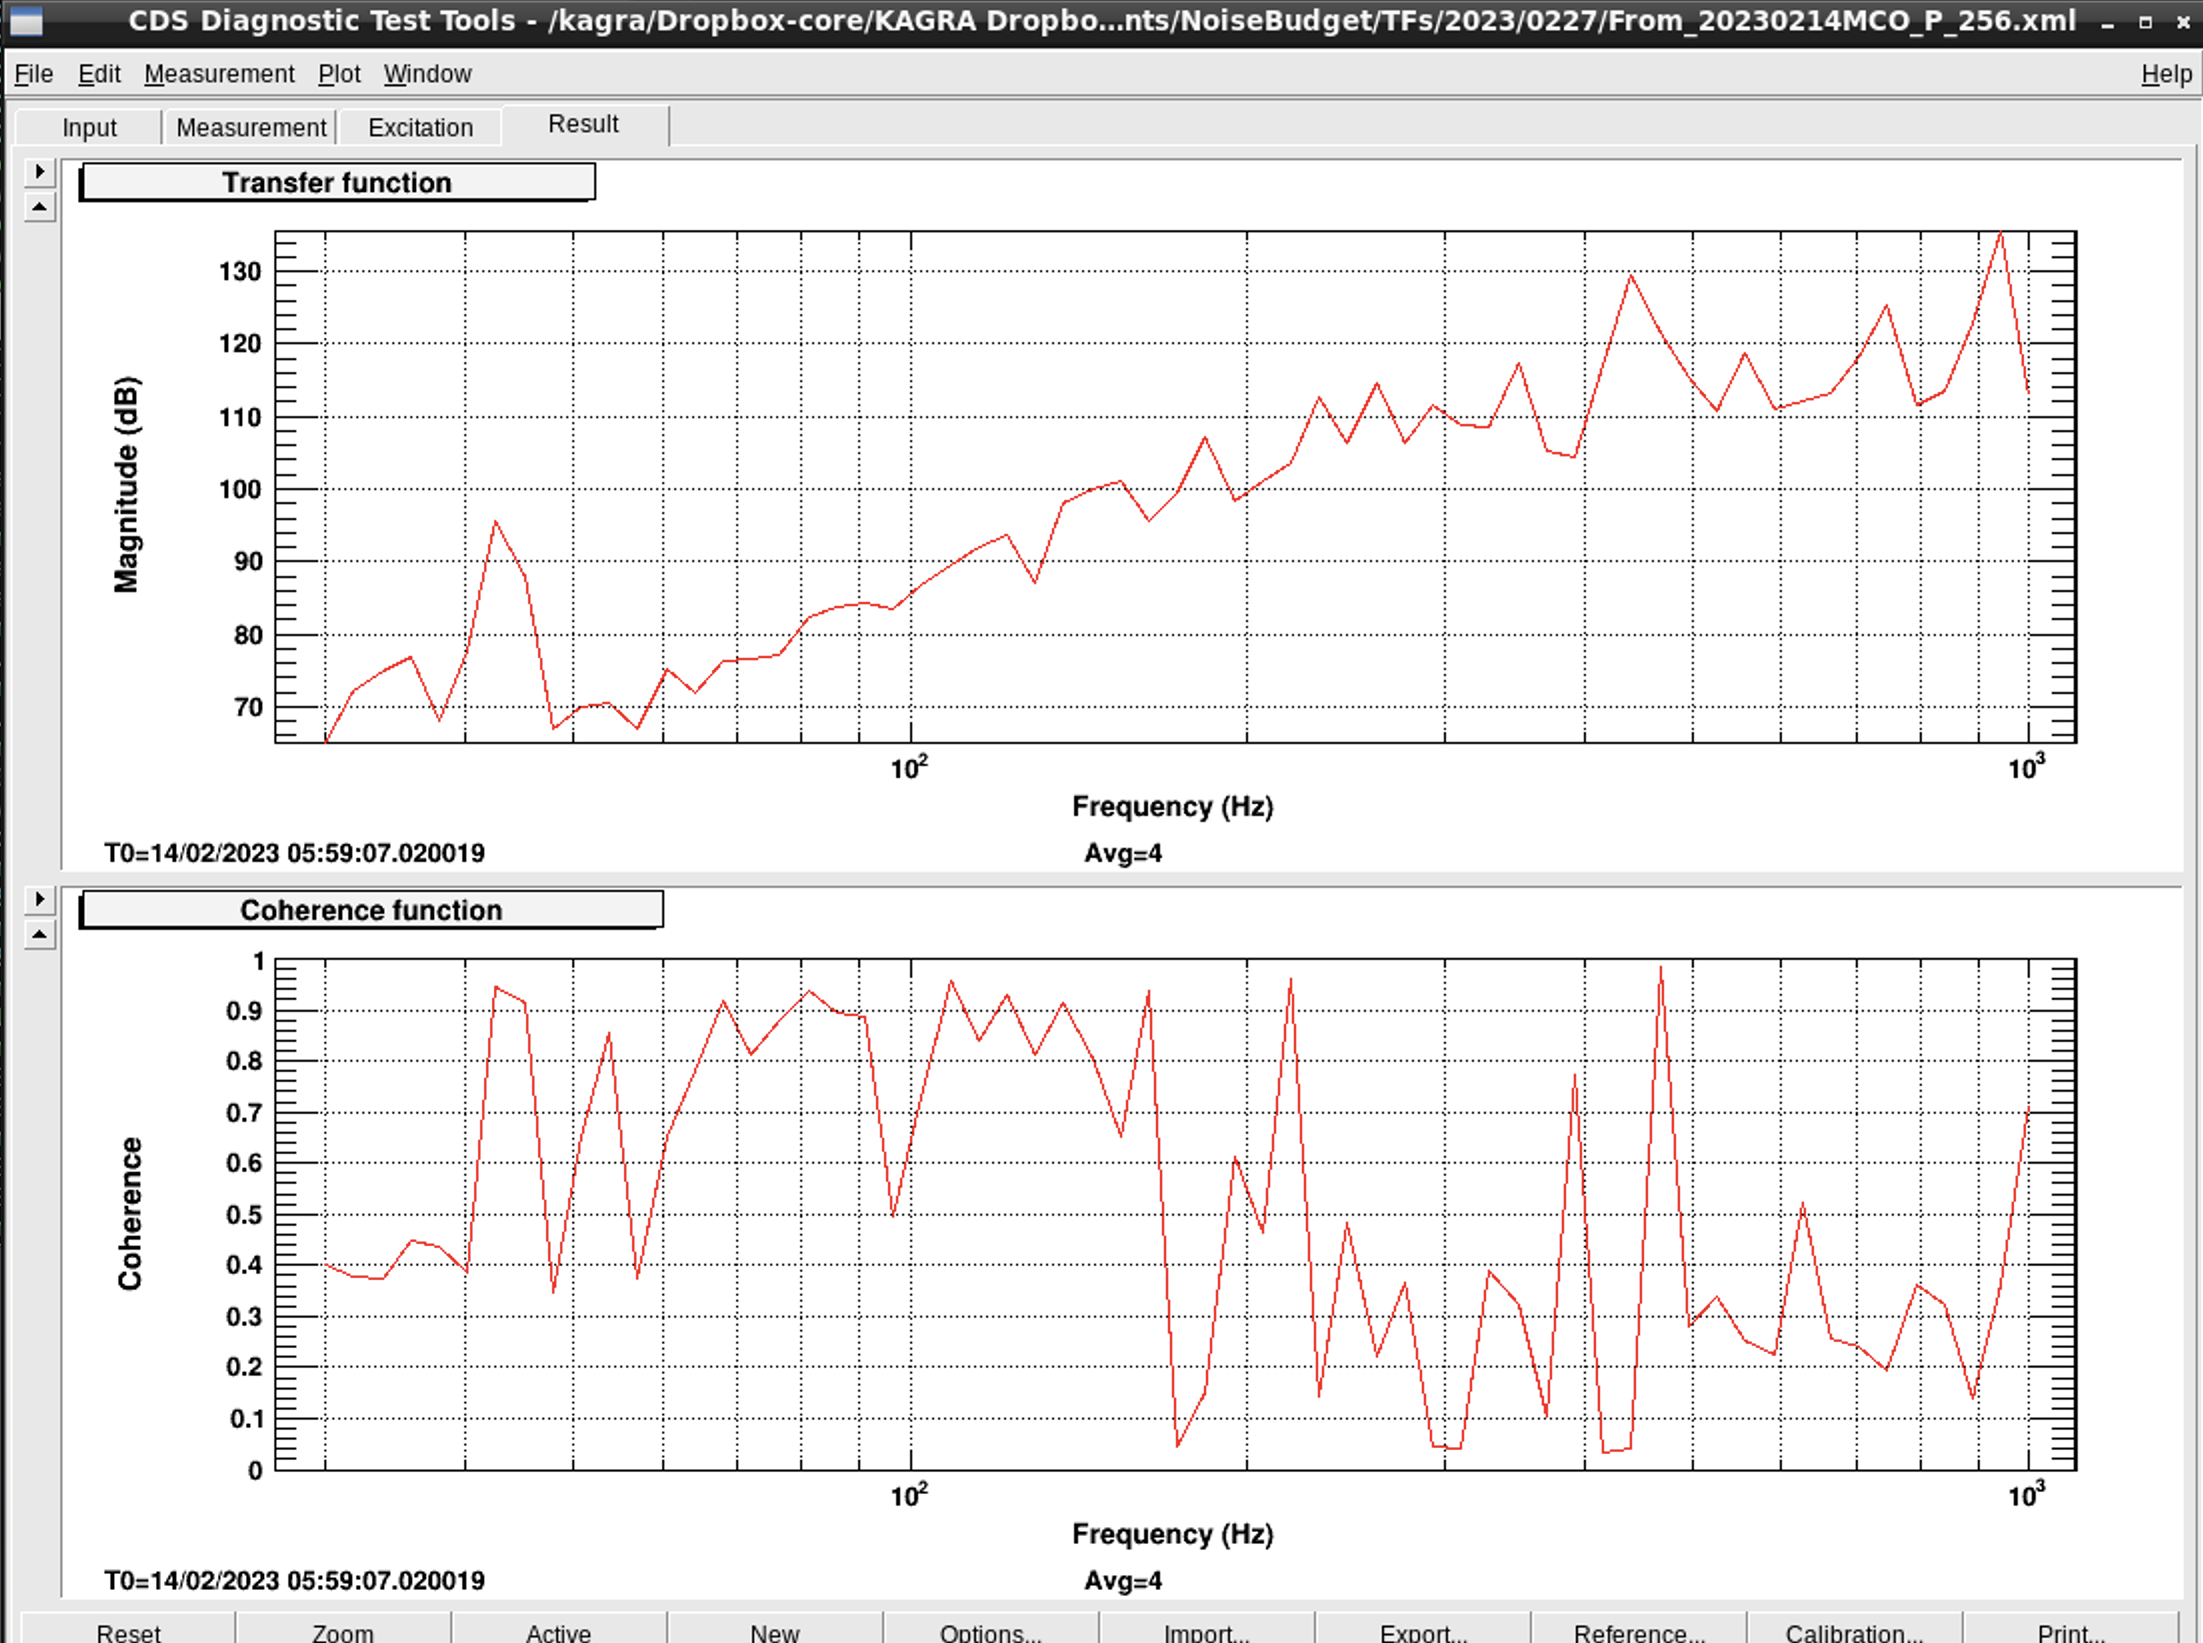
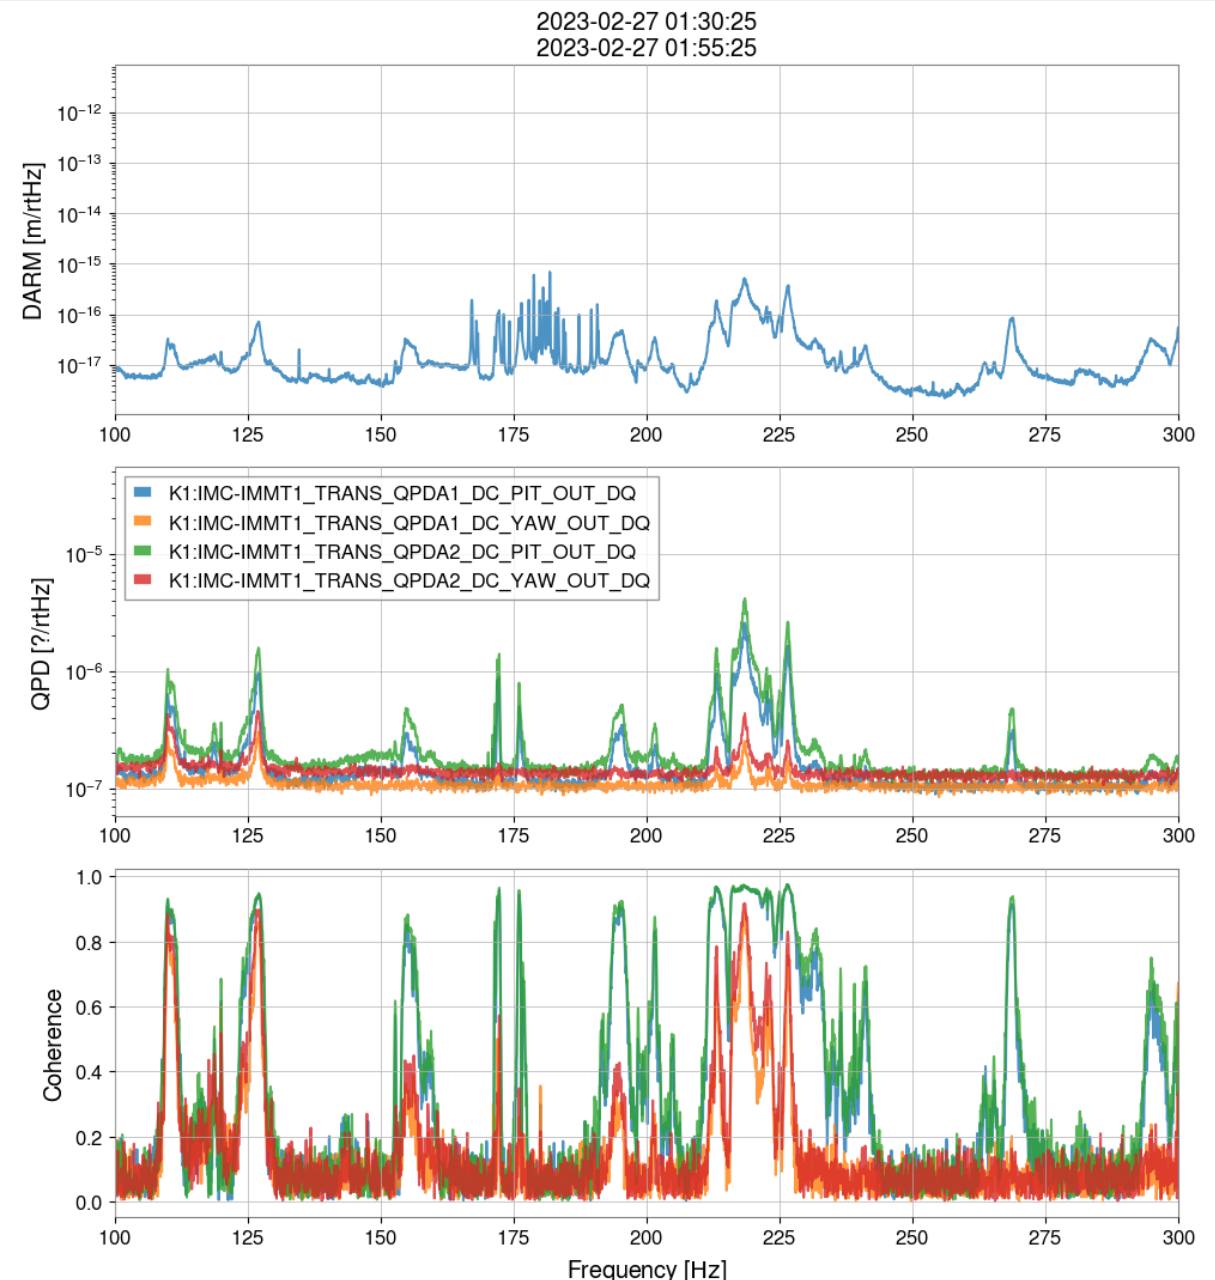
As far as my rough check, somehow the coherence of this transfer function seemed acceptable (Fig. 1), and Fig. 2 is the transfer fucntion; points are measured data, while the curve is a very rough fit: -4*f^2.

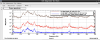
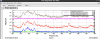
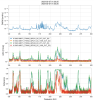
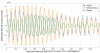
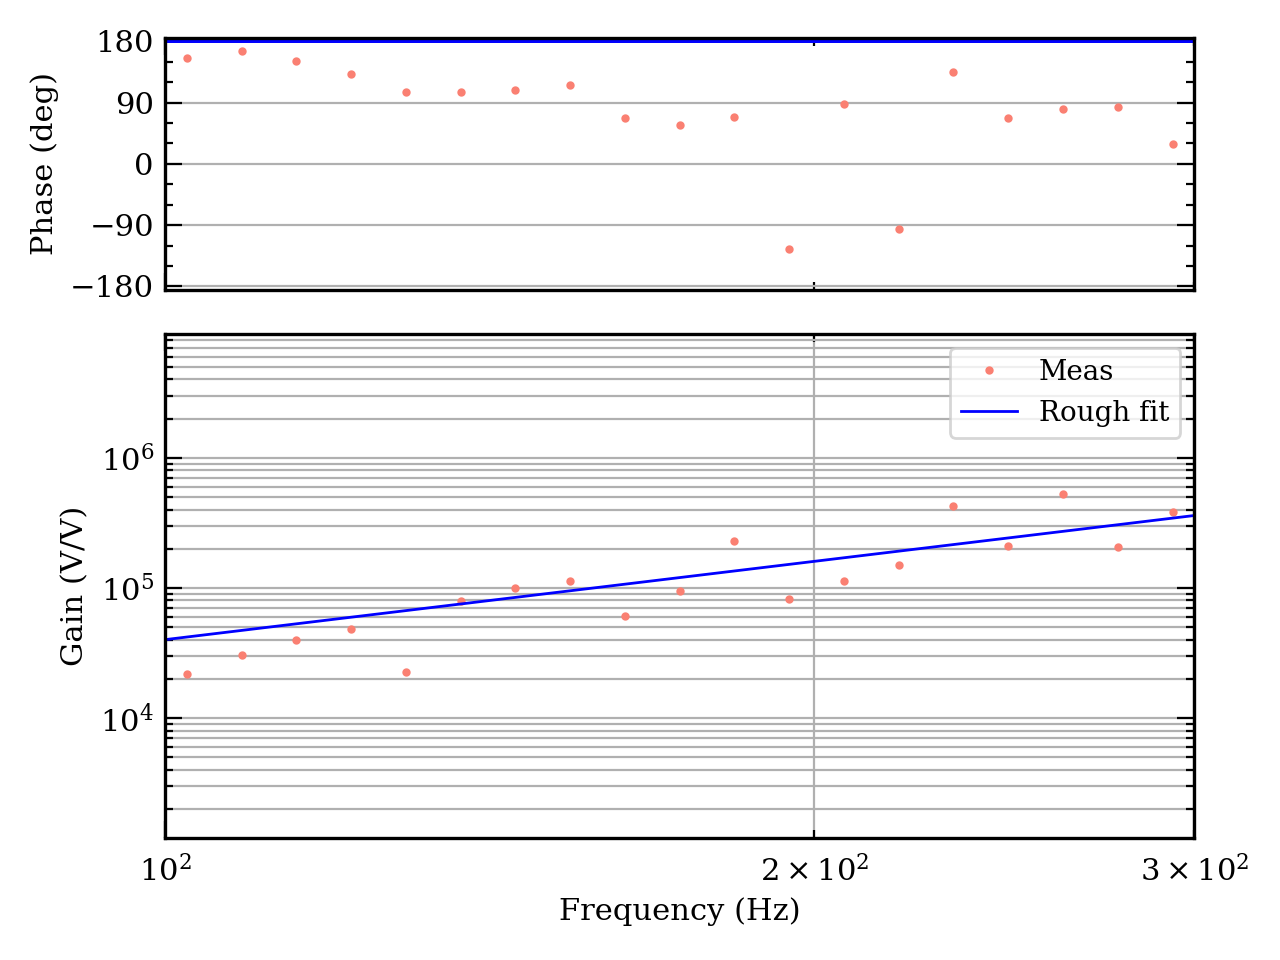
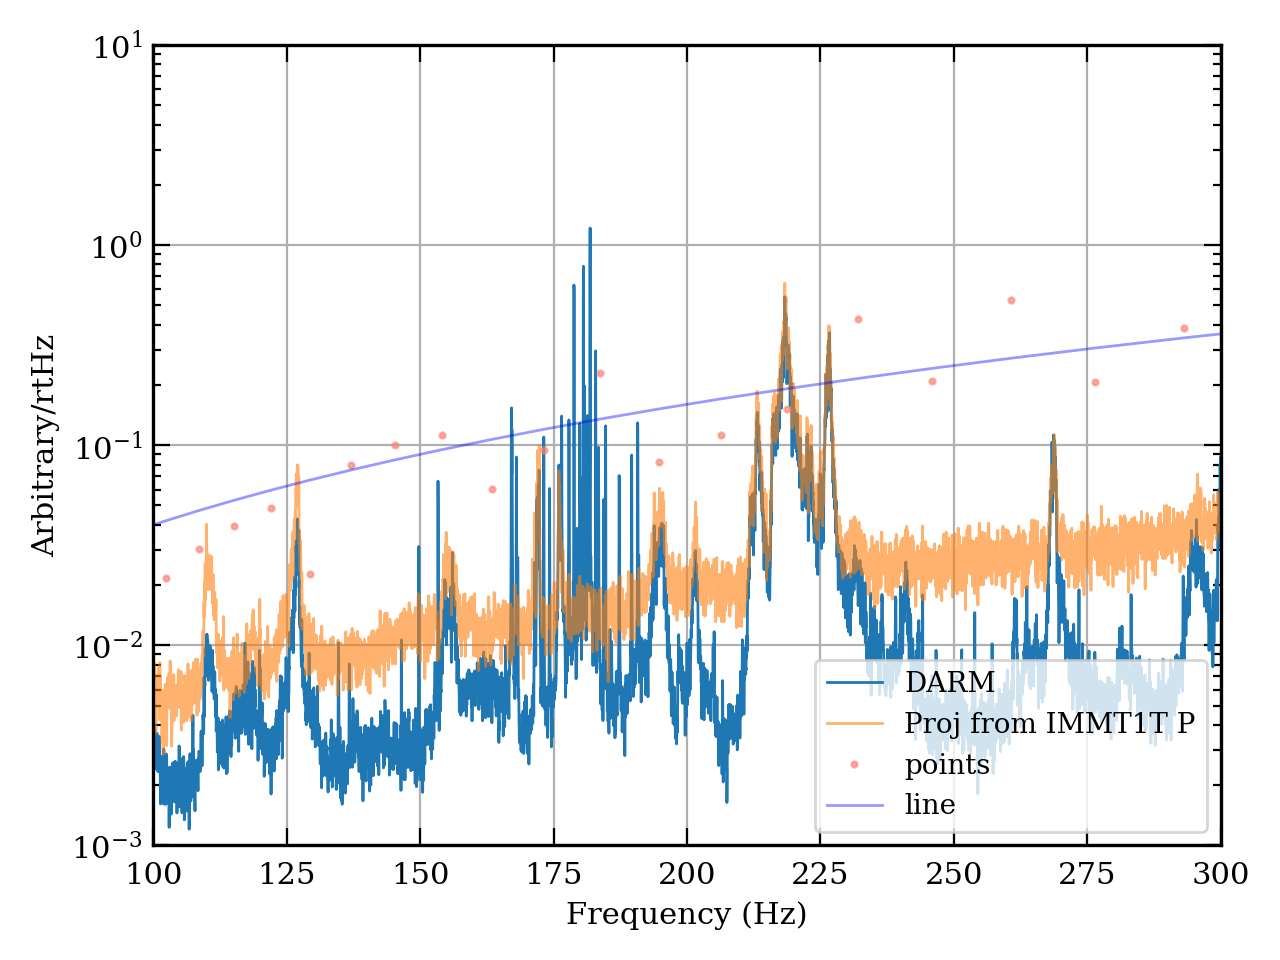
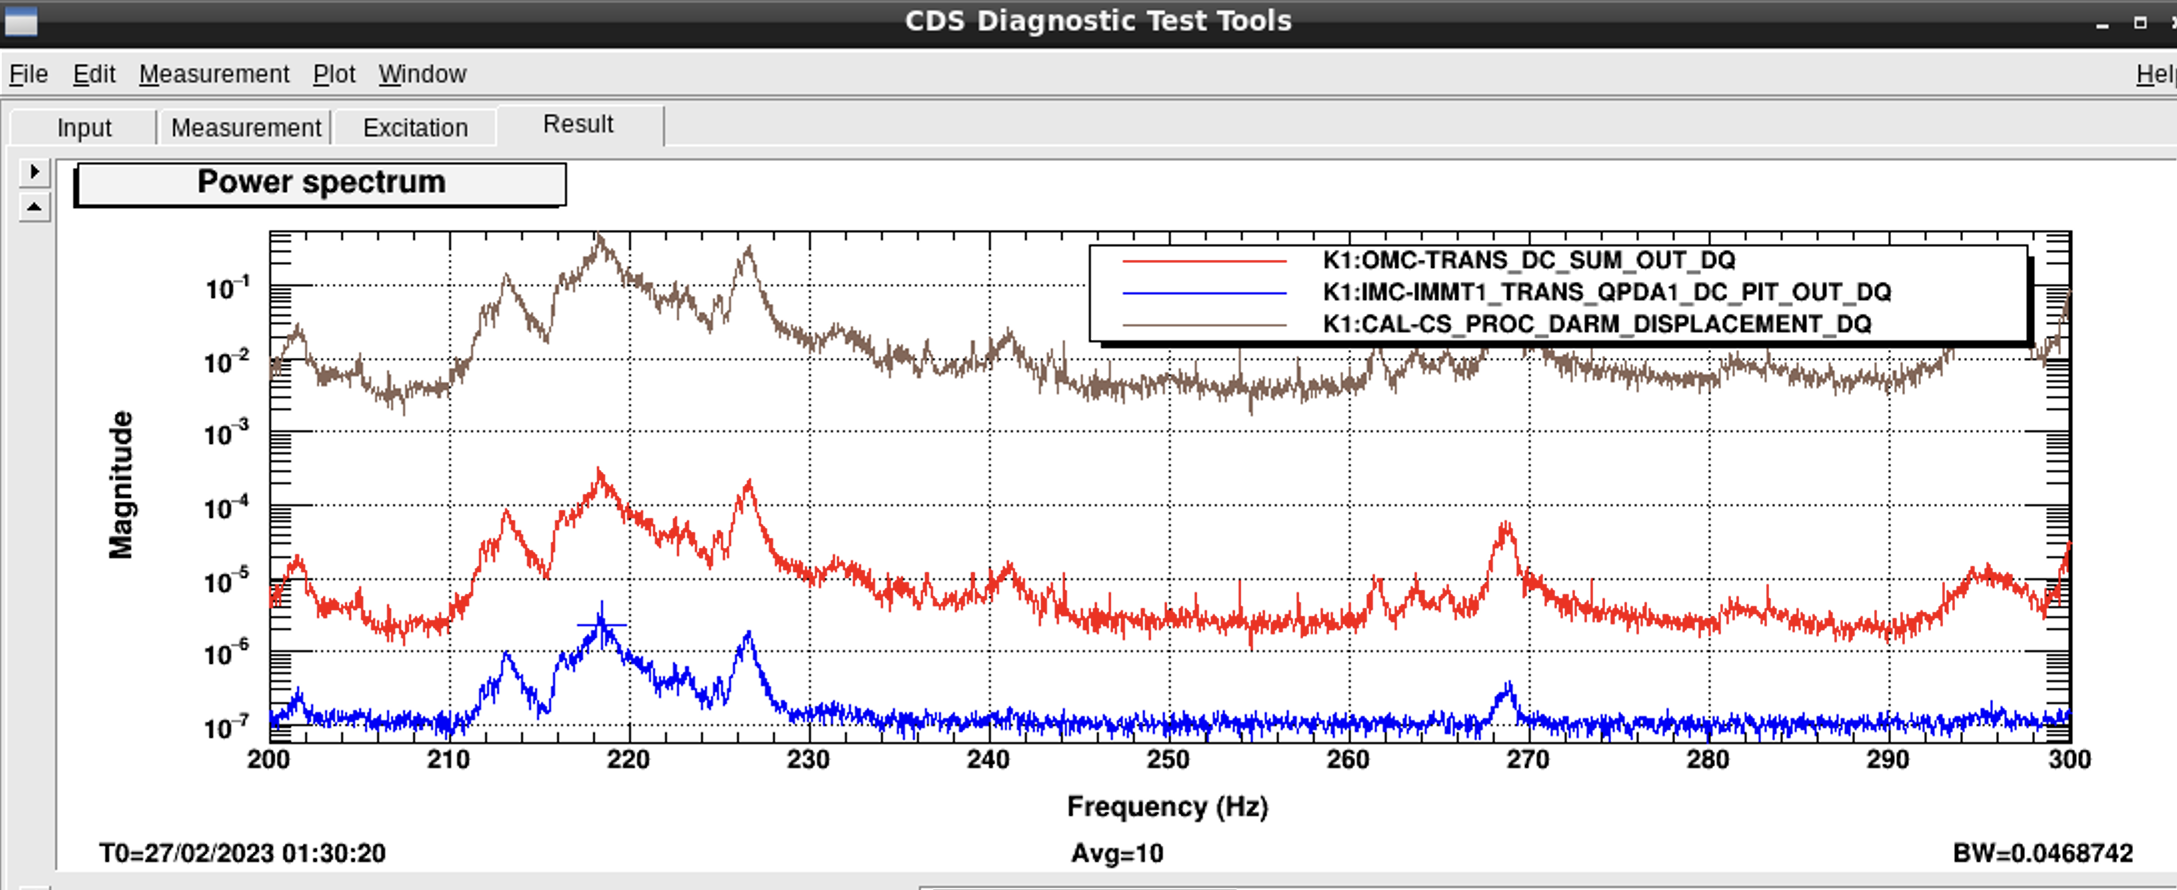
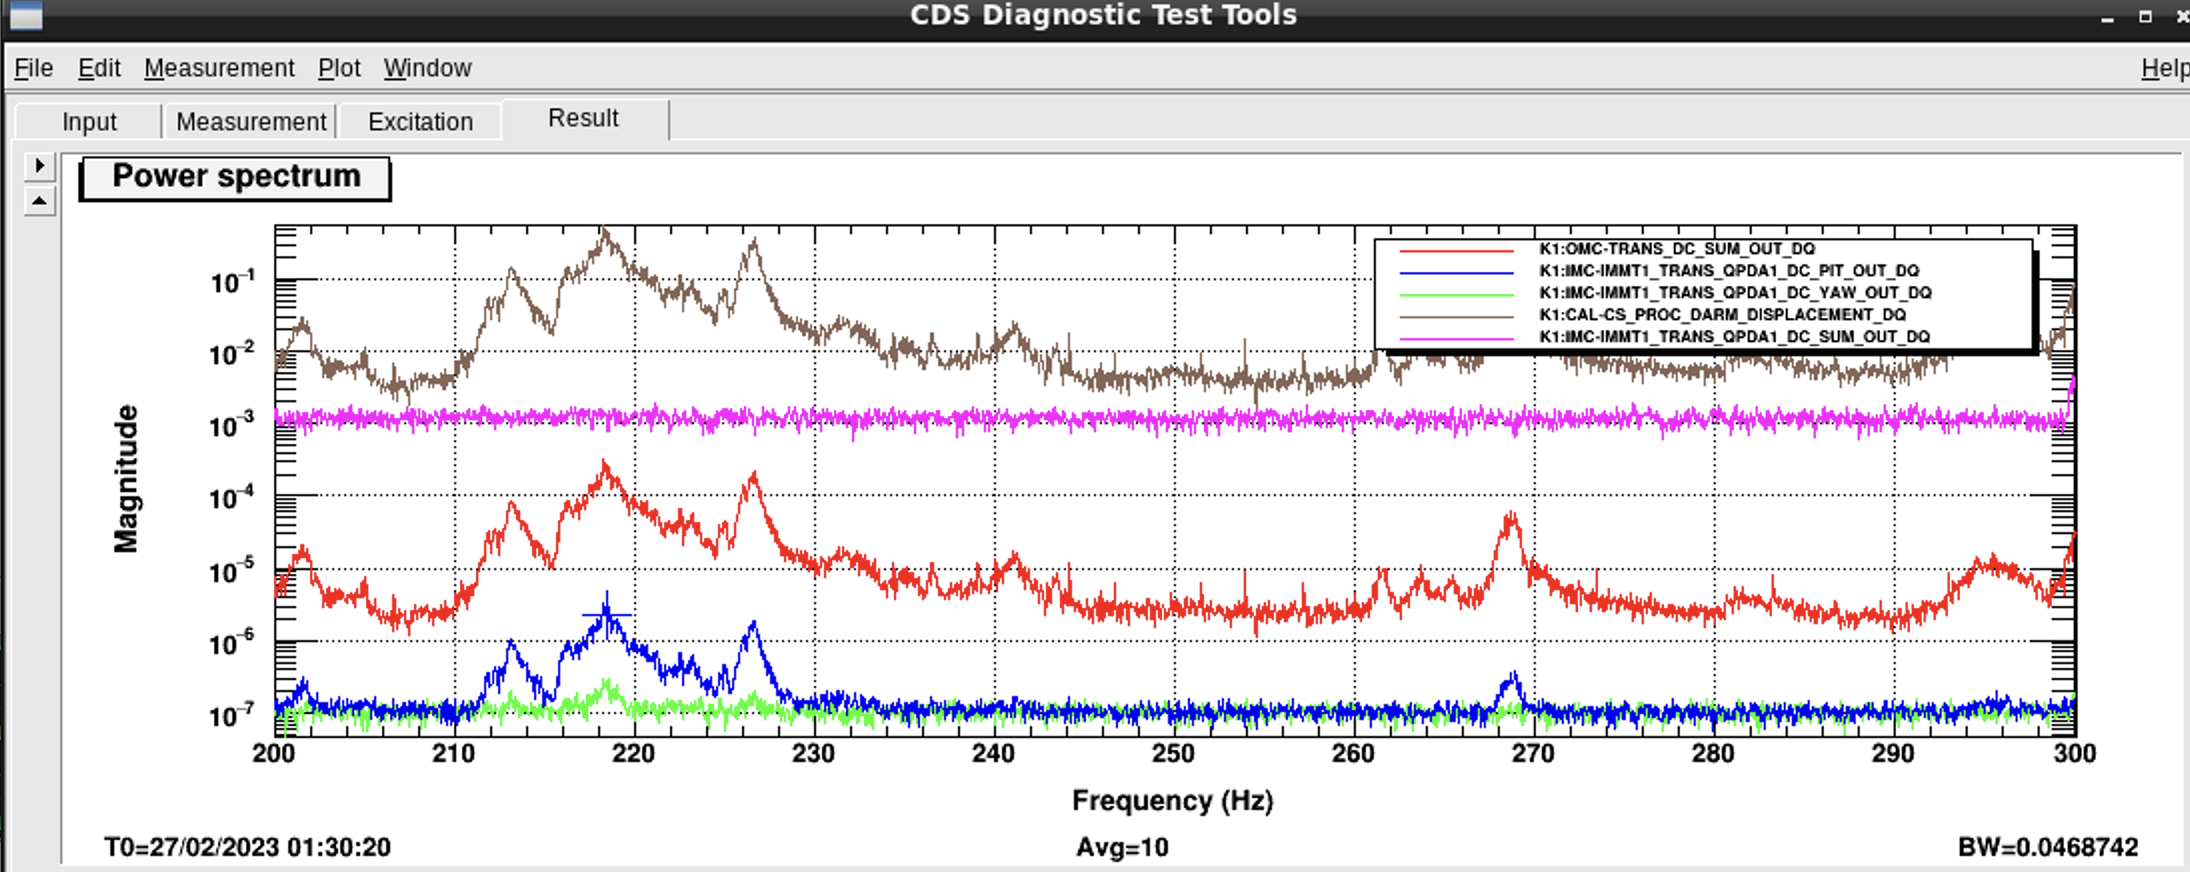
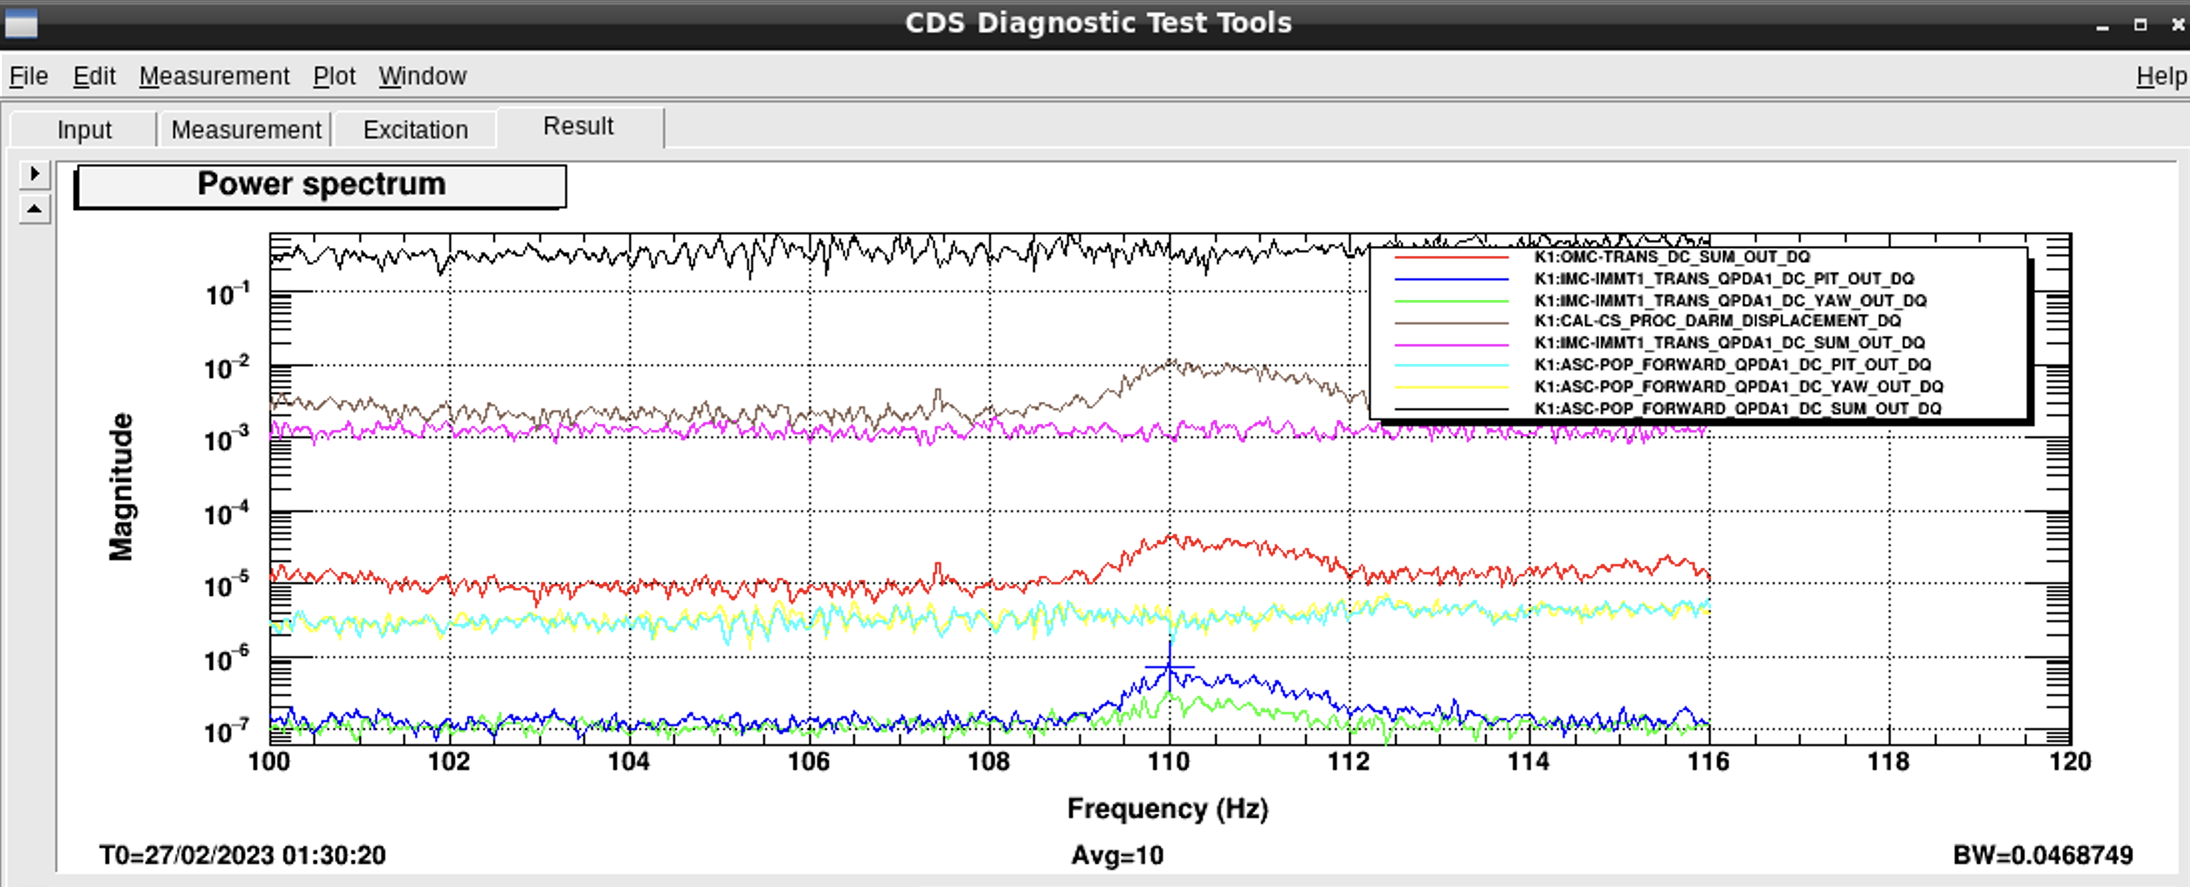
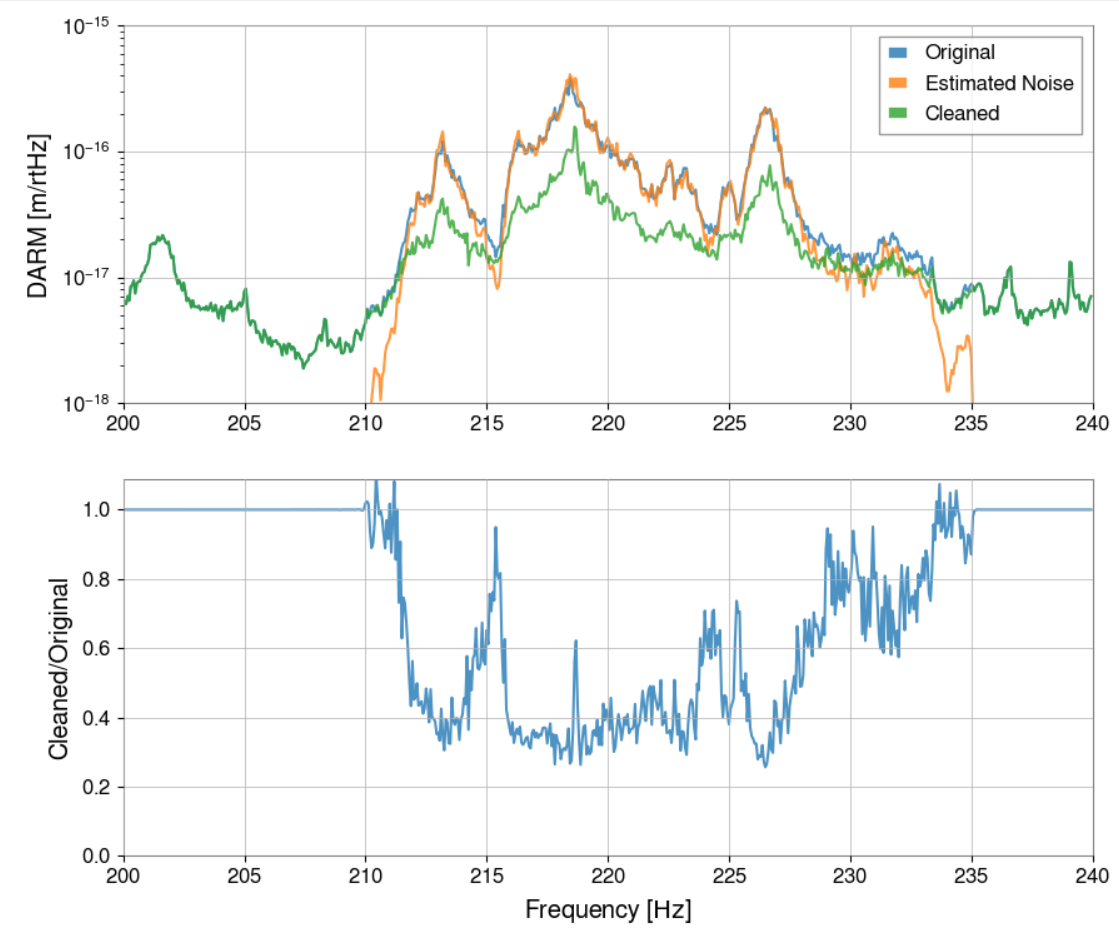
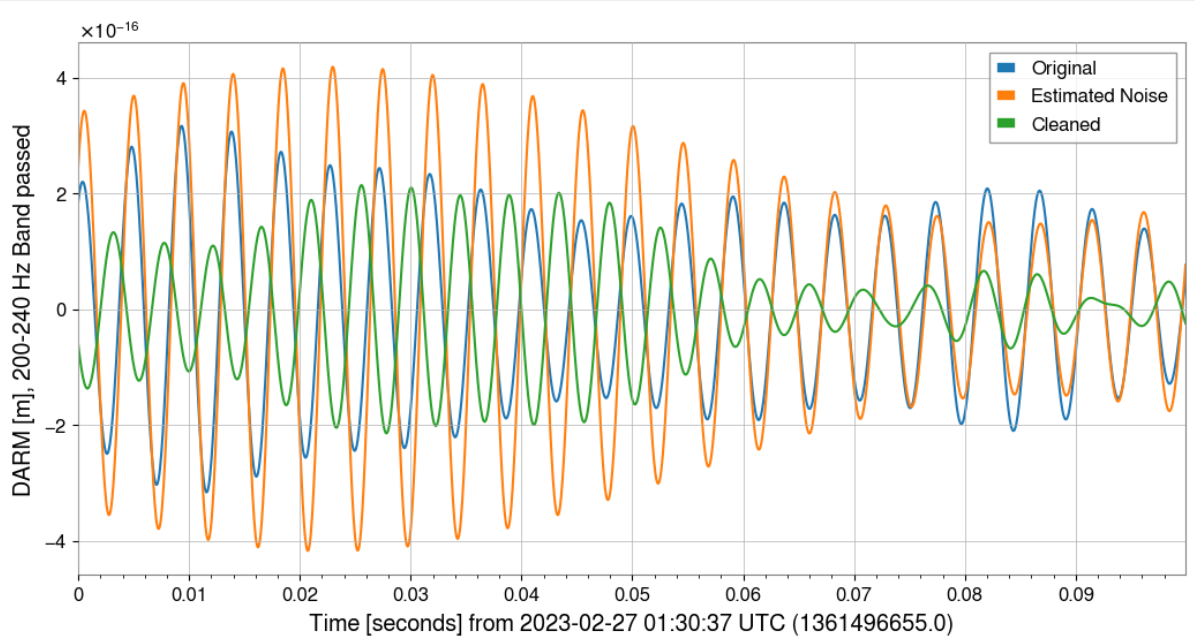
Now I obtain the fit transfer function. Then I used DARM data and IMMT1T pitch data recorded this morning, and made a projection; see Fig. 3. Most of the peaks seemed well explained. Due to maybe ADC noise or dark noise of the IMMT1T QPD, other than such peak structures are just flat. If a whitening filter can be applied to these QPDs, more interesting results might be obtained. For reference, the corresponding screen shot of diaggui is shown in Fig. 4.

So is the principle sculptor the input beam jitter? But where?

Anyway, hopefully do the same measurement again by careful persons to confirm it. There might be my mistake that the coherence of the transfer function measured would not be due to the injected beam jitter, but due to the originally existing peak structures both in DARM and IMMT1T P. In fact, to see such possiblity, I overplot measured/fit transfer function on Fig. 3 with arbitrary scaled.

Images attached to this report
Comments to this report:
tomotada.akutsu - 12:32 Tuesday 28 February 2023 (24195) Print this report

Some additional analysis.

Fig. 1 shows

  • No features in the SUM of the IMMT1T QPD; the bump at 300 Hz would be due to one of harmonics of 60 Hz power supply.
  • Somthing slightly seen in YAW but small.

I also tried to see POP forward QPDs but they are recoreded at 256 Hz, so the only frequency region less than 116 Hz can be seen in DQ. See Fig. 2. No relavant features are found in the POP forward QPDs (neither in pitch, yaw, or sum). Not sure if the would be under dark or ADC noise floor.

Images attached to this comment
yoichi.aso - 19:21 Tuesday 28 February 2023 (24197) Print this report

Ushiba, Miyakawa, Aso

We took spectra of various channels around the 220Hz peaks.

IMMT1 trans, MC REFL and MC trans

We only locked the MC and the IFO was misaligned (PRM, ITMX, ITMY are misaligned).
ISS is turned ON.
In this state, we measured the spectra of the IMMT1 trans QPD, MC REFL QPD (DC) and MC trans QPD.

Observations are:

1. The peak structure around 220Hz cannot be seen in any other channels.
2. The fact that IMMT1_TRANS_SUM does not see the peaks mean they are beam jitters, not intensity noise at IMMT1 trans.
3. No peaks found in MC REFL and MC trans suggests that the beam jitters are introduced after IMC.

OMC QPDs

We then moved on to the investigation using the OMC QPDs.

X-arm single bounce

PRM, ITMY, ETMX: misaligned
ITMX: aligned

We took spectra of the OMC QPD1 signals with the X-arm single bounce condition.
Observations are:

1. The 220Hz peaks can be seen both in PIT and YAW
2. SUM also sees the peaks but smaller.
Note: PIT and YAW are normalized by the SUM, which was about 4500. So, the PIT and YAW signals need to be multiplied by 4500 to compare the magnitude with the SUM signal. By doing so, one can see that the PIT/YAW peaks are much larger than the SUM peaks.
3. The above observation suggests that the peaks are mainly created by the beam jitter, not by the intensity fluctuation.
4. The small peaks in SUM may be from the coupling of the jitter into the SUM through the cross hair lines of the QPD.
5. It does not completely preclude the possibility of intensity fluctuation created by a beam clipping.

Y-arm single bounce and lock

PRM, ITMX, ETMX: misaligned
ITMY, ETMY: aligned

We then changed the IFO configuration to Y-arm single bounce.
We also took spectra with the Y-arm locked. When the arm was locked initially, the alignement was bad.
We engaged ADS to improve the alignment.
Spectra with these condisions are compared.
Observations are:

1. The 220Hz peaks in the single bounce spectra of SUM are a factor of few higher than the ones for X-arm.
Does this mean there is an extra beam clipping in the Y-arm path?

2. Both the beam jitter and intensity fluctuation get increased when the Y-arm is locked in a bad alignment.
3. The above noise level comes back to the same level as the single bounce case when the alignment is good.

Take away message for today

1. The 220Hz peaks are most likely coming from beam jitters generated somewhere between the IMC and IMMT1.
2. There are only two reflective optical elements there, STM1 and STM2.
3. In fact, the tapping test done today (klog will be posted elsewhere) showed that tapping the IFI chamber can easily excite the 220Hz peaks.
4. We still do not fully know the mechanism of converting the 220Hz beam jitters into the DARM noise.


Non-image files attached to this comment
tatsuki.washimi - 18:39 Wednesday 01 March 2023 (24221) Print this report

I'm trying to subtract the beam jitter noise (witness: IMMT1 PIT) from DARM, by the ICA technic.
This is the first trial.

Fig. 1 & 2: Checking the spectrum and coherence (include other channels)
Fig. 3: Estimation for the transfer function derived from the cross-spectrum density (FFT length = 512s, smooshed by 64 points moving average)
Fig. 4: ASDs for the original DARM signal, the estimated noise, and the cleaned DARM signal
Fig. 5: Checking the time series with bandpass and zooming up.


Images attached to this comment
tatsuki.washimi - 11:43 Thursday 02 March 2023 (24230) Print this report

I found the moving average for the TF was only for the real part.
After fixing this bug, the result is not changed so much.

Images attached to this comment
Search Help
×

Warning

×