Reports 1-1 of 1 Clear search Modify search
VIS (SR2)
fabian.arellano - 16:09 Wednesday 12 October 2022 (22451) Print this report
IP sensor and actuator diagonalization

This entry gives more quantitative information on the diagonalization reported in klog 22433 (wrongly filed in BS section originally).

The tasks that were done were these:

  • Sensor diagonalization from L and T to Y using the L and T resonance frequencies and
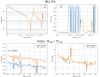
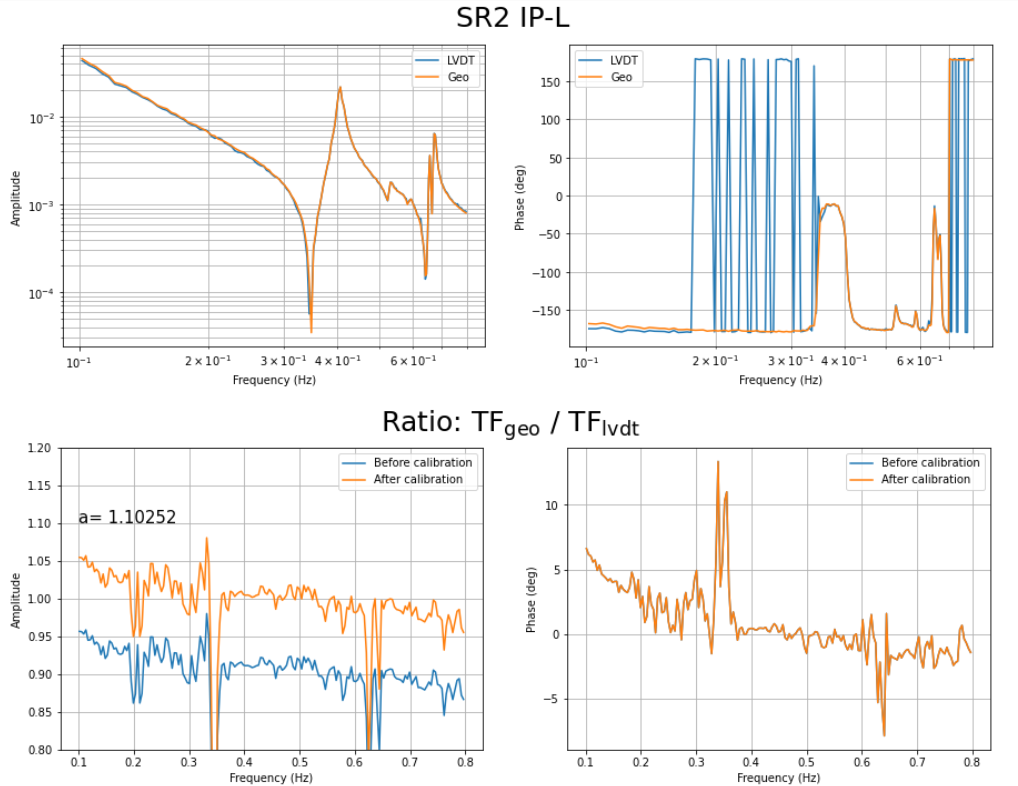
  • Actuator diagonalization using DC actuation.

Sensor diagonalization between L and T is challenging because the resonance frequencies are very close to each other around 70 mHz. Therefore, did the diagonalization from L and to Y, as written above. 

As can be read the from the results below, the coupling from L and T into other DoF decrease, however, the coupling from Y to L and T, increased at the resonance frequencies of L and T. Namely, from Y to L is 3% of L, and from Y to T is 20% of T.

Actuation coupling of 20% from  Y to T is large, and I should probably revert the matrices to the previoius geometrical values. 

Quantitative results

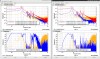
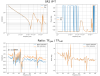
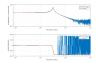
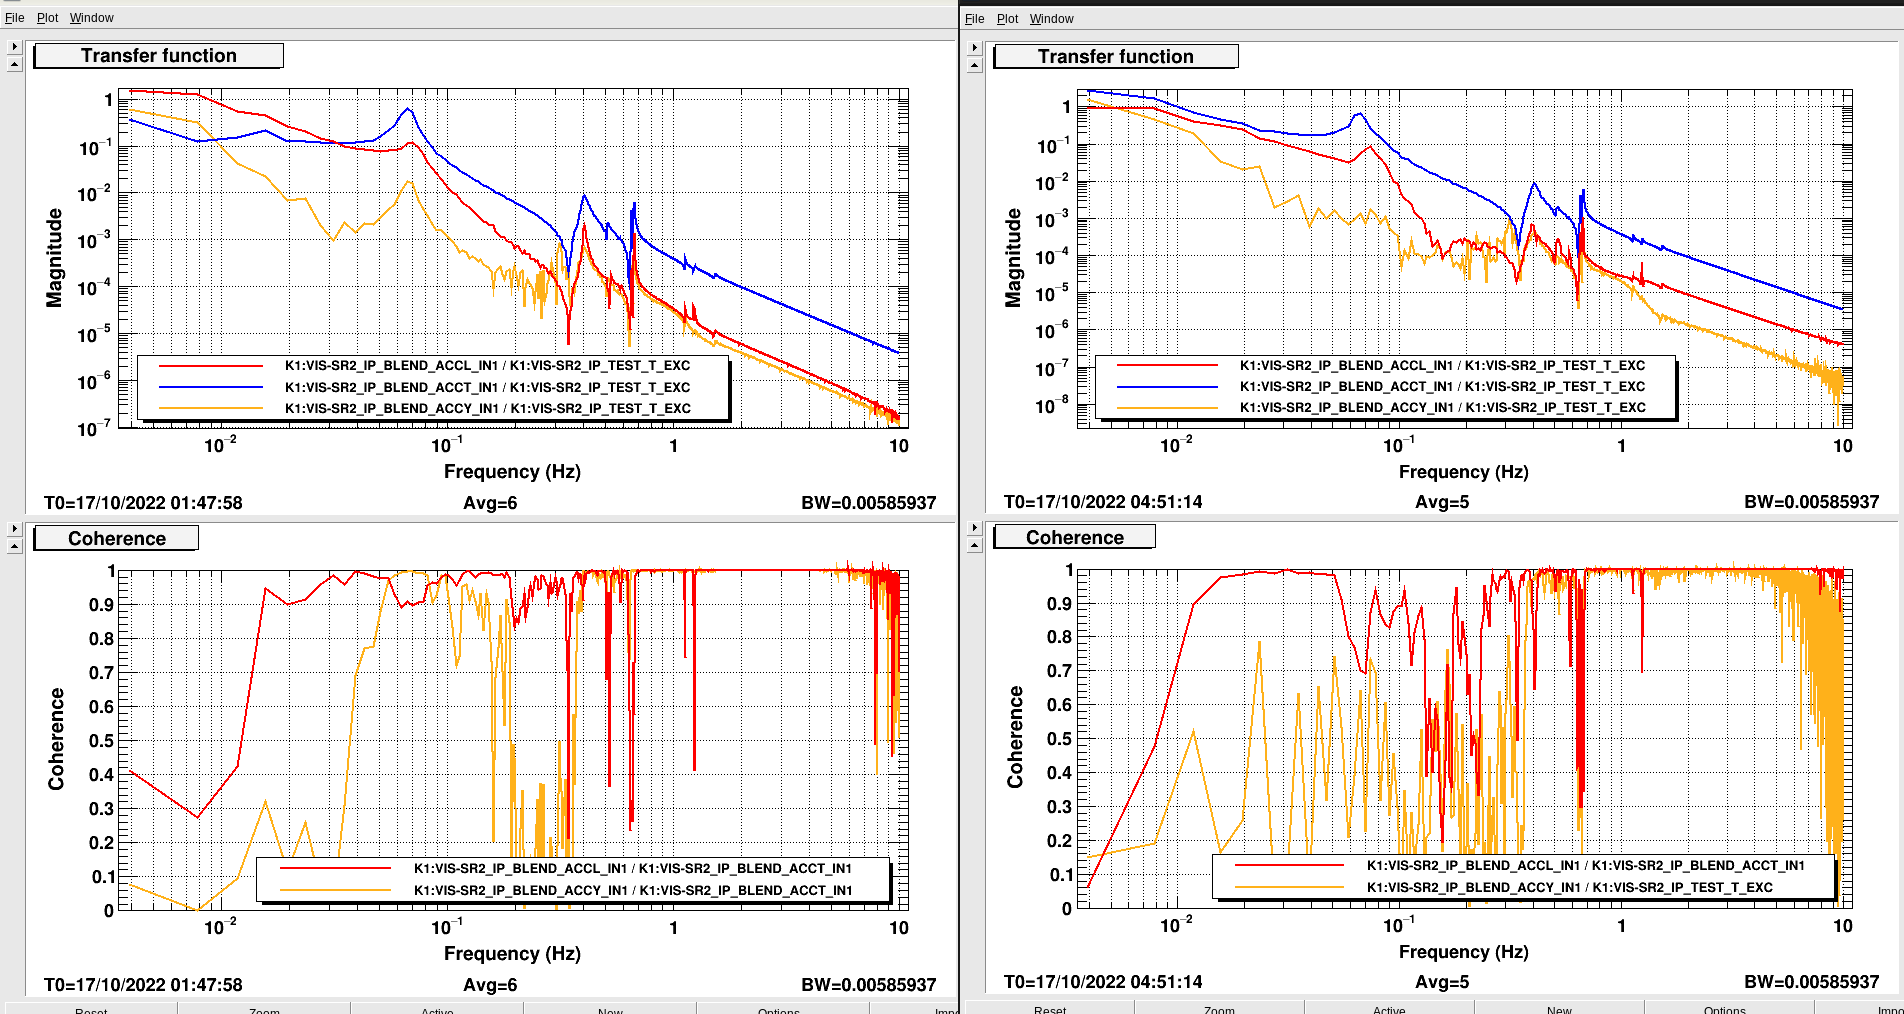
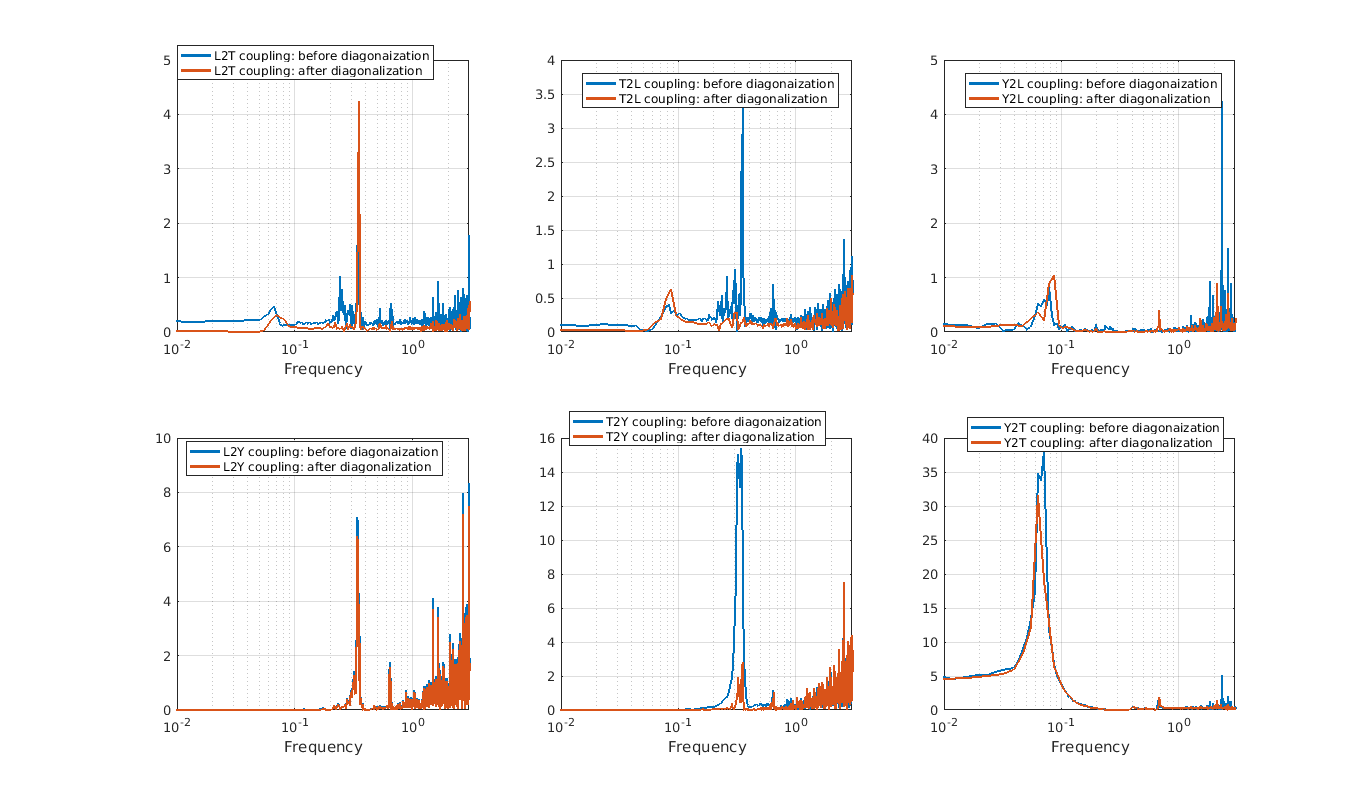
Coupling from L to T and Y

  • Along T: improvement at low frequencies by a factor of 8.2.
  • Along Y: improvement at low frequencies by a factor of 6.4, and at the resonance by a factor of 3.7.
  • See Fig. 1: before (left) and after (right) diagonalization.

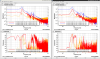
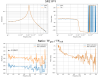
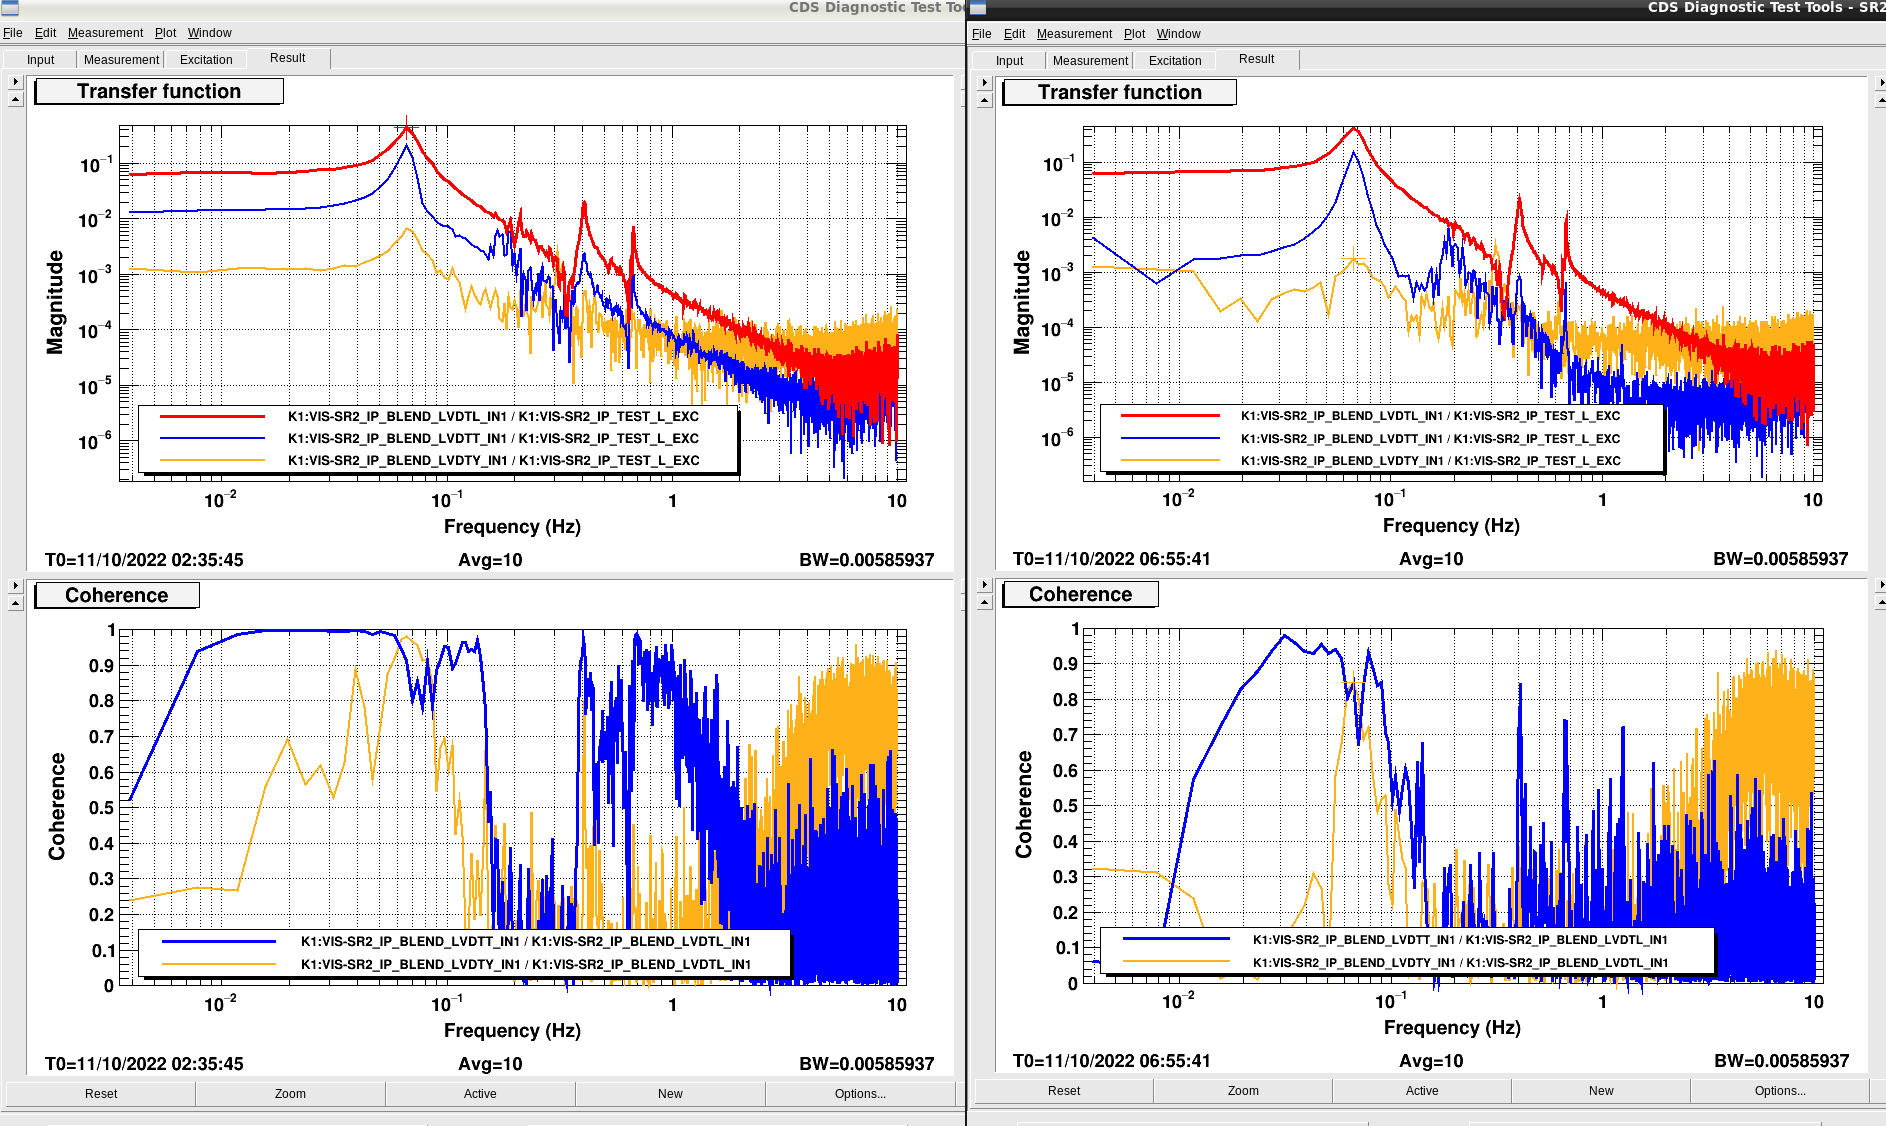
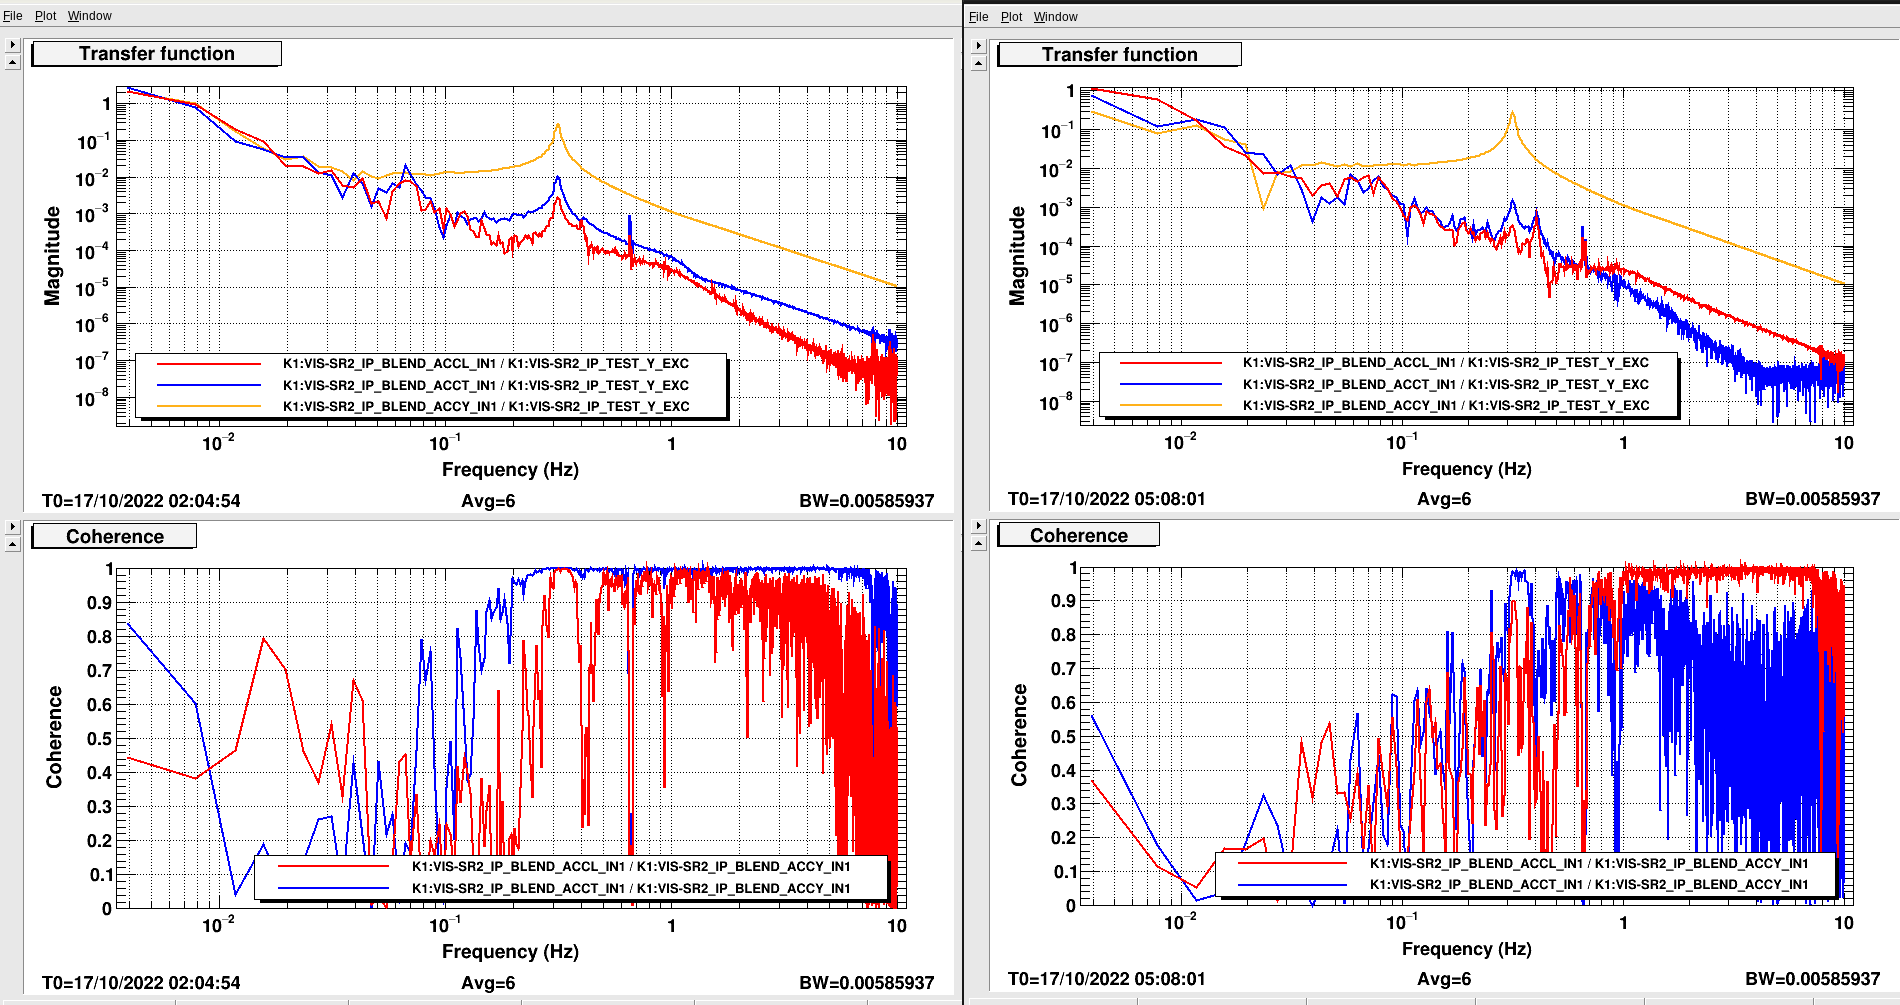
Coupling from T to L and Y.

  • Along L: improvement at low frequencies by a factor of 6.3.
  • Along Y: no improvement at low frequencies, and an improvement at the resonance by a factor of 1.2.
  • See Fig. 2: before (left) and after (right) diagonalization.

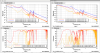
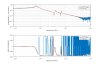
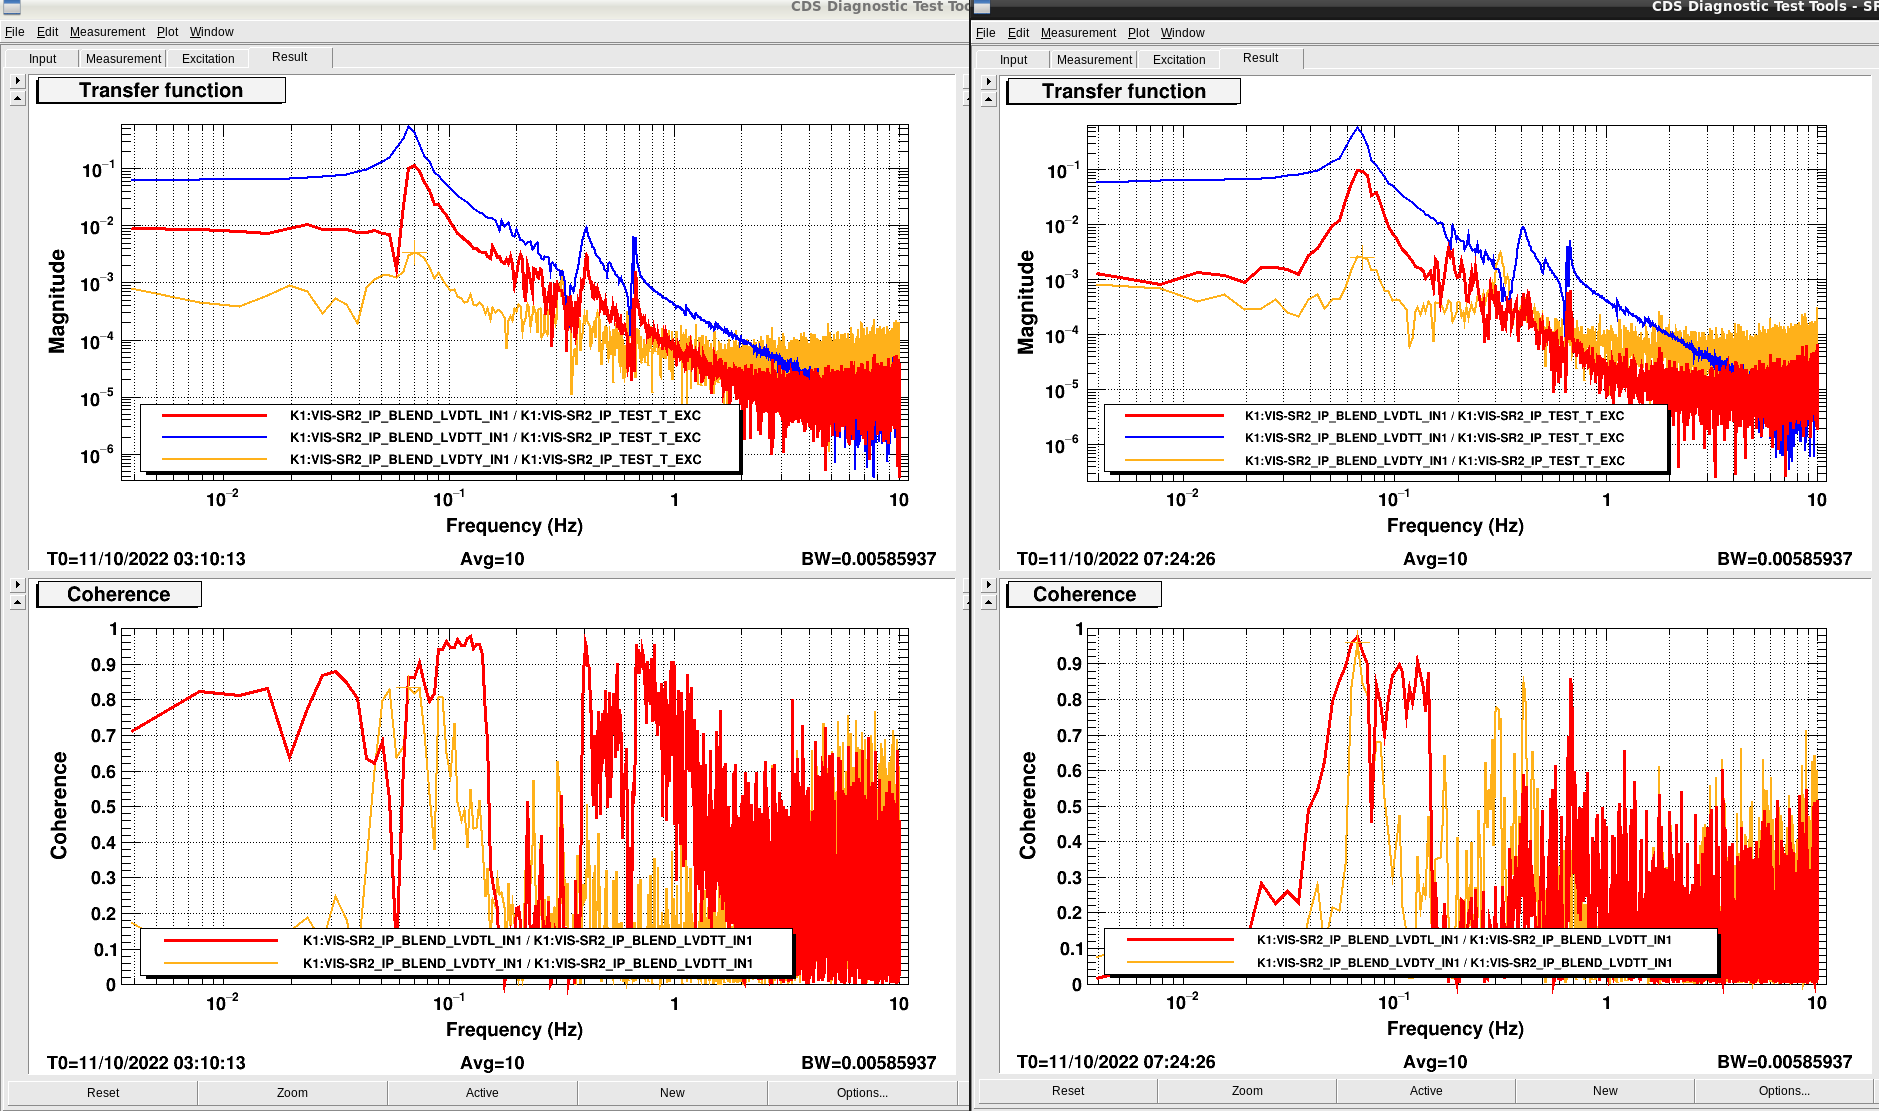
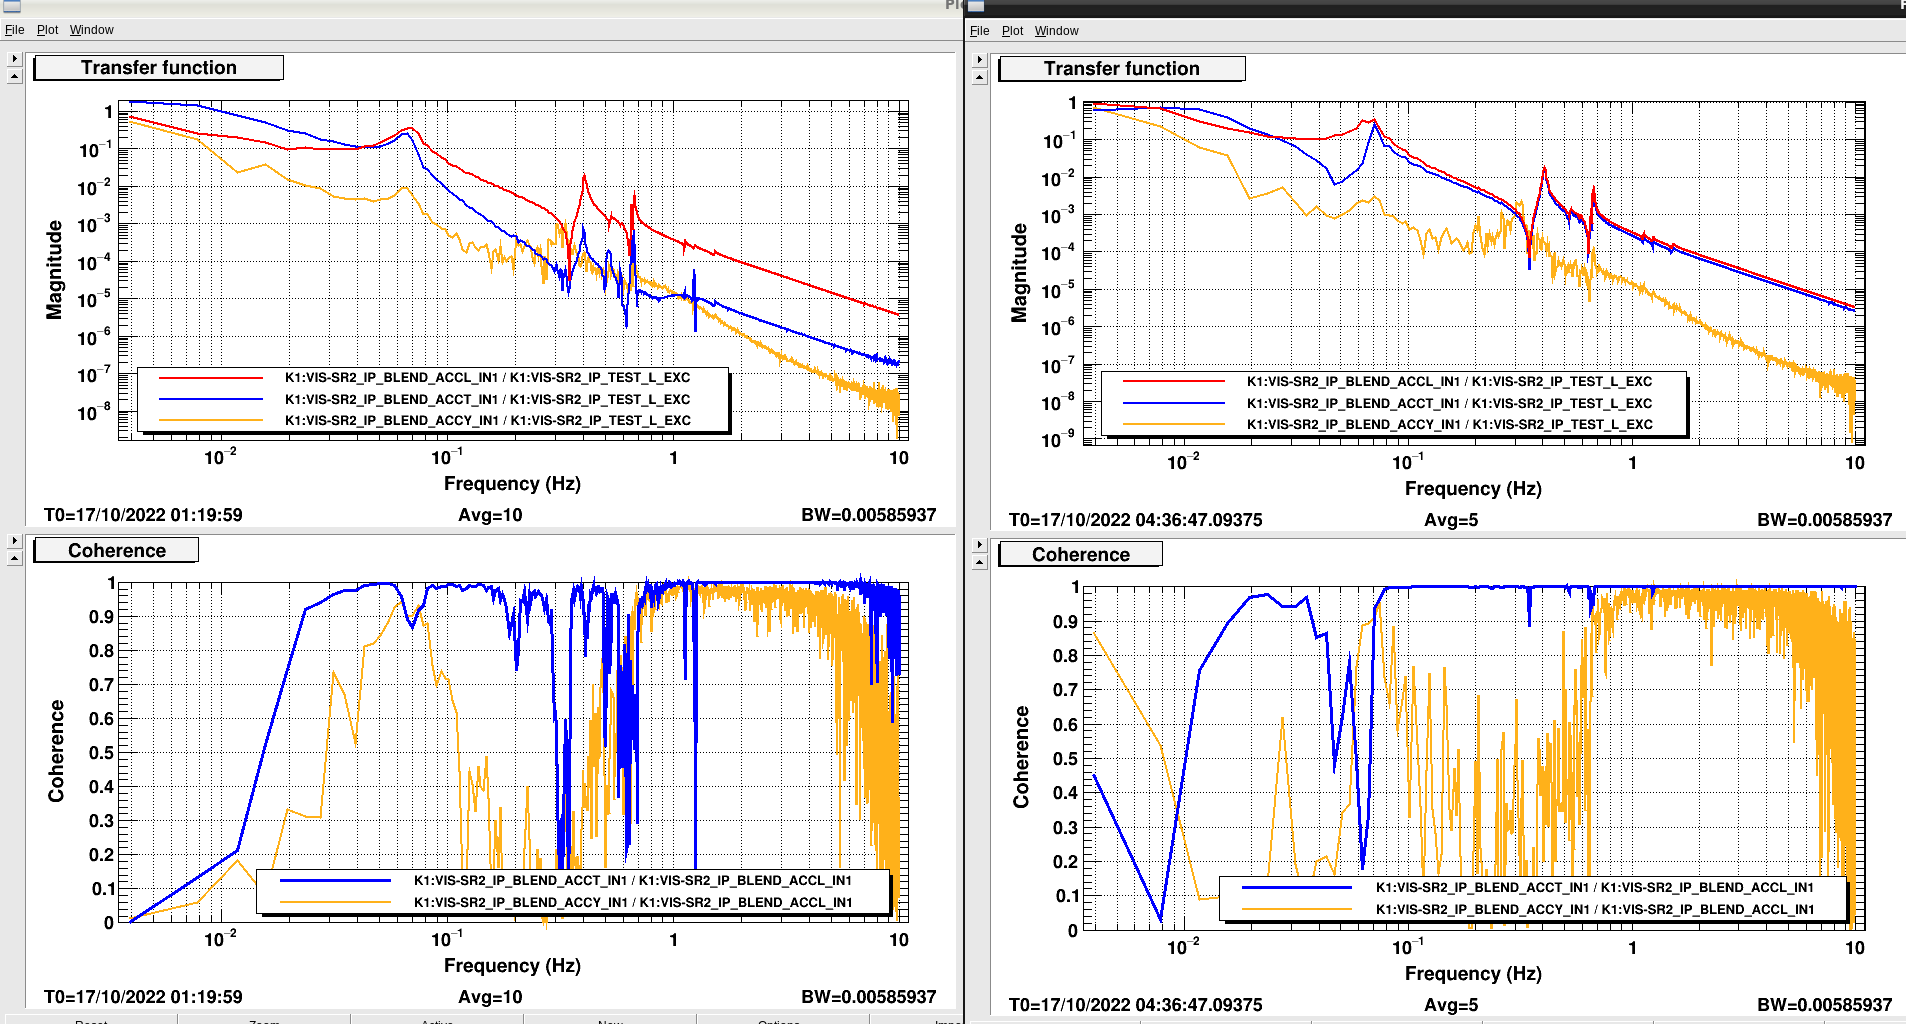
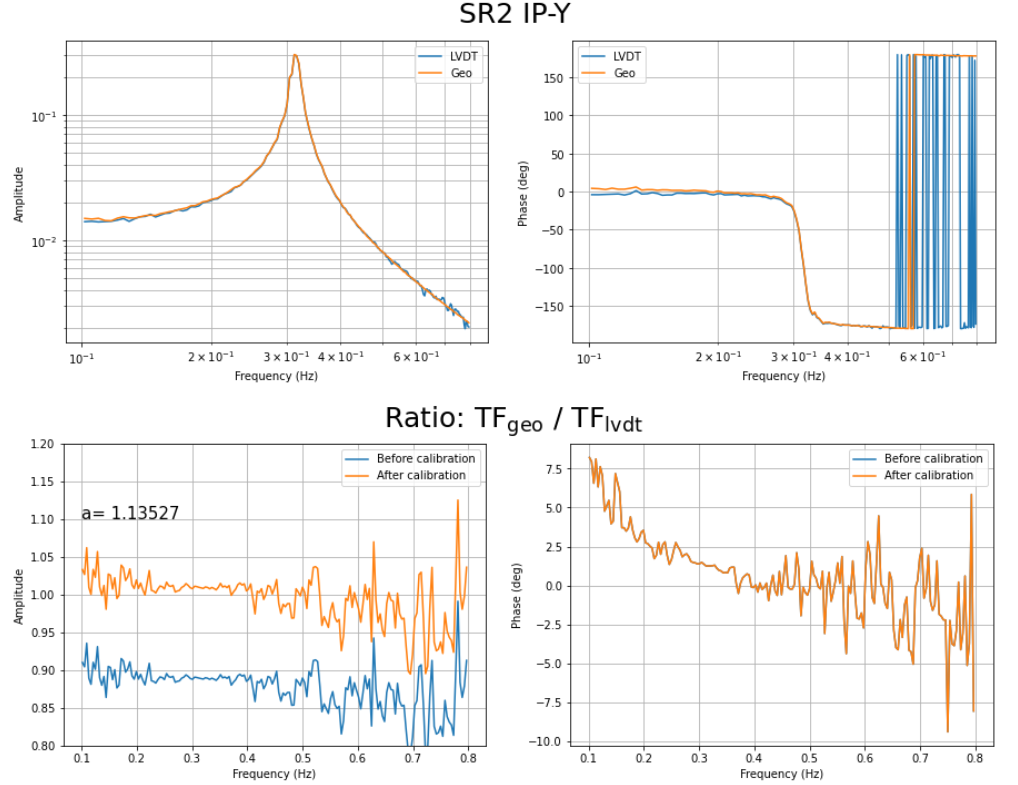
Coupling from Y to L and T

  • Along L: increase at low frequencies by a factor of 3.9 and by a factor of 1.2 at the resonance.
  • Along T: increase at low frequencies by a factor of 3.1, and an improvement at the resonance by a factor of 1.2.
  • See Fig. 3: before (left) and after (right) diagonalization.
Images attached to this report
Comments to this report:
fabian.arellano - 17:15 Monday 17 October 2022 (22541) Print this report

Given the fact that the diagonalization procedure I tried for the LVDTs, introduced some large coupling (klog 22451), I reverted to the purely geometrical matrices (per the 3D-CAD). In practice, this simply implies setting matrices LVDTALIGN and ACTALIGN to the unit matrix since the geometrical information is in LVDT2EUL and EUL2COIL.

Then I tried to diagonalize the geophones in L, T and Y. Unfortunately, the  coupling from L to T increased above the resonant frequency. See in Fig. 1 the before (left) and after (right) transfer functions. Becuase of this, I decided to keep the purely geometrical matrices instead. Fig. 2 and 3 show the coupling from T and Y, before (left) and after (right) diagonalization. There is some improvement in those degrees of freedom. (The files are in /kagra/Dropbox/Subsystems/VIS/TypeBData/SR2/TF/Measurements/20221017/)

With the purely geophone geometrical matrices, I calculated again the inter-calibration factors between geophones and LVDTs. I did it before (klog 20812), but I had used an old version of the diagonalizaton matrix (klog 22433), whose performance I should check again sometime. The results are shown in Figs. 4,5 and 6. I wrote the calibration factors multiplying by the old ones because I forgot to remove the old ones before the measurement.

The next step is to recalculate the inter-calibration factor between the seismometer and the geophones and LVDTs.

Images attached to this comment
lucia.trozzo - 16:37 Thursday 20 October 2022 (22594) Print this report

I realized that the transfer functions, along L and T directions, measured by the LVDT show large coupling at DC. Therefore, I tried to disentangle them by measuring the ACTALIGN (D1) by pushing the IP in DC.
Below is the matrix updated in the MEDM:
D1=[0.98520 -0.0562 0.01410
    0.2434 0.9870 -0.0087
    -0.0872 -0.0685 0.9996]

Pic.1 shows the broadband residual coupling, as a function of the frequency, before and after changing the actuator align matrix.
 Looking at this plot, it is possible to note that the sensing couplings, especially the terms L2T, L2Y, T2L, and Y2T, are reduced.
The matrix seems to work fine.
Pic2, Pic3, and Pic4 show the comparison of the measured TFs and the fits along L, T, and Y.
The zero pole models used to fit the TFs have been uploaded in MEDM DCCTRL filter bank as susmod.

Images attached to this comment
Search Help
×

Warning

×