K1PR2 and K1IY0 were not DAQ-ed during 17:54-19:07.
-----
At 17:54, mx_stream of K1PR2 and K1IY0 hung up (maybe) at the same time.
I launched mx_stream at 19:07 and DAQ for these front-ends was resumed.
The cause of this problem is under investigation...
There is no log at least on dmesg.
I checked k1imc0 and found that mx_stream was stopped.
I also found k1ey1 has '0xbad' status so I first try to restart mx_stream on k1ey1 but the status was not changed.
So next I restarted mx_stream on k1imc0 and both k1imc0 and k1ey1 status returned.
I also found a recurrence of status going to '0x4000'.
13:45 k1ey1, k1lsc0, k1imc0 had '0xbad' status, I started mx_stream on k1imc0 and k1lsc0
15:21 k1ex0 and k1prm had '0xbad' status, I started mx_stream on k1prm
15:58 k1ex0 and k1prm had '0xbad' status, I started mx_stream on k1prm
16:08 k1ex0 and k1prm had '0xbad' status, I started mx_stream on k1prm
16:08 k1ex0 and k1prm had '0xbad' status, I stopped recovering work
Now PRM cannot move from SAFE because of BF-H problem reported as klog#20405.
And also, PRM Oplev is out of range in SAFE.
So it's less impact by stopping DAQ than other models.
Appearing 0x4000 in short time (~a few times/min.) was improved by this treatment.
I will continue to monitor the problem of appearing 0xbad (~once per/hrs.).
-----
There is no improvement by following things.
- Stopping -> starting mx_stream on all real-time front-end.
- Restarting daqd processes.
Though this may not be directly related to the increase of errors on mx_stream, we noticed irqbalance doesn't work well with Hyper Threading on Gentoo servers.
It occurs on k1dc0, k1nds0, k1nds1, and k1fw0 and it's better to fix on the next maintenance day.
----
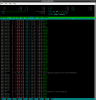
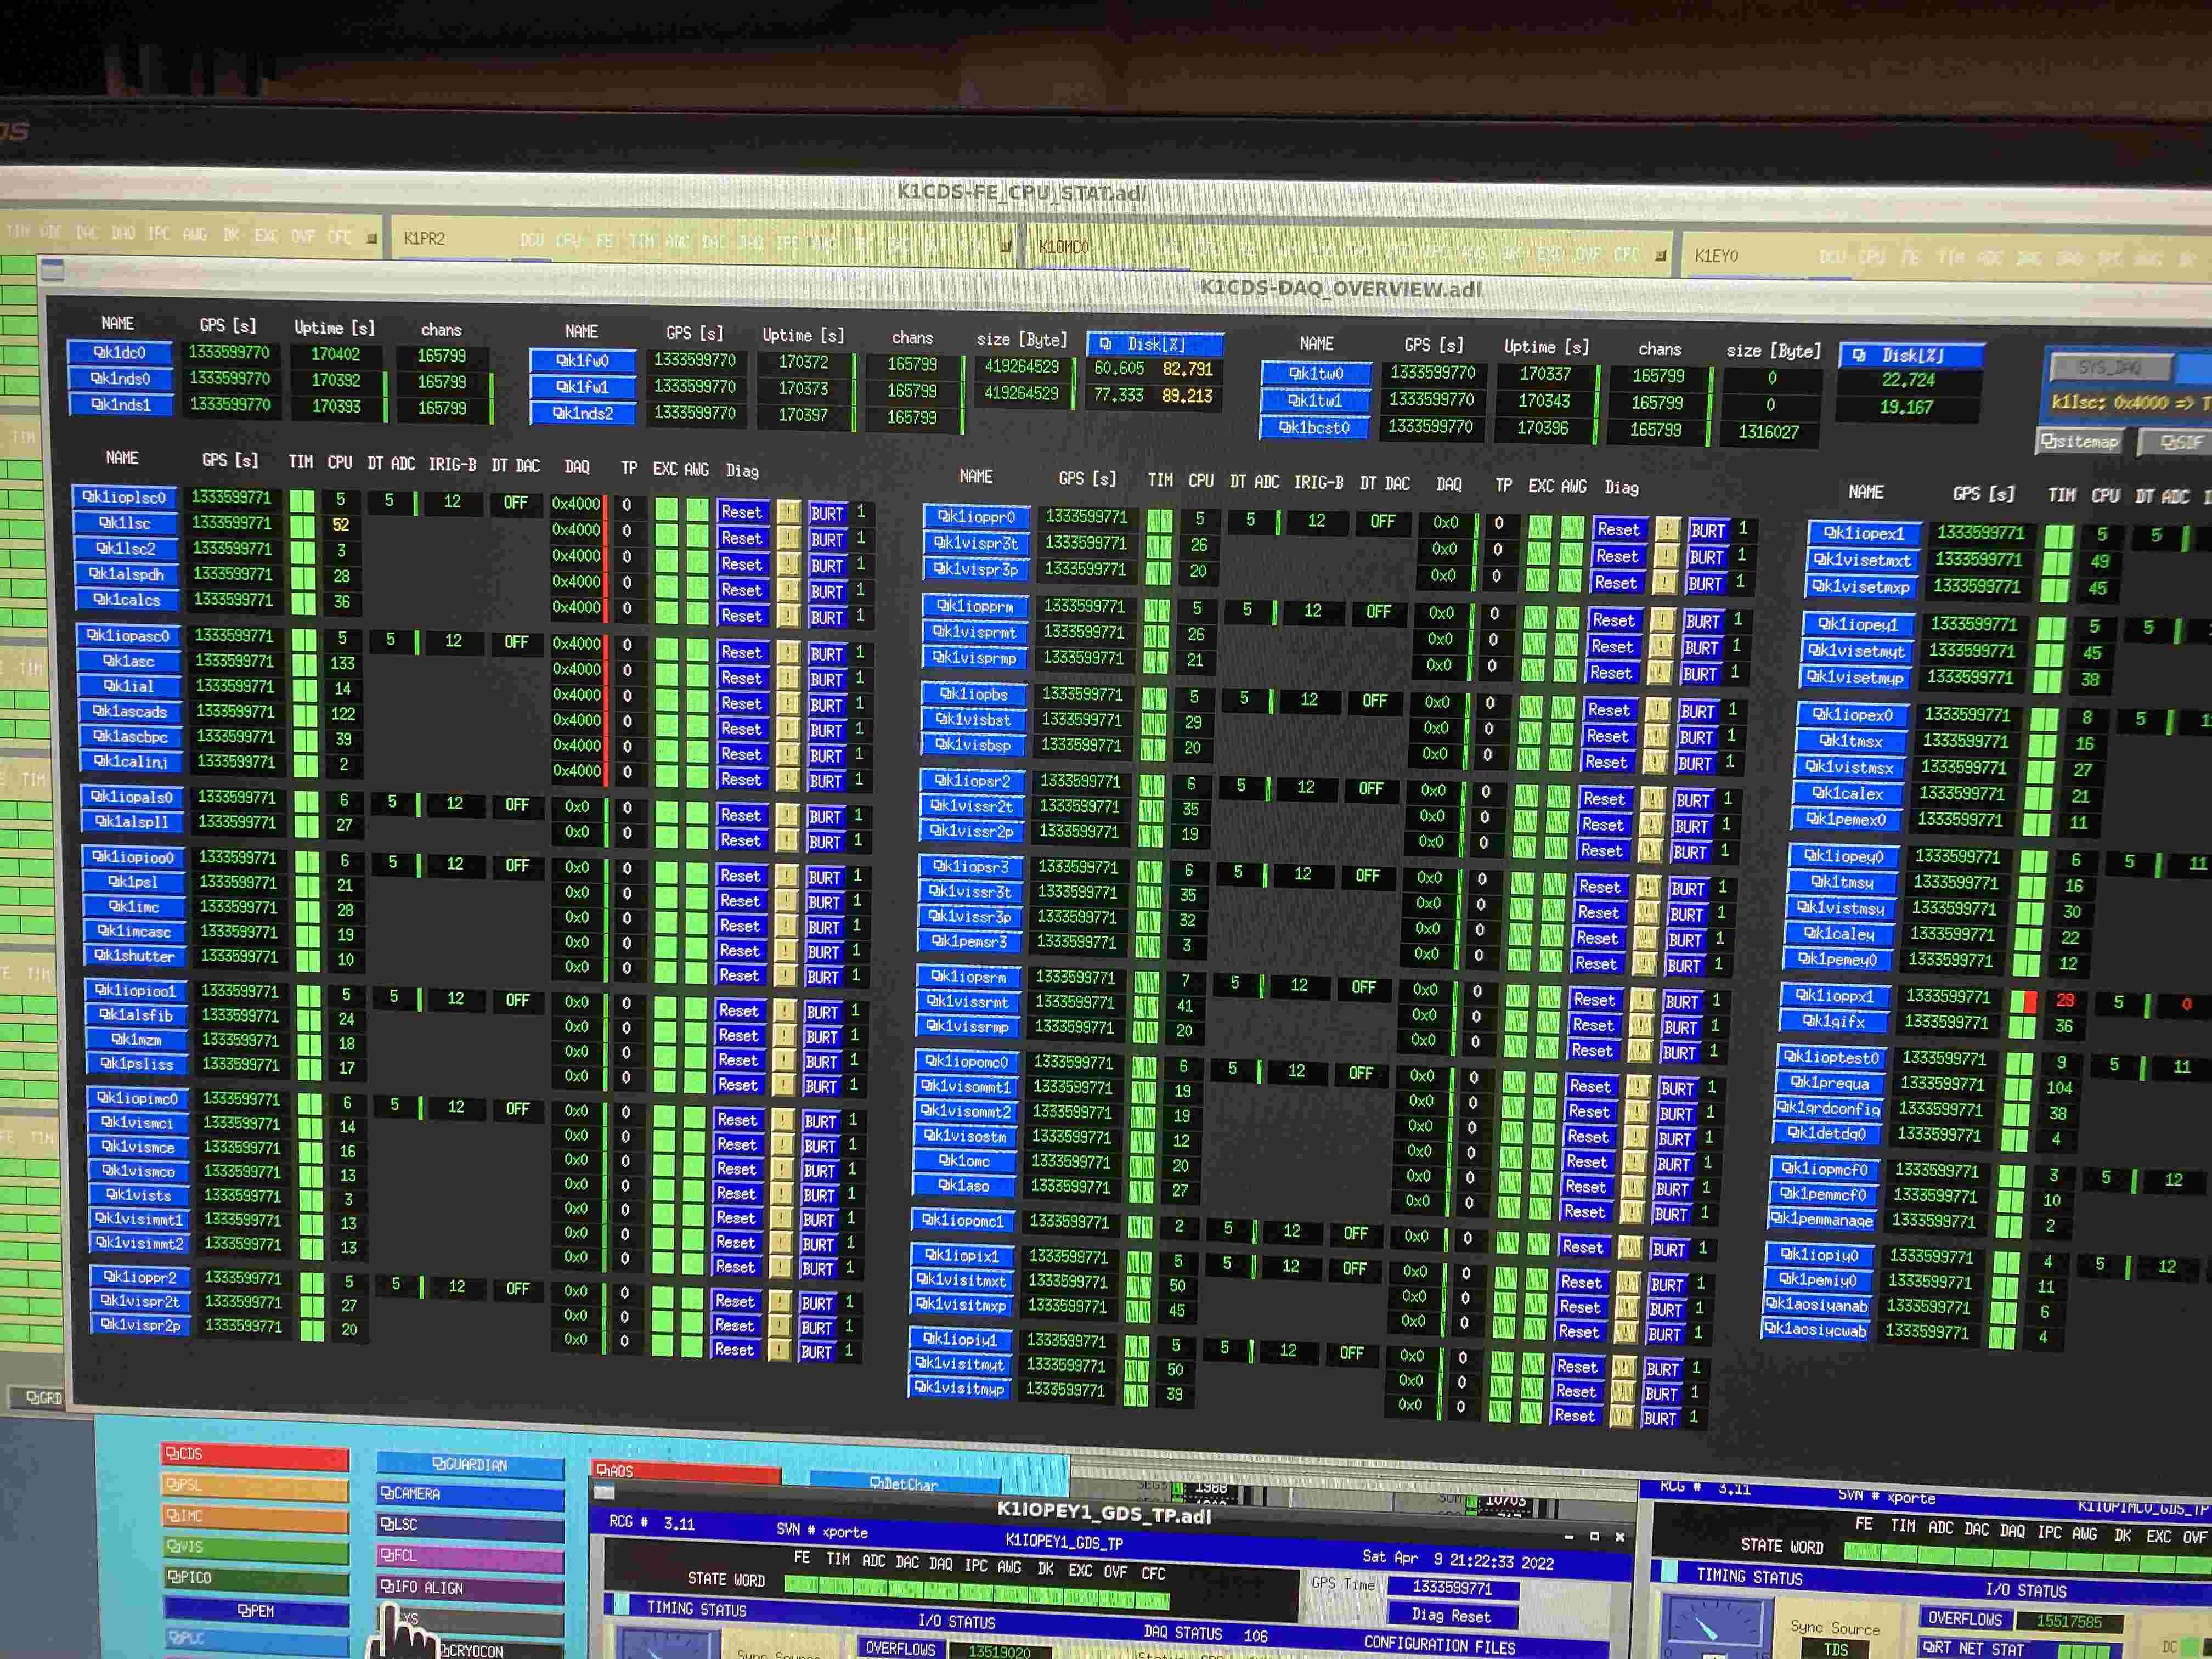
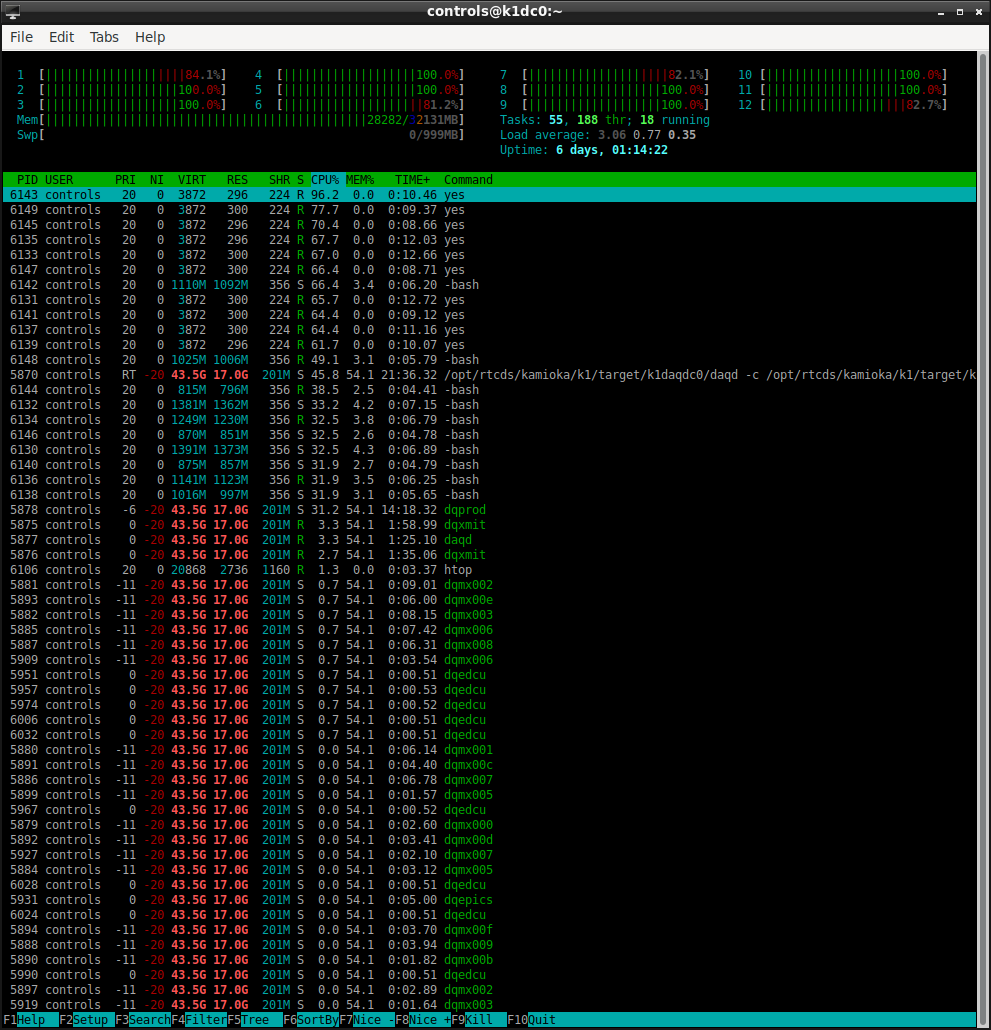
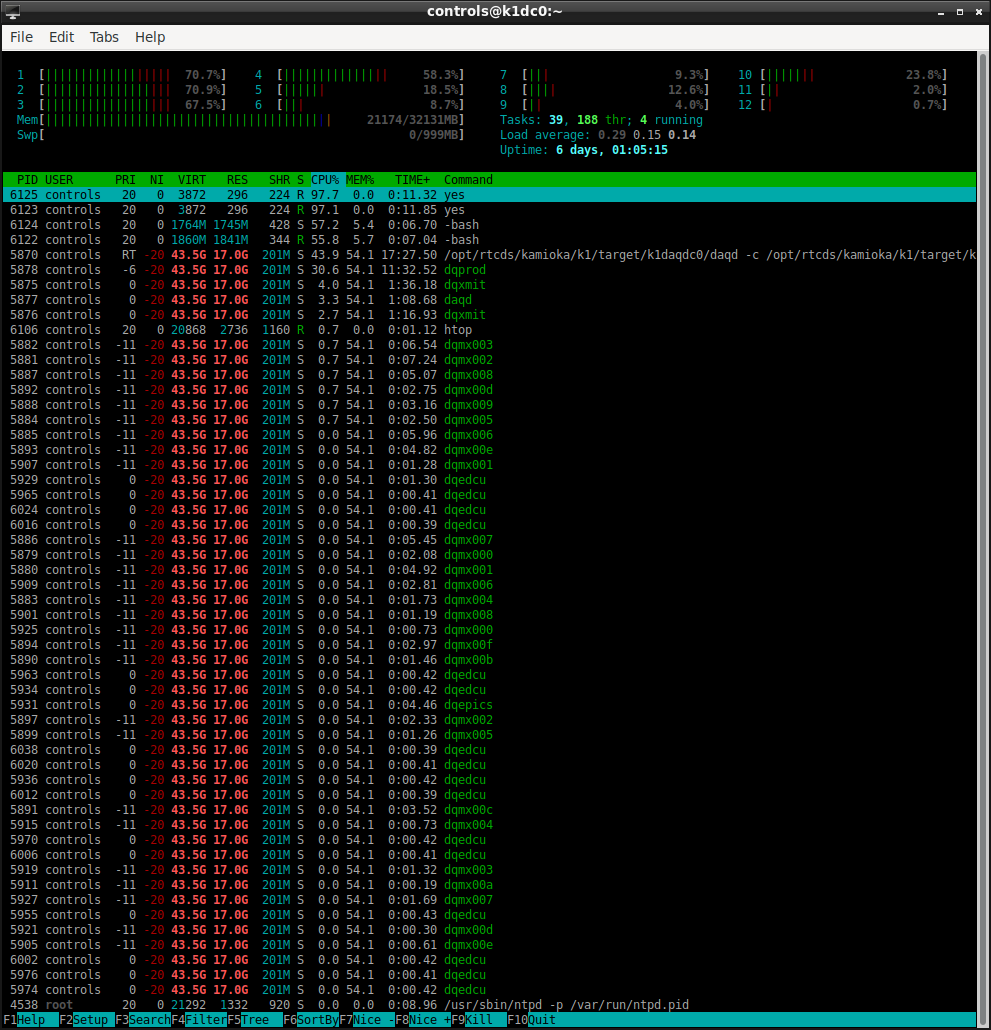
On k1dc0 and other affected servers, all loads are concentrated to CPU0 as follows.
            CPU0       CPU1       CPU2       CPU3       CPU4       CPU5       CPU6       CPU7       CPU8       CPU9       CPU10      CPU11
   0:      55234          0          0          0          0          0          0          0          0          0          0          0   IO-APIC-edge      timer
   8:        140          0          0          0          0          0          0          0          0          0          0          0   IO-APIC-edge      rtc0
   9:          3          0          0          0          0          0          0          0          0          0          0          0   IO-APIC-fasteoi   acpi
  18:     958961          0          0          0          0          0          0          0          0          0          0          0   IO-APIC-fasteoi   ehci_hcd:usb1, ehci_hcd:usb2
  72:   13196807          0          0          0          0          0          0          0          0          0          0          0   PCI-MSI-edge      ahci
  73:         44          0          0          0          0          0          0          0          0          0          0          0   PCI-MSI-edge      ahci
  74:          0          0          0          0          0          0          0          0          0          0          0          0   PCI-MSI-edge      eth0
  75: 2545764089          0          0          0          0          0          0          0          0          0          0          0   PCI-MSI-edge      eth0-TxRx-0
  76: 2749653483          0          0          0          0          0          0          0          0          0          0          0   PCI-MSI-edge      eth0-TxRx-1
  77: 2422420500          0          0          0          0          0          0          0          0          0          0          0   PCI-MSI-edge      eth0-TxRx-2
  78: 2478695662          0          0          0          0          0          0          0          0          0          0          0   PCI-MSI-edge      eth0-TxRx-3
...
On the other hand, k1fw1 and other unaffected servers seem to be able to use all CPU cores as follows.
            CPU0       CPU1       CPU2       CPU3       CPU4       CPU5
   0:        168       5450          0          0          0          0   IO-APIC-edge      timer
   8:          0        154          0          0          0          0   IO-APIC-edge      rtc0
   9:          0          3          0          0          0          0   IO-APIC-fasteoi   acpi
  18:          0          0        183          0          0          0   IO-APIC-fasteoi   ehci_hcd:usb1, ehci_hcd:usb2
  72:          0          0          0          0          0     539268   PCI-MSI-edge      ahci
  73:          0          0          0          0          0         41   PCI-MSI-edge      ahci
  74:          0          0          0          0          0          0   PCI-MSI-edge      eth0
  75:          0          0          0          0          0   15925231   PCI-MSI-edge      eth0-TxRx-0
  76:    5239188          0          0          0          0          0   PCI-MSI-edge      eth0-TxRx-1
  77:   32705758          0          0          0          0          0   PCI-MSI-edge      eth0-TxRx-2
  78:          0   67699476          0          0          0          0   PCI-MSI-edge      eth0-TxRx-3
  79:          0   14661393          0          0          0          0   PCI-MSI-edge      eth0-TxRx-4
  80:          0          0    9937904          0          0          0   PCI-MSI-edge      eth0-TxRx-5
  88:          0          0          0          0          0     962942   PCI-MSI-edge      eth3-TxRx-0
  89:          0          0          0          0          0     952423   PCI-MSI-edge      eth3-TxRx-1
  90:          0          0          0          0          0  736032612   PCI-MSI-edge      eth3-TxRx-2
  91:          0          0          0          0          0     926493   PCI-MSI-edge      eth3-TxRx-3
  92:    1143161          0          0          0          0          0   PCI-MSI-edge      eth3-TxRx-4
  93:     924492          0          0          0          0          0   PCI-MSI-edge      eth3-TxRx-5
...
This issue seem to occur on too old version of Linux. On k1nds2 which is the Debian system, loads are dispersed to all CPU cores even if HT is enabled.
There is a disconnect in the data, but it is probably not a problem to see the vacuum readout in the past data.
DAQ seems to become stable when one of PR2, PR3, PRM and IOO1 is stopped.
Now DAQ process of IOO1 is stopped and PR2, 3, and M are available.
I'll continue to investigation of this issue by focusing on the configuration of PRs and IOO1.
-----
I stopped DAQ process for some of real-time computers one by one.
Only when mx_stream on PR2, PR3, PRM or IOO1 (in C1 rack) is stopped, DAQ becomes stable.
Even when I stopped LSC0, ASC0 (in C1 rack), BS (in C2 rack), SRM, SR2 (in C3 rack), IX1, IY1 (in ICV rack), EX1 or EY1, DAQ didn't become stable.
At first, I doubt the network traffic on the Negear switch in C1 rack. But it doesn't seem to be correct because there is no improvement by stopping LSC0 or ASC0.
I also noticed that when mx_stream was stopped on a certain computer, mx_stream on an other computer worked on the same endpoint is stopped.
This phenomenon occurs on the following combination.
(intentional stopped node) => (accidental stopped node)
- IY1 => IOO0
- ASC0 => SRM
- LSC0 => SR3
- EY1 => IMC0
- EX1 => IOO1
Current endpoint assignment is as follows.
(Number in bracket is KB/s on DAQ stream)
Interaction of stopping mx_stream between the node on same endpoint seems to depend on the total data rate.
| 0 | BS(926) | 1 | SR2(925) | TEST0(1436) | 2 | LSC0(5862) | SR3(944) | 3 | ASC0(4193) | SRM(1059) | 4 | ALS0(1563) | 5 | IX1(1506) | 6 | IOO(2640) | IY1(1486) | 7 | IOO1(1741) | EX1(1553) | 8 | IMC0(1123) | EY1(1552) | 9 | OMC0(1212) | 10 | OMC1(11) | 11 | PX1(948) | 12 | PR2(708) | IY0(1007) | 13 | PR0(701) | MCF0(365) | 14 | PRM(754) | EX0(1526) | 15 | EY0(1282) |
|---|
I stopped daqd several times during 18:50-21:40 for investigation of DAQ instability.
Memo for DGS folks
There was no improvement
- by restarting the MX process on k1dc0,
- by re-arranging the end point assignment.
Even if the end point assignment was changed, the condition that DAQ became stable was not changed.
Only when mx_stream on PR2, PR3, PRM or IOO1 was stopped, DAQ process worked stable.
Tested end point assignment is as follows.
| 0 | SRM(1059) | SR3(944) | |
|---|---|---|---|
| 1 | LSC0(5862) | ||
| 2 | ASC0(4193) | ||
| 3 | IOO(2640) | ||
| 4 | IOO1(1741) | ||
| 5 | ALS0(1563) | ||
| 6 | IX1(1506) | ||
| 7 | IY1(1486) | ||
| 8 | EX1(1553) | OMC1(11) | |
| 9 | EY1(1552) | MCF0(365) | |
| 10 | TEST0(1436) | PRM(754) | |
| 11 | EX0(1526) | PR0(701) | |
| 12 | EY0(1282) | PR2(708) | |
| 13 | OMC0(1212) | PX1(948) | |
| 14 | IMC0(1123) | BS(926) | |
| 15 | IY0(1007) | SR2(925) |
In this assignment, amount of data on each end point is uniformity as much as possible.
So this result suggests that instability problem of DAQ isn't caused by ununiformity of load on a part of end points.
On the other hand, a number of combinations of two models which become 0xbad at the same time is decreased in this assignment.
We may need to consider the amount of data on each real-time front-end.
After today's investigation, I reverted the end point assignment for another tests which will be done tomorrow or later.
For the DAQ stability test, daqd was restarted several times in 20:00-21:50 and 24:30-25:30.
-----
We found obsolete EPICS channels which were listed as slow DAQ channels (See also the attachment).
I removed these channels and restarted daqd.
But instability of DAQ wasn't improved by this change...
Abstract
- Most significant cause is the network traffic of the DAQ switch in the C1 rack.- DAQ now becomes stable with running all real-time models by connecting some RTFEs in the C1 rack to the DAQ switch in the B1 rack directly.
- As a long-term solution, we should buy and replace a DAQ switch as more faster one in order to keep a simple cabling in each rack.
- HT was disabled on k1dc0. It's not effective but seems to be better.
Details
At first, I disabled the HT on k1dc0 in order to improve the load balancing of I/O interruption reported as klog#20464.This was not effective for instability of the DAQ system. But I/O interruption became processed on multi-cores. This configuration seems to be better to apply for other DAQ nodes. But today, I have no enough time and it will be done in next maintenance day.
We knew that DAQ became stable by stopping k1ioo1, k1pr2, k1pr3 or k1prm as a temporal solution. Today I enabled mx_stream only on k1ioo1, k1pr2, k1pr3 and k1prm and the timing error didn't occur. After then, when mx_stream on k1imc0 or k1ioo was enabled, timing error appeared. On the other hand, timing error didn't appeared in spite of enabling on k1lsc0 or k1asc0.
Note, all of these models are installed in the C1 rack and connected to a same network switch.
Because of this fact, I had thought it had not been a problem on the network traffic in the C1 rack. In fact, sum of data rate of all models in C1 rack is ~18Mbps (See also klog#20474). LSC and ASC models are the most and the 2nd most large models in KAGRA, respectively.
But, because the problem seemed to lie in the C1 rack, I tried to disconnect some RTFEs from the DAQ switch in C1 rack and to directly connect them to the DAQ switch in the B1 rack which was the upstream of the C1 rack. Then error rate drastically decreased (once per minute -> once per a few tens of minutes) when k1ioo, k1ioo1, k1imc0, k1pr2, k1pr3, or k1prm was connected to the B1 rack. But connecting k1lsc or k1asc was no effect.
Now k1lsc and k1asc are not used and many channels are always 0. So the compression of data works effectively and the traffic by k1lsc and k1asc may be not so large compared with the model size.
Finally, k1ioo, k1ioo1, k1imc in the C1 rack and k1bs in the C2 rack were connected to the DAQ switch in the B1 rack directly.
There is no error in recent several hrs.
-----
HT
enabled
=> FW0, NDS0, NDS1
disabled
=> DC0, FW1, TW0, TW1, BCST0
DC0:/etc/intrrupt
enabled
=> Only on CPU0 (CPU0-11)
disabled
=> Only on CPU0-2, 5 (CPU0-5)
[Ikeda, Yamamoto-san, Oshino-san]
This is a continuation of K-Log#20498.
[Work Details]
1. Replacement of LAN cables in DGS network
The cables were replaced with defective cables in the following racks.
N1, B1, C1, C3, and c4 Racks
The criteria used to determine a cable as defective is a non-twisted cable as indicated by the results of the K-Log#20008 survey.
2. all of K-Log#20498's connections have been restored.
> Finally, k1ioo, k1ioo1, k1imc in the C1 rack and k1bs in the C2 rack were connected to the DAQ switch in the B1 rack directly.
Confirmation Result:
A DAQ error (0x4000) was observed to occur approximately once every minute.
No improvement was observed.
3. The DAQ network switch was connected in 3 levels, but the connection was changed to 2 levels this time.
DAQ in racks C1, C2, and C3 are connected to the DAQ switch in rack B1 with a metal cable.
k1dc0, both ends and two fronts, and X500 were changed to be connected directly to the switch in the B1 rack via optical.
Verification Result :
There was no improvement in the DAQ error (0x4000).
4. After the work, we reverted some error countermeasures for K-Log#20498 connection.
> Finally, k1ioo, k1ioo1, k1imc in the C1 rack and k1bs in the C2 rack were connected to the DAQ switch in the B1 rack directly.
Finally, only k1ioo, k1ioo1, and k1imc in the C1 rack were connected to the B1 DAQ Rack directly.
The k1bs in the C2 rack was not returned.
Check Result :
We confirmed that the error did not occur as frequently as before we started the work.
We will see how it goes until tomorrow.
Following list shows errors after some works.
- reduce trafic on C1 rack
- disalbe HT
- fix duplication errors of EPCIS gateway
-----
- 2022-04-18 09:40:14.140585
- 2022-04-18 09:40:15.137766 (1s)
- [EP8] k1vists (IMC0)
- 2022-04-18 21:56:15.718734 [klog#20516: IY1 hang-up]
- 2022-04-18 22:10:04.642056 (829s)
- 2022-04-19 10:32:42.770615
- 2022-04-19 10:32:43.770607 (1s)
- [EP1] k1sdfmanage (TEST0)
- [EP2] k1pemsr3 (SR3), k1calcs (LSC0)
- [EP3] k1ial (ASC0)
- [EP8] k1imcasc (IMC0)
- [EP12] k1aosiycwab (IY0)
- 2022-04-20 04:54:02.780495
- 2022-04-20 04:54:03.770967 (1s)
- [EP8] k1vists (IMC0)
- [EP12] k1ioppr2 (PR2)
- 2022-04-20 09:29:22.711151
- 2022-04-20 09:29:23.713527 (1s)
- [EP1] k1sdfmanage (TEST0)
- [EP2] k1calcs (LSC0)
- [EP3] k1ial (ASC0)
- [EP8] k1imcasc (IMC0)
- 2022-04-21 07:50:14.279463
- 2022-04-21 07:50:15.319849 (1s)
- [EP13] k1pemmanage (MCF0)
- [EP14] k1tmsx (EX0)
- [EP7] k1iopioo1 (IOO1)
- [EP4] k1alspll (ALS0)
- 2022-04-21 08:52:32.721505
- 2022-04-21 08:52:33.716897 (1s)
- [EP6] k1shutter (IOO)
[Ikeda, Oshino-san, (remote)Yamamoto-san]
This is last Friday's work.
This is a continuation of K-Log#20547.
Work contents
1. C1 network SW was replaced with another SW (M100-26G V2H2).
Then, LAN connection was restored to the state where the error (0x4000) occurred.
Check result :
There was no improvement in DAQ error (0x4000).
2. Connected all RTPCs (C1, C2, C3) directly to the SW of NETGEAR to which k1dc0 is connected.
Confirmation Result :
There was no improvement of DAQ error (0x4000).
Error Description:
k1iopomc0 is 0x4000
k1visostm is 0x4000
k1ioppr0 is 0x4000
k1visommt2 is 0x4000
k1vispr3p is 0x4000
k1omc is 0x4000
k1pemiy0 is 0x4000
k1vispr3t is 0x4000
k1vistmsx is 0x4000
k1pemex0 is 0x4000
k1visommt1 is 0x4000
k1iopex0 is 0x4000
k1vispr2t is 0x4000
k1iopmcf0 is 0x4000
k1calex is 0x4000
k1iopbs is 0x4000
k1calext is 0x4000
k1visbsp is 0x4000
k1aosiyanab is 0x4000
k1aosiycwab is 0x4000
k1tmsx is 0x4000
k1visbst is 0x4000
k1vispr2p is 0x4000
k1alspll is 0x4000
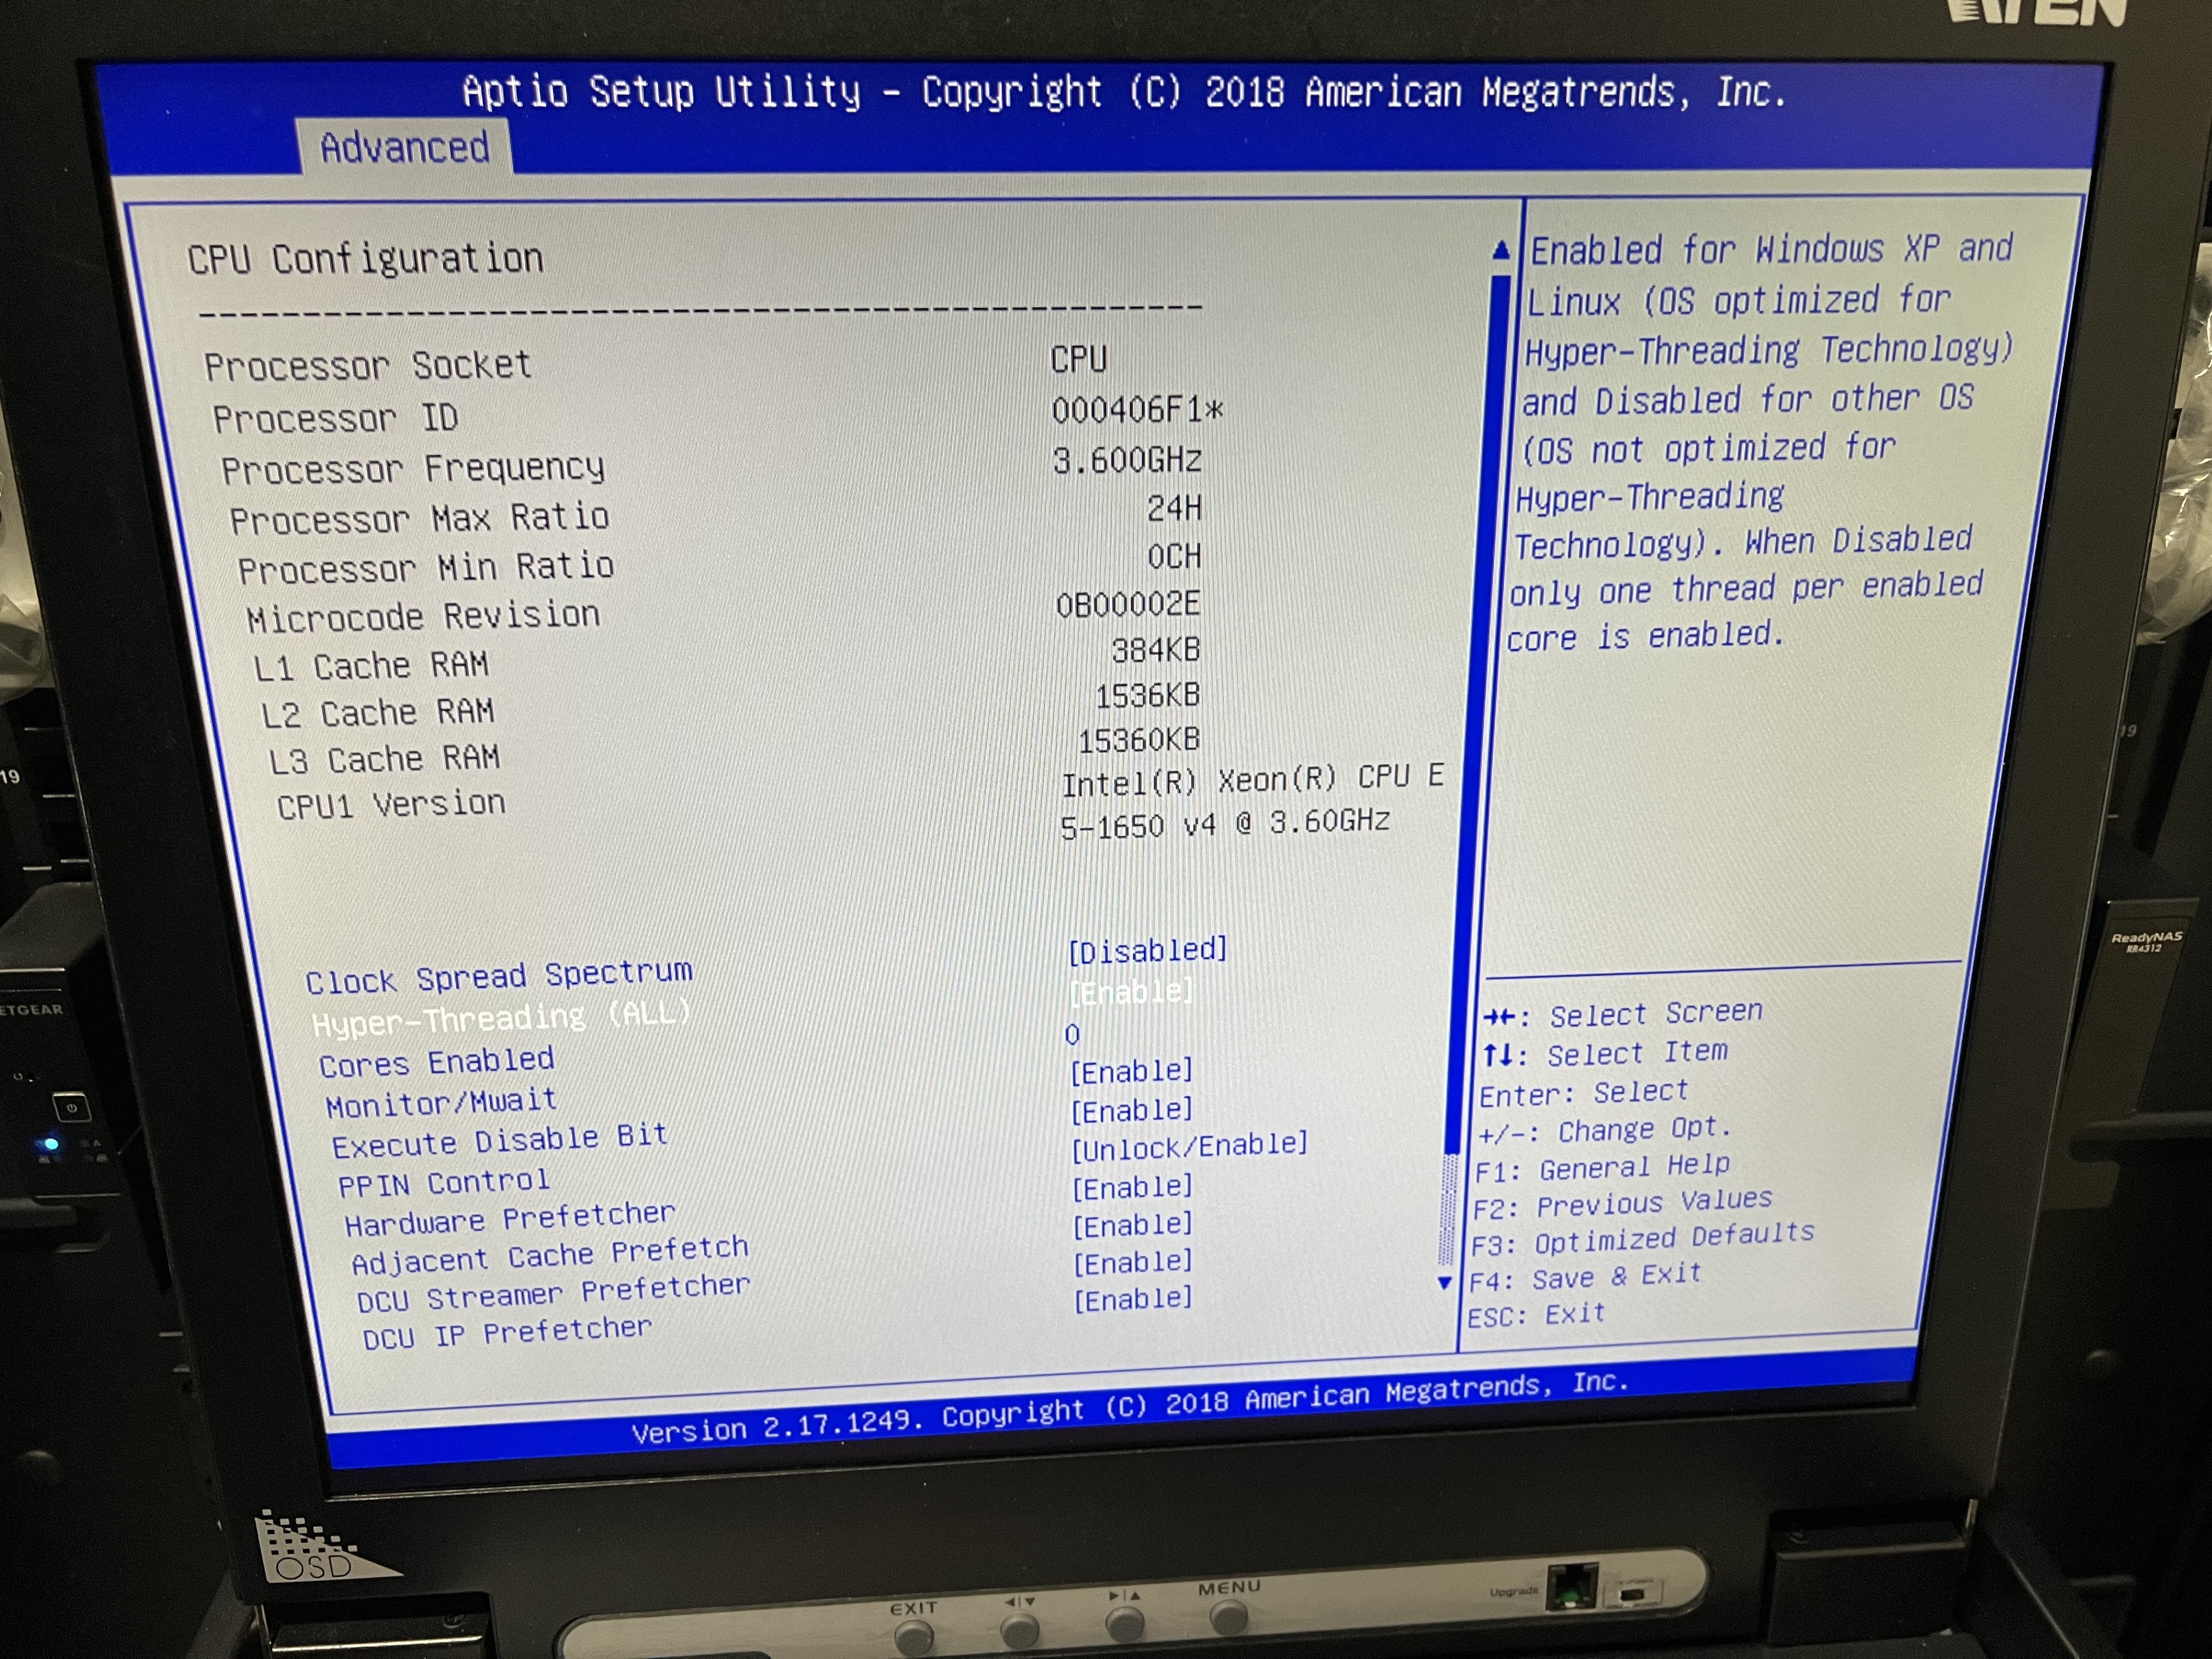
3. The CPU settings were checked in the BIOS settings of k1dc0.
Check Result :
There was no setting that lowered the CPU clock.
4.Finally, I restored all connections to K-Log#20498.
> Finally, k1ioo, k1ioo1, k1imc in the C1 rack and k1bs in the C2 rack were connected to the DAQ switch in the B1 rack directly.
Ikeda, advice:Yamamoto-san, Oshino-san
This is to address the issue of DAQ TimingError(0x4000),0xbad.
K-Log#20435,19393,18668,17079 are relevant.
Summary
I was checking the DAQ logs and found some errors.
$ cat /opt/rtcds/kamioka/k1/target/fb/logs/daqd.dc0.log
Some excerpts
[Thu Apr 21 19:39:04 2022] mx receiver 001 thread priority error Operation not permitted
[Thu Apr 21 19:39:04 2022] mx receiver 004 thread priority error Operation not permitted
[Thu Apr 21 19:39:04 2022] mx receiver 007 thread priority error Operation not permitted
mx receiver 00a thread priority error Operation not permitted
Investigation
After investigating the cause of the error, it was found that the error occurred because the Linux scheduling policy did not accept the intended value of RCG.
Checking the $ ulimit -a log, we found that real-time was set to 0.
Also, dc0 was missing a line that changes the priority of daqd at startup.
Actions taken
The configuration was changed so that the FIFO settings are processed.
dc0,nds0,nds1,nds2,fw0,fw1,tw0,tw1,bcst0
Edit /etc/security/limits.conf and restart
controls - rtprio 99
controls - nice -20
Log in to each server and do the following
$ sudo emacs inittab
Comment out daq.
$ sudo kill -HUP 1
Stop daq
$ sudo emacs inittab
Revert daq
$ sudo kill -HUP 1
Restart DAQ
nds2 is not a kill.
sudo systemctl restart k1nds2daqd.service
sudo systemctl restart k1nds2nds.service
For k1dc0, the following changes were also made because it is necessary to change the nice value of daqd.
Rewrite start_daqd.dc0.inittab and restart as above
$ sudo emacs /opt/rtcds/kamioka/k1/target/fb/start_daqd.dc0.inittab
# Execute frame builder
exec su controls -c '/opt/rtcds/kamioka/k1/target/k1daqdc0/daqd -c /opt/rtcds/kamioka/k1/target/k1daqdc0/daqdrc' > /opt/rtcds/kamioka/k1/target/fb/logs/daqd.dc0.log 2>& 1 &
PID=$!
sleep 1
LISTPID=$(pidof daqd); PIDS=(${LISTPID// / }); for val in "${PIDS[@]}"; do sudo chrt -f -p 99 ${val}; done
wait $PID
Confirmation Result
Confirm that dc0,nds0,nds1,fw0,fw1,tw0,tw1,bcst0 have been changed normally and FIFOed.
(Reference) In the case of k1dc0, it is confirmed that DAQ related threads are FF and RTPRIO of daqd is 99.
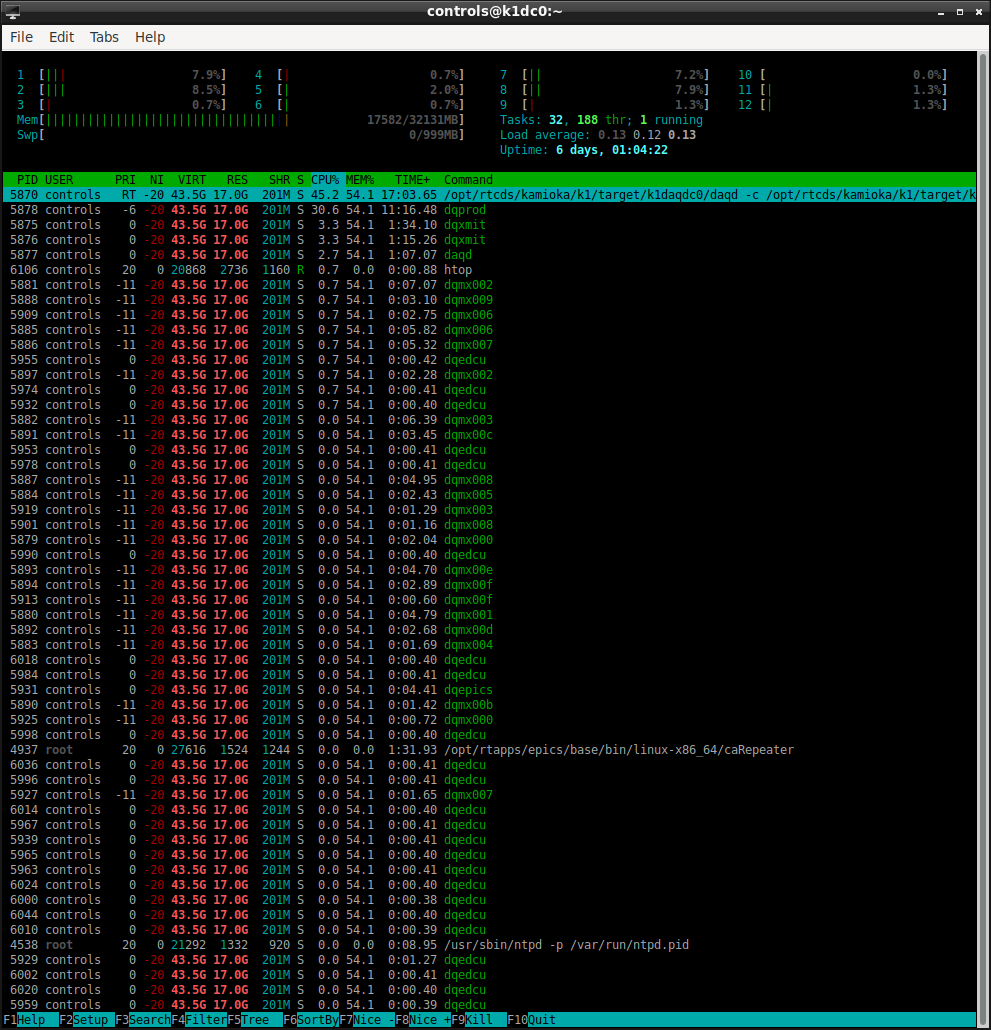
$ ps x -L -o comm,pid,cls,rtprio,priority,nice,user
COMMAND PID CLS RTPRIO PRI NI USER
sshd 629 TS - 20 0 controls
bash 630 TS - 20 0 controls
su 2947 TS - 20 0 controls
daqd 2949 FF 99 -100 - controls
dqpmain 2949 TS - 0 -20 controls
dqxmit 2949 TS - 0 -20 controls
dqxmit 2949 TS - 0 -20 controls
daqd 2949 TS - 0 -20 controls
dqprod 2949 FF 5 -6 - controls
dqmx000 2949 FF 10 -11 - controls
dqmx001 2949 FF 10 -11 - controls
dqmx002 2949 FF 10 -11 - controls
dqmx003 2949 FF 10 -11 - controls
dqmx004 2949 FF 10 -11 - controls
dqmx005 2949 FF 10 -11 - controls
dqmx006 2949 FF 10 -11 - controls
dqmx007 2949 FF 10 -11 - controls
dqmx008 2949 FF 10 -11 - controls
dqmx009 2949 FF 10 -11 - controls
dqmx00a 2949 FF 10 -11 - controls
dqmx00b 2949 FF 10 -11 - controls
dqmx00c 2949 FF 10 -11 - controls
dqmx00d 2949 FF 10 -11 - controls
dqmx00e 2949 FF 10 -11 - controls
dqmx00f 2949 FF 10 -11 - controls
dqmx001 2949 FF 10 -11 - controls
dqmx001 2949 FF 10 -11 - controls
dqmx004 2949 FF 10 -11 - controls
dqmx004 2949 FF 10 -11 - controls
dqmx007 2949 FF 10 -11 - controls
dqmx007 2949 FF 10 -11 - controls
dqmx00a 2949 FF 10 -11 - controls
dqmx00a 2949 FF 10 -11 - controls
dqmx00d 2949 FF 10 -11 - controls
dqmx00d 2949 FF 10 -11 - controls
dqmx000 2949 FF 10 -11 - controls
dqmx000 2949 FF 10 -11 - controls
dqmx005 2949 FF 10 -11 - controls
dqmx005 2949 FF 10 -11 - controls
dqmx009 2949 FF 10 -11 - controls
dqmx009 2949 FF 10 -11 - controls
dqmx00e 2949 FF 10 -11 - controls
dqmx00e 2949 FF 10 -11 - controls
dqmx003 2949 FF 10 -11 - controls
dqmx003 2949 FF 10 -11 - controls
dqmx00b 2949 FF 10 -11 - controls
dqmx00b 2949 FF 10 -11 - controls
dqmx002 2949 FF 10 -11 - controls
dqmx002 2949 FF 10 -11 - controls
dqmx00c 2949 FF 10 -11 - controls
dqmx00c 2949 FF 10 -11 - controls
dqmx008 2949 FF 10 -11 - controls
dqmx008 2949 FF 10 -11 - controls
dqmx00f 2949 FF 10 -11 - controls
dqmx00f 2949 FF 10 -11 - controls
dqmx006 2949 FF 10 -11 - controls
dqmx006 2949 FF 10 -11 - controls
dqedcu 2949 TS - 0 -20 controls
dqedcu 2949 TS - 0 -20 controls
dqedcu 2949 TS - 0 -20 controls
dqepics 2949 TS - 0 -20 controls
dql8087 2949 TS - 0 -20 controls
dqedcu 2949 TS - 0 -20 controls
dqedcu 2949 TS - 0 -20 controls
dqedcu 2949 TS - 0 -20 controls
dqedcu 2949 TS - 0 -20 controls
dqedcu 2949 TS - 0 -20 controls
dqedcu 2949 TS - 0 -20 controls
dql8088 2949 TS - 0 -20 controls
dqedcu 2949 TS - 0 -20 controls
The following is omitted.
The setting of $ ps x -L -o comm,pid,cls,rtprio,priority,nice,user was not reflected.
The cause is unknown.
[Ikeda, Yasui-san]
Summary
This is a continuation of the DAQ Timig Error investigation.
In the investigation of K-Log#20464, I tested the possibility that the overall efficiency might be higher if HyperThread is Disable.
However, I am not sure of the effect at present.
This may be a bit out of date, but T1500227 5.3.2 states that Hyperthreading - Enabled (DAQ code is multi-threaded).
Correspondence
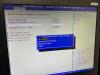
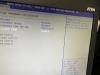
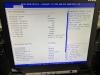
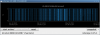
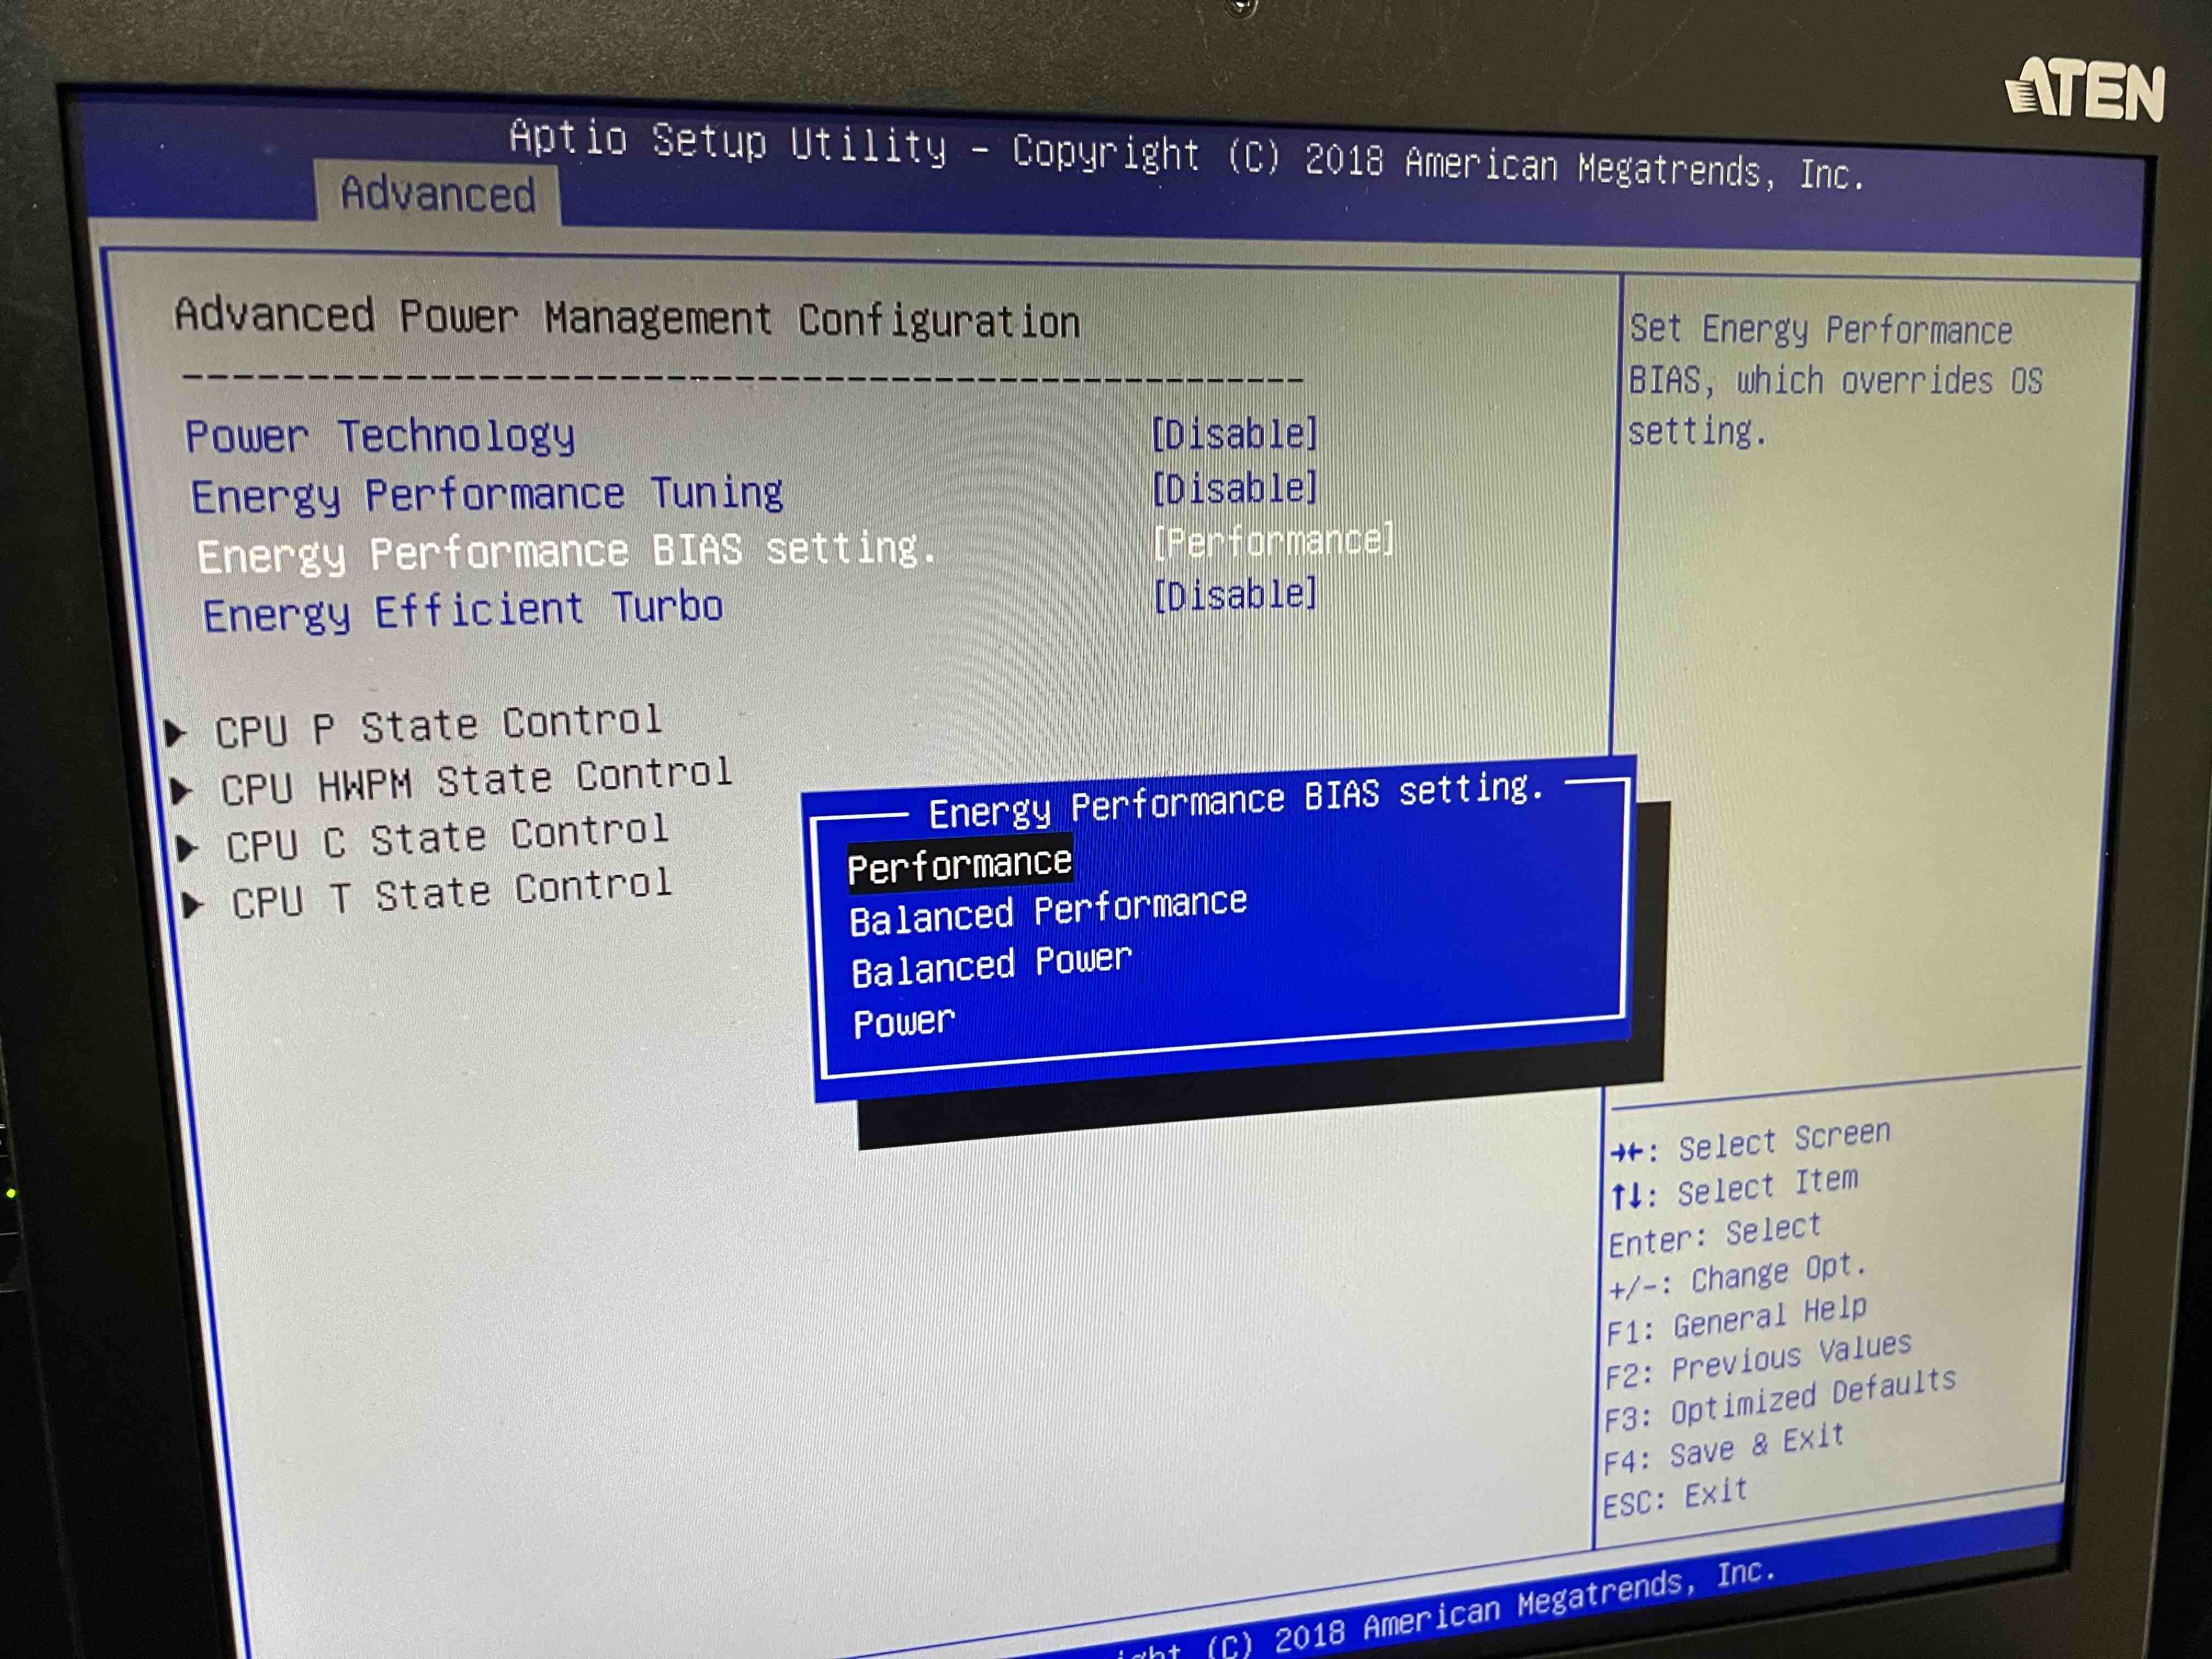
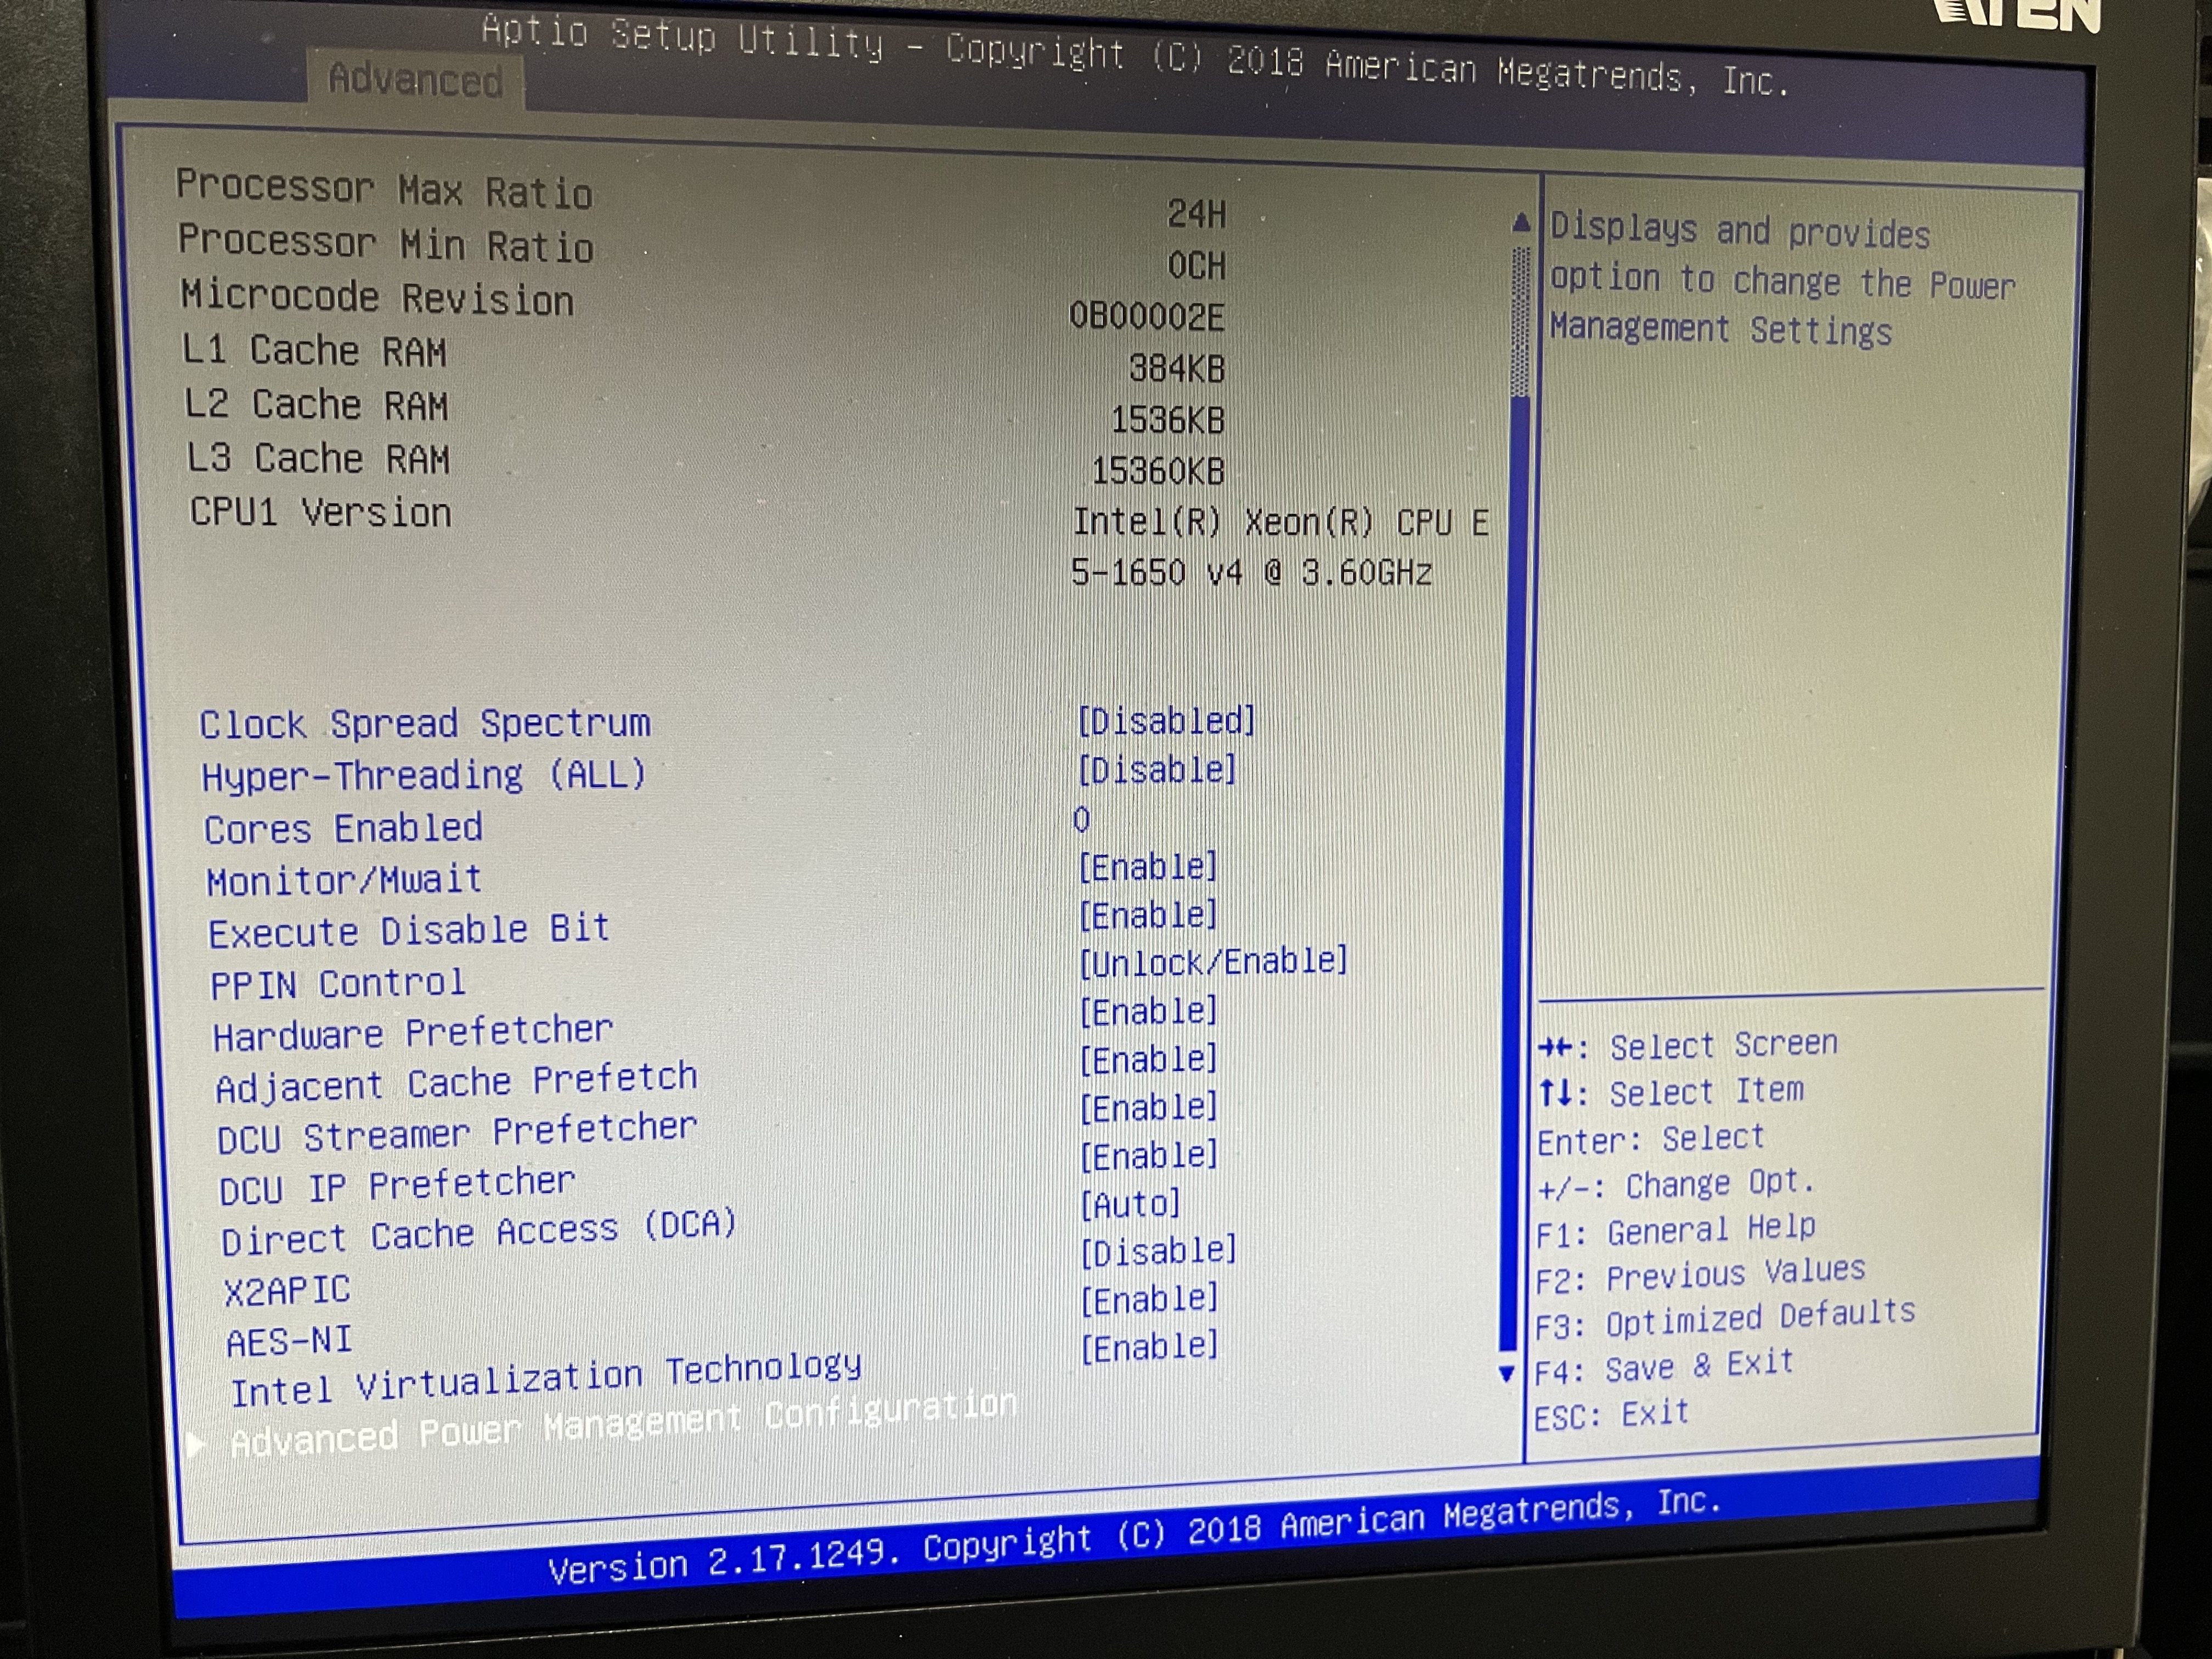
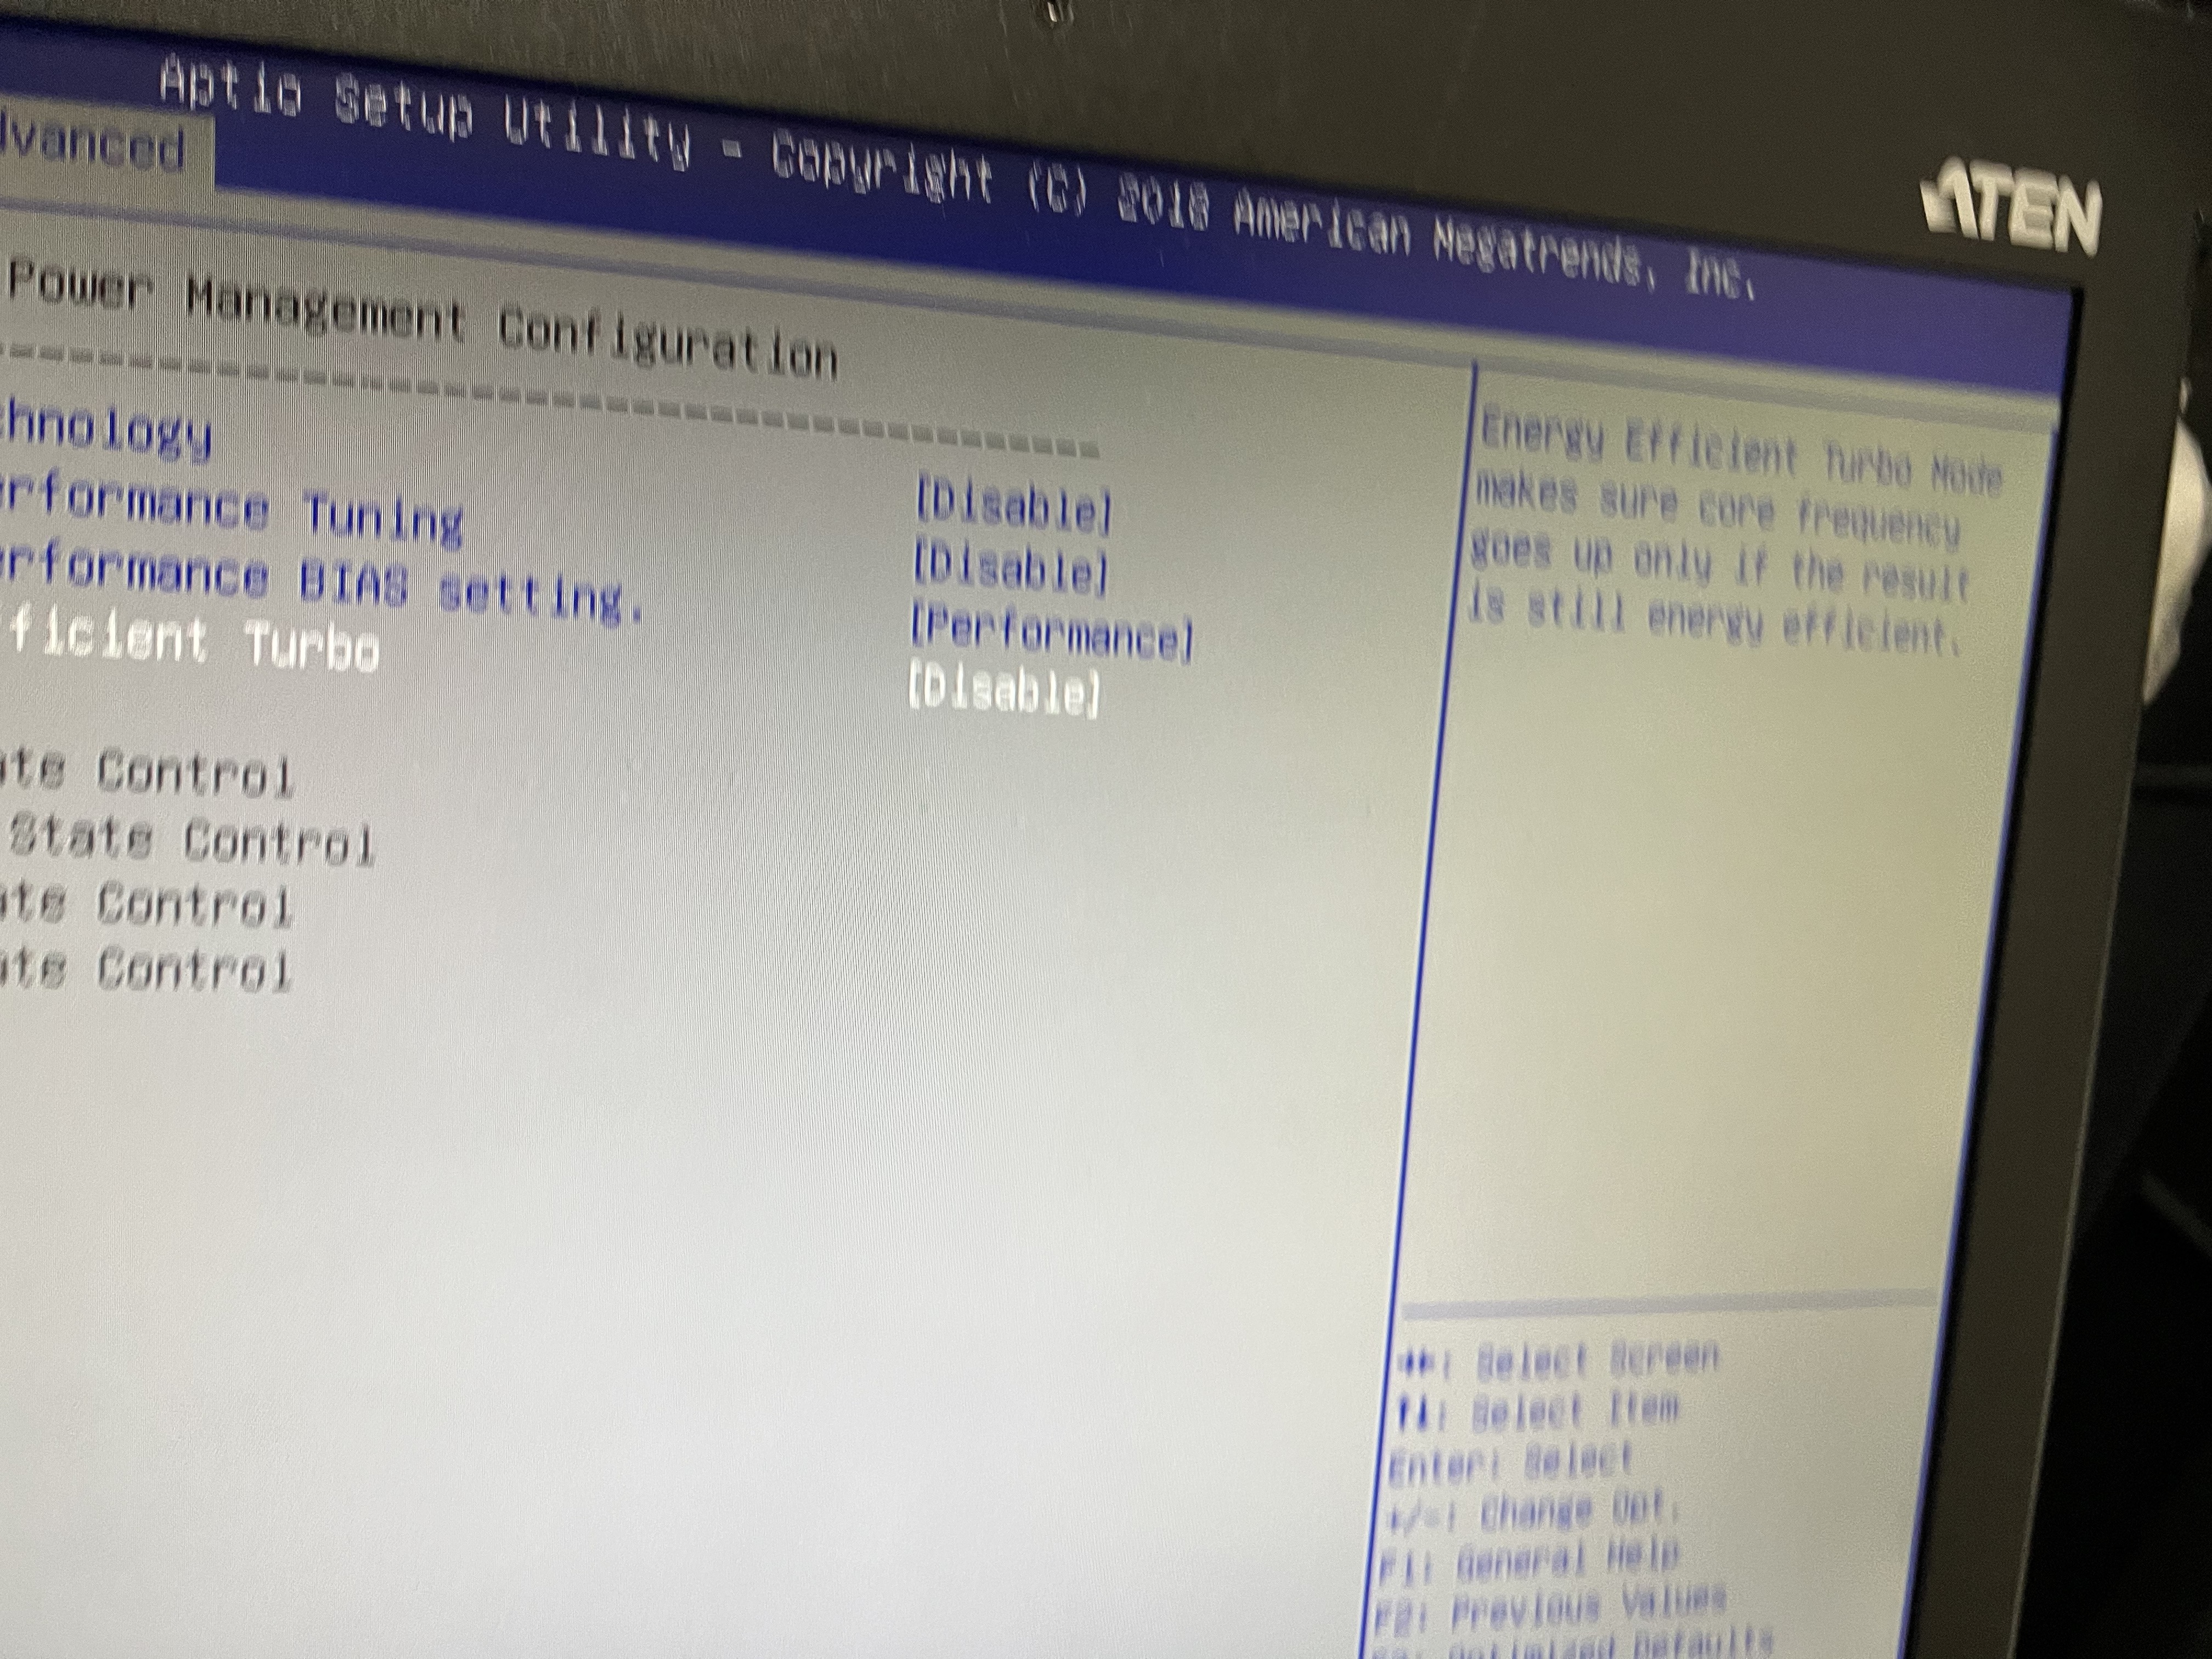
We changed the HyperThread setting of k1dc0 to Enable in the BIOS.(Fig.1)
Next, We tried the method that caused the DAQ error in K-Log#20563 last time.
> 2. Connected all RTPCs (C1, C2, C3) directly to the SW of NETGEAR to which k1dc0 is connected.
Connected directly to the same SW as k1dc0 but the error frequency was low and improved.
Before these changes, the frequency of occurrence was several times/day.
We will leave it as is for the rest of the week.
This is a continuation of K-Log#20816.
1,A high load test to DAQ k1dc0 was performed to investigate DAQ Timing error.
The purpose is to check if k1dc0 drops data when a high load is applied.
The following command was executed to apply CPU load.
/dev/null < $(yes) &
About 1 or 2 at the same time
=> No data drops or other problems occurred.
10 at the same time
=> daqd process hung.
Even if CPU load was increased, especially 0x4000 error did not occur.
2. Investigate the effect of mx_stream delay on FE side
Currently, mx_stream is operating with the initial priority value (nice=0).
Check to see if an error occurs when priority is changed.
For comparison, only 0 and 1 of EndPoint(ep) were changed locally.
Target :
ep0: bs
ep1: sr2, test0
Steps:
$ ps -ax -o comm,cls,pid,rtprio,priority,nice
(excerpt)
COMMAND CLS PID RTPRIO PRI NI
mx_stream TS 12022 - 20 0
$ sudo renice -n -20 -p 12022
$ ps -ax -o comm,cls,pid,rtprio,priority,nice
(excerpt)
COMMAND CLS PID RTPRIO PRI NI
mx_stream TS 12022 - 0 -20
=> Check that NI is changing, PID varies by FE.
[Ikeda, Yamamoto-san]
This is a continuation of K-Log#20895.
Background
Currently, the frequency of DAQ Timing error (0x4000) occurs several times/day.
With the goal of improving this, we will try a different setting than the LIGO setting.
Try the following measures
1. Change the correspondence of changing daqd to FIFO, which is done in k1dc0, to fw0, fw1, tw0, tw1, nds0, nds1, and bcst, respectively.
Currently, the default value is TS.
Leave nds2 as it is for now.
2. Result of K-Log#20895-2
$ sudo renice -n -20 -p 12022
There was no significant result in this response, so I'll change FE's mx_stream to FIFO as well.
mx_stream is currently the default in TS.
Changes
1.Change daqd of fw0,fw1,tw0,tw1,nds0,nds1,bcst from TS to FIFO.
Refer to dc0 for details.
/opt/rtcds/kamioka/k1/target/fb/start_daqd.dc0.inittab
exec su controls -c '/opt/rtcds/kamioka/k1/target/k1daqdc0/daqd -c /opt/rtcds/kamioka/k1/target/k1daqdc0/daqdrc' > /opt/rtcds/kamioka/k1/target/fb/logs/daqd.dc0.log 2>& 1 &
PID=$!
sleep 1
LISTPID=$(pidof daqd); PIDS=(${LISTPID// / }); for val in "${PIDS[@]}"; do sudo chrt -f -p 99 ${val}; done
wait $PID
The file was backed up before the change.
/opt/rtcds/kamioka/k1/target/fb/archive/20220610/
2. Change mx_stream to FIFO (add chrt).
start-stop-daemon --start --quiet -b -m --pidfile /var/log/mx_stream.pid --exec /opt/rtcds/kamioka/k1/target/fb/mx_stream -- -e 0 -r "$epnum" -s "$sys" -d k1dc0:0 -w 0 -W 0 -l /opt/rtcds/kamioka/k1/target/fb/mx_stream_logs/$hostname.log
chrt -f -p 99 `cat /var/log/mx_stream.pid` (in Japanese)
Work procedure
HDD replacement of k1boot was done in K-Log#21012.
However, after updating the FE model file and restarting the model, an error occurred that FS could not write.
Therefore, all FEs need to be rebooted.
We proceeded with the following steps.
While performing the restart, other actions were also performed.
1. Stopped or restarted FE.
Stop all but both ends: sudo shutdown -h now
Restart both ends: sudo shutdown -r now
(k1ex1,k1ey1,k1ex0,k1ey0,k1px1)
2.FE,DAQ maintenance was done. (Yamamoto-san)
DAQ was changed to FIFO. (Ikeda)
3.After restarting all FE and DAQ, changed mx_stream to FIFO and restarted DAQ.
This is a continuation of the DAQ Timing Error investigation.
Overview.
The swapfile setting is enabled on each of the DAQ servers.
We believe that the required RAM capacity is sufficient for each server, so we check the situation by eliminating the swapfile.
In k1fw0 and k1fw1, the error packets are generated in daqd.fw*.log, so we check the frequency of occurrence here as well.Ask for retransmission of 5 packets; port 7097
Work
1. Check existence of swap file$ free
2. Check swap settings$ sudo swapon -s
Confirm the output swap partition.
3. comment out the swap partition in /etc/fstab
Backup of original file: /etc/fstab.20220624
ex. #/swapfile none swap sw 0 0
(do not delete the partition so that it can be recovered)
Swap partition name :
k1dc0, k1fw1, k1tw0, k1tw1, k1nds0, k1nds1, k1bcst0: /swapfile
k1fw0: /dev/sda2
4. Reboot $ sudo shutdown -r now
Target
k1dc0, k1fw0, k1fw1, k1tw0, k1tw1, k1nds0, k1nds1, k1bcst0
k1nds2 is not changed.
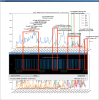
DAQ Error Log Analysis
DAQ Timing Error.
Check the results of countermeasures against this error.
Analyze the DAQ log and check against the DAQ error.
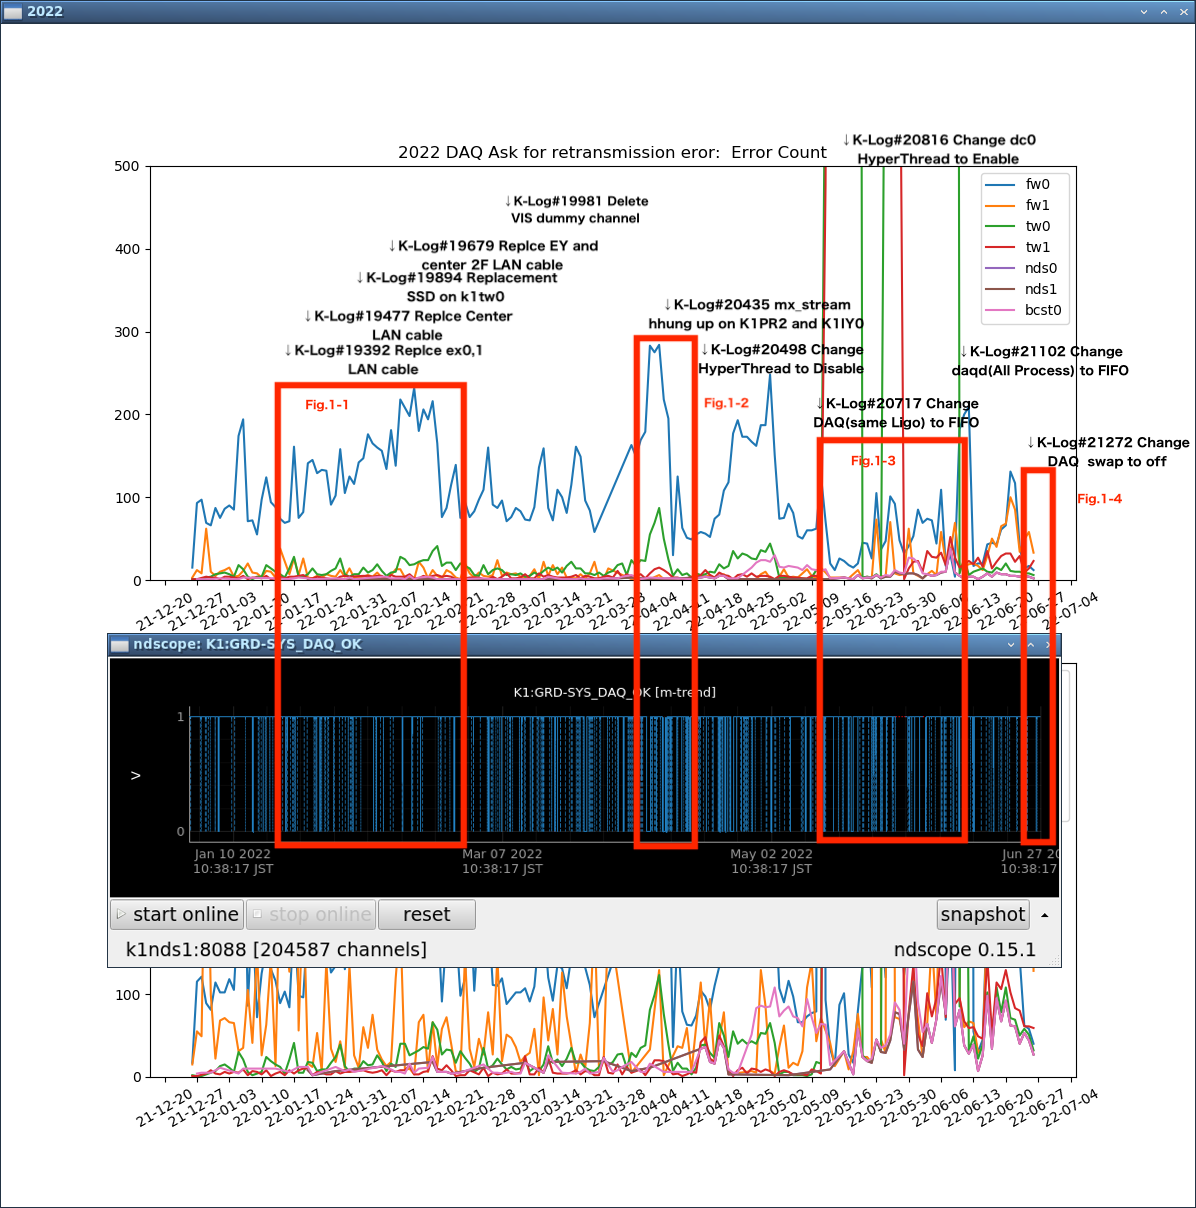
Data
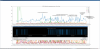
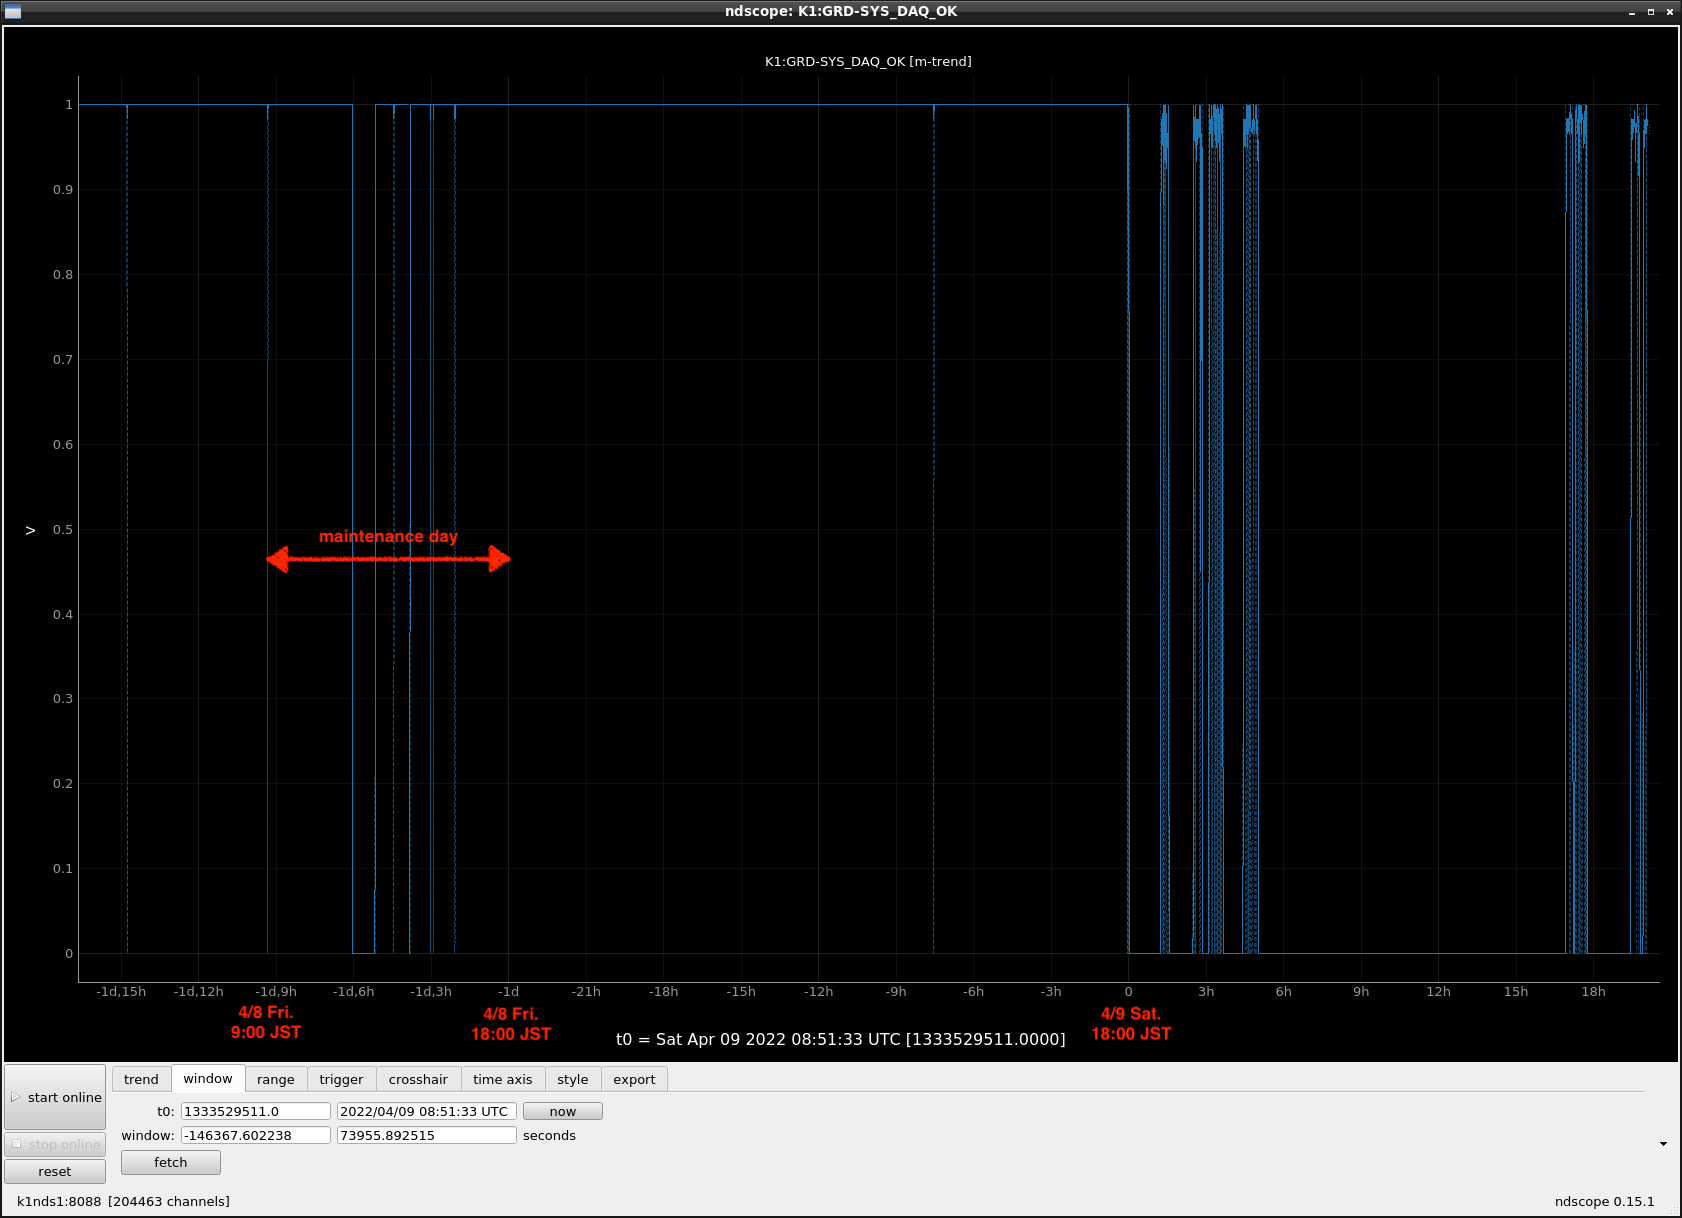
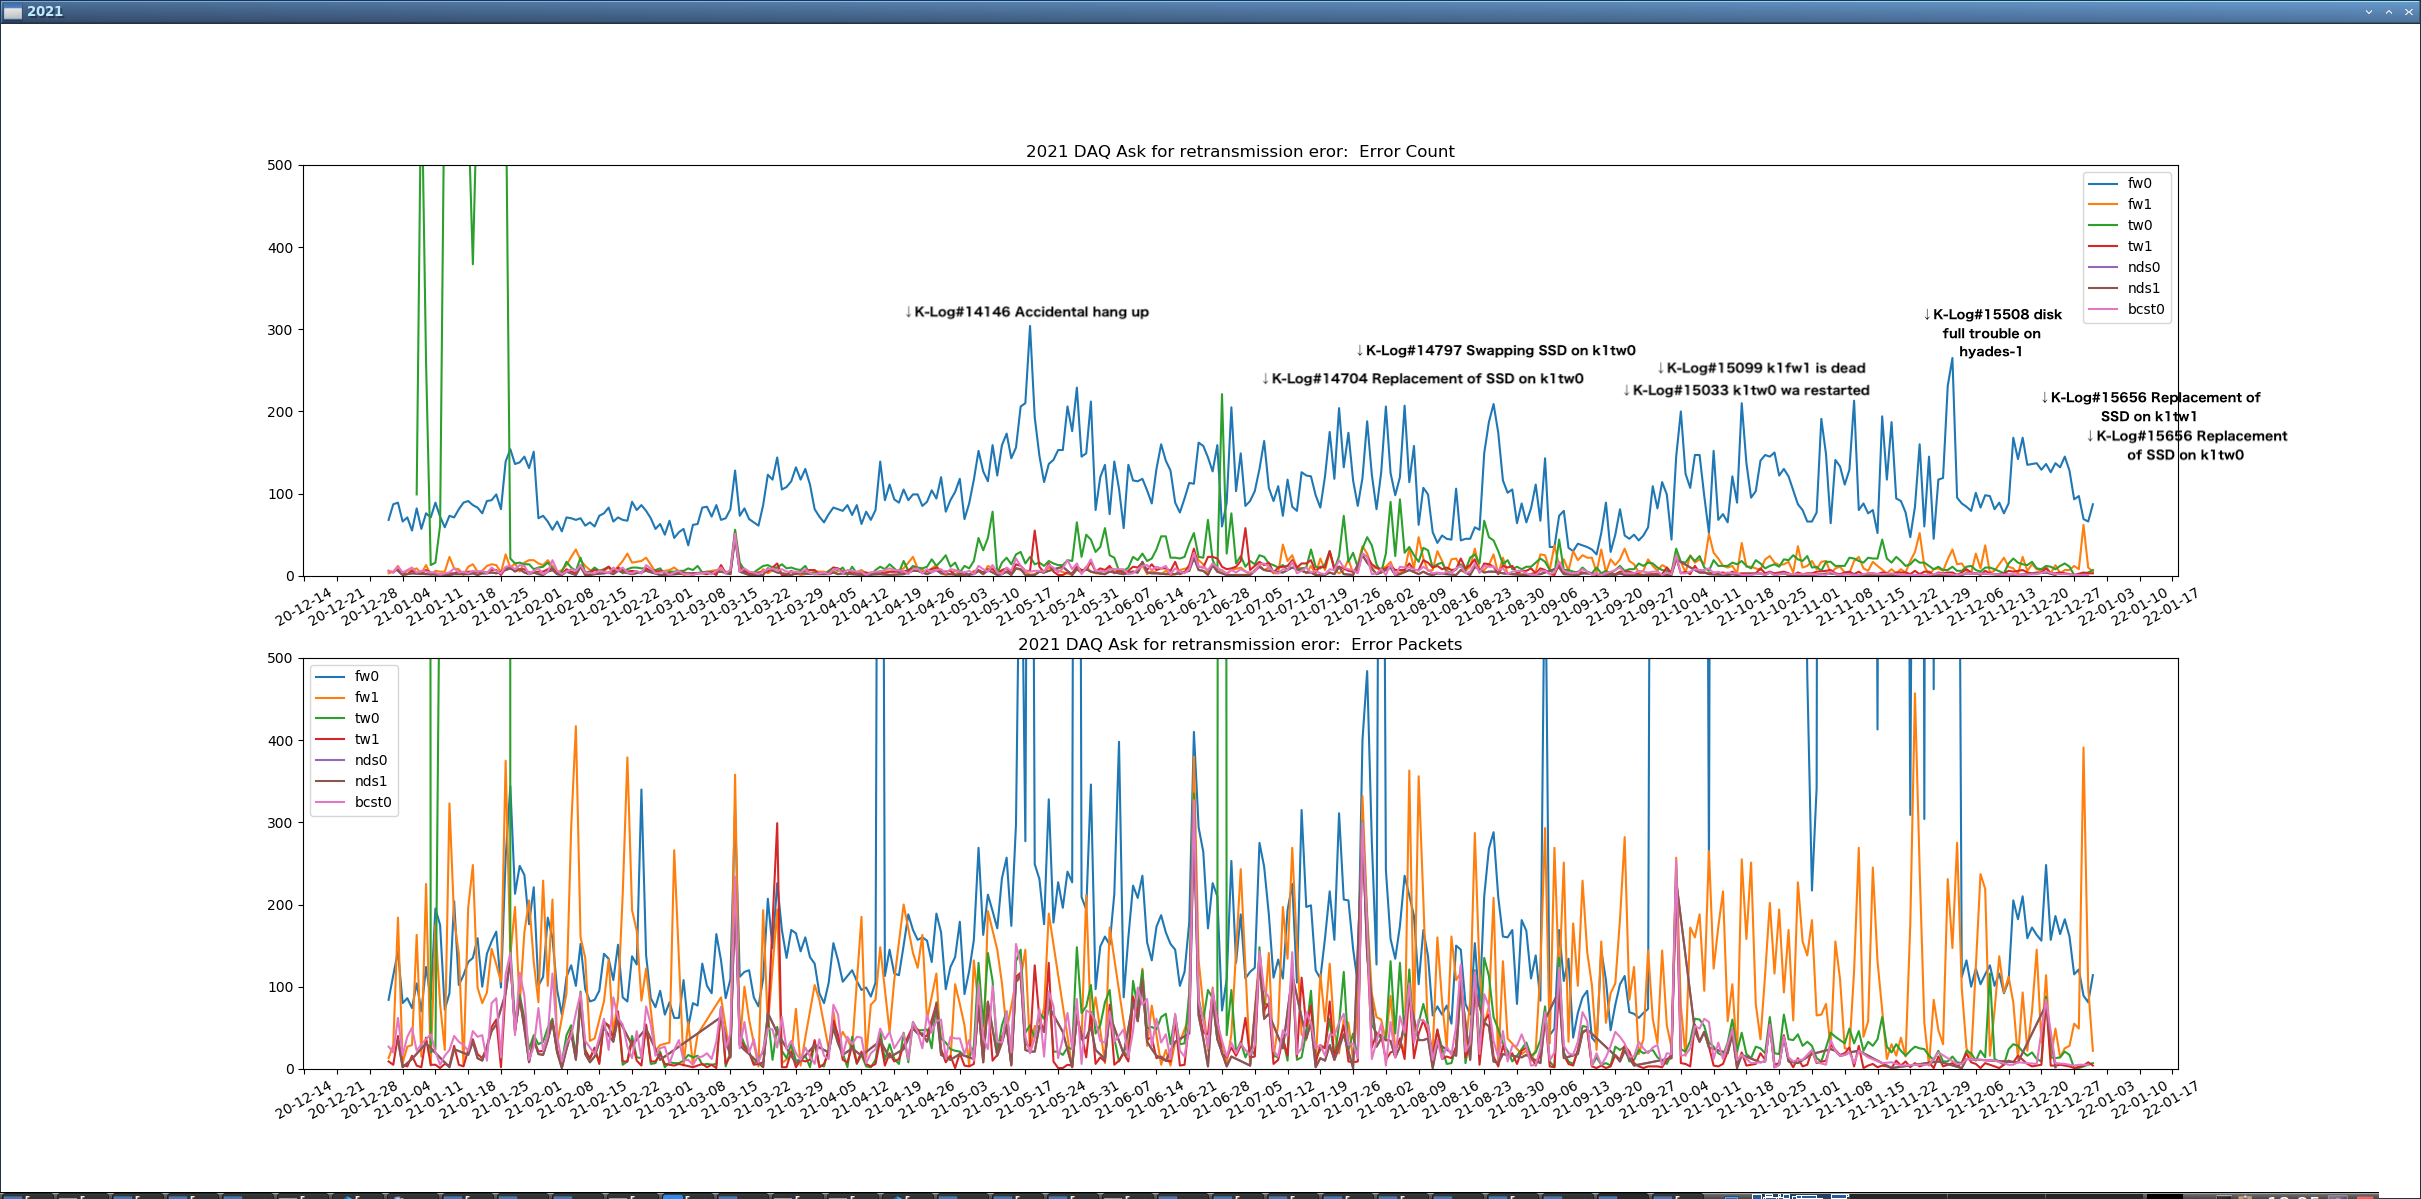
Fig.1 Comparison of Ask for retransmission error and DAQ_OK in 2022
Fig.2 Ask for retransmission error in 2022
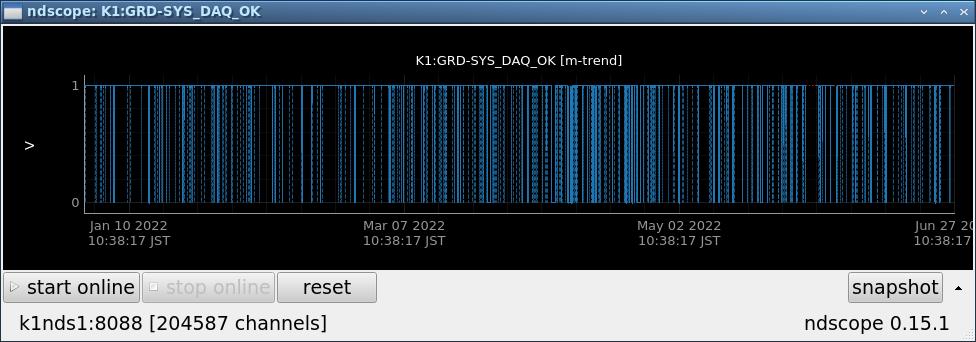
Fig.3 K1:GRD-SYS_DAQ_OK in 2022
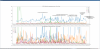
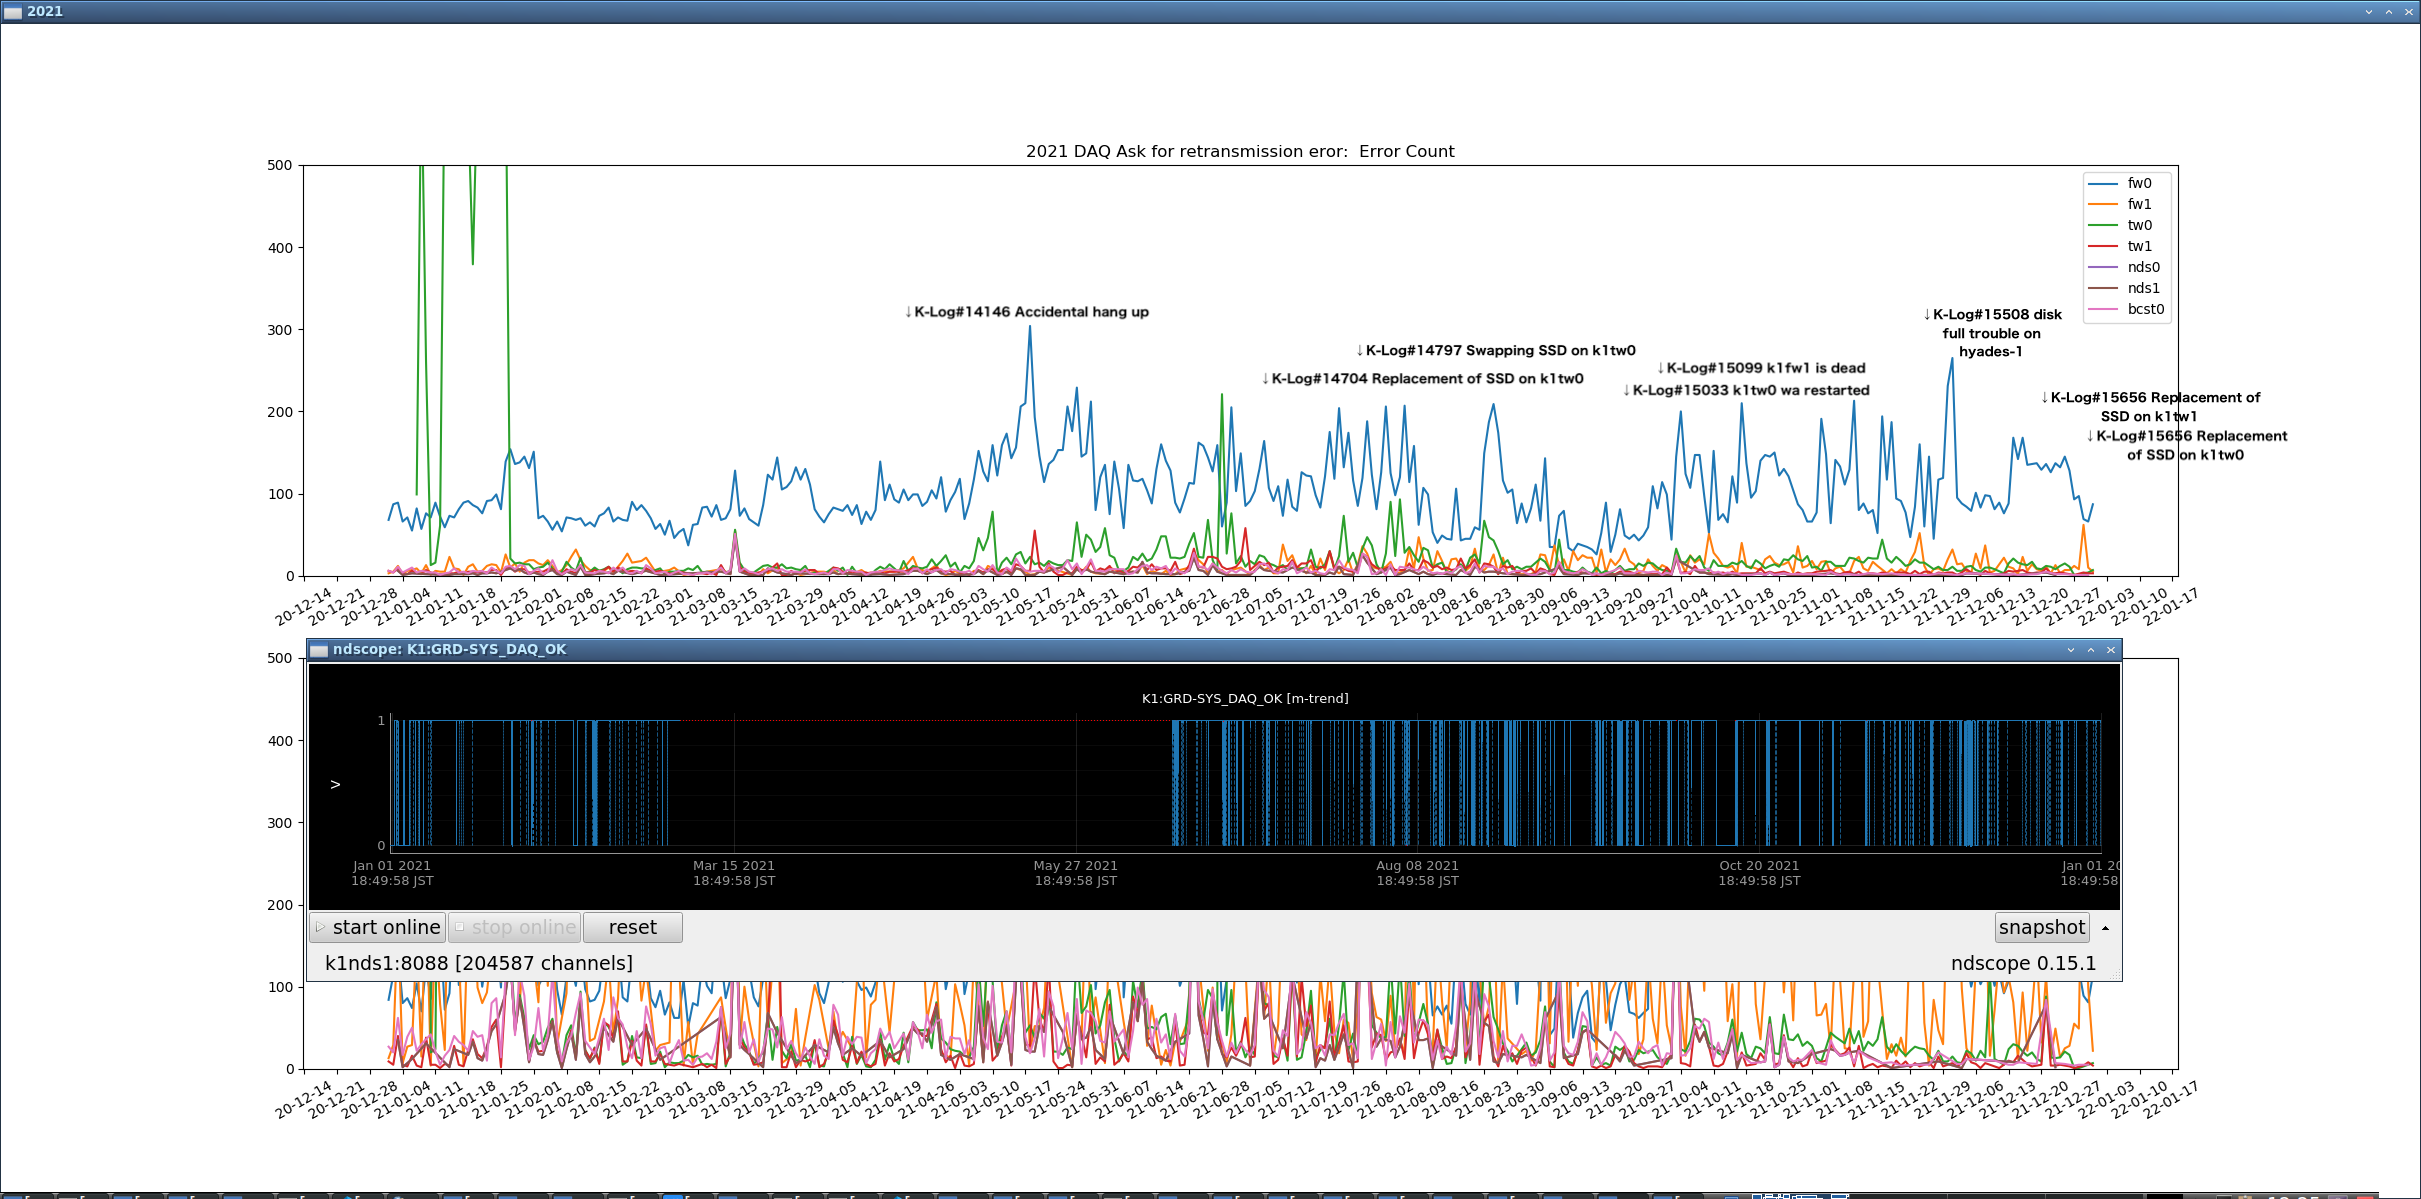
Fig.4 Comparison of Ask for retransmission error and DAQ_OK in 2021
Fig.5 Ask for retransmission error in 2021
Fig.6 K1:GRD-SYS_DAQ_OK in 2021
Figs. 1 and 4 are composites of 2, 3, 5, and 6, respectively.
Figs. 2 and 5 are graphs of daily totals of the number of "Ask for retransmission XX packet port 7097" errors and the number of packets in the DAQ log file, compiled by a script.
/users/DAQ/daqd_log_analize/daqdlogana.py
Fig.3 and 6 were obtained by specifying the period in ndscope.
Analysis
Fig.1-1
DAQ and DGS LAN cables were exchanged.
DAQ_OK seems to improve gradually during this period.
Fig.1-2
The percentage of DAQ_OK errors increased around the time I removed the VIS dummy channel in K-Log#19981 on 3/3.
Around 4/9, this was just a test that increased in frequency.
Fig.1-3
DAQ server setting was changed to FIFO, but "Ask For..." errors occurred frequently.
Later, the parent of daqd was also changed to FIFO, and the frequency decreased.
Fig.1-4
The test was performed with DAQ's Swap disabled.
"Ask For..." Fewer errors, but more error Packets at a time.
DAQ errors appear to be decreasing.
Result.
What we know so far.
1. "Ask For..." The frequency of errors and the frequency of DAQ_OK errors do not necessarily match.
However, "Ask For..." The frequency of errors and the frequency of DAQ_OK errors are similar.
The number of packets has nothing to do with the error frequency of DAQ_OK.
2. If the parent process of daqd is delayed, the frequency of "Ask For..." errors in k1tw0 and k1tw1 increases.
This also does not necessarily increase the frequency of DAQ_OK errors.
3. after changing all daqd to FIFO in K-Log#20717+21102.
"Ask For..." The error situation changed.
Before the change, fw0 always had an average of 100 errors.
However, fw0's "Ask For..." errors decreased.
And fw1 became worse.
However, the number of packets per time has increased.
We will see how it goes for about a week.

Change CPU allocation to daqd
Summary
CPU allocation to daqd for k1fw0, k1fw1, k1tw0, and k1tw1 has been changed.
CPU0 is used a lot by interrupts.
Therefore, we changed so that CPUs other than CPU0 are allocated.
Changed file to the following.
/opt/rtcds/kamioka/k1/target/fb/start_daqd.fw0.inittab
/opt/rtcds/kamioka/k1/target/fb/start_daqd.fw1.inittab
/opt/rtcds/kamioka/k1/target/fb/start_daqd.tw0.inittab
/opt/rtcds/kamioka/k1/target/fb/start_daqd.tw1.inittab
Changes
sleep 20
TASKLIST=$(exec su controls -c "ps x -L | grep daqd | awk '{print $2}'")
for x in ${TASKLIST}; do taskset -p 0xfffe ${x}; done
Reverted changes that were not effective in DAQ maintenance.
K-Log#21353: taskset=> tw0 and tw1 are reverted back to before the change.
fw0 and fw1 keep after the change.
K-Log#21272: swap on
=> leave as changed
K-Log#21102: FIFOing daqd
=> FIFO settings on all (fw0,fw1,tw0,tw1,nds0,nds1,bcst0) servers were returned to TS.
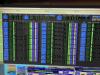
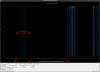
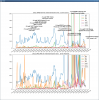
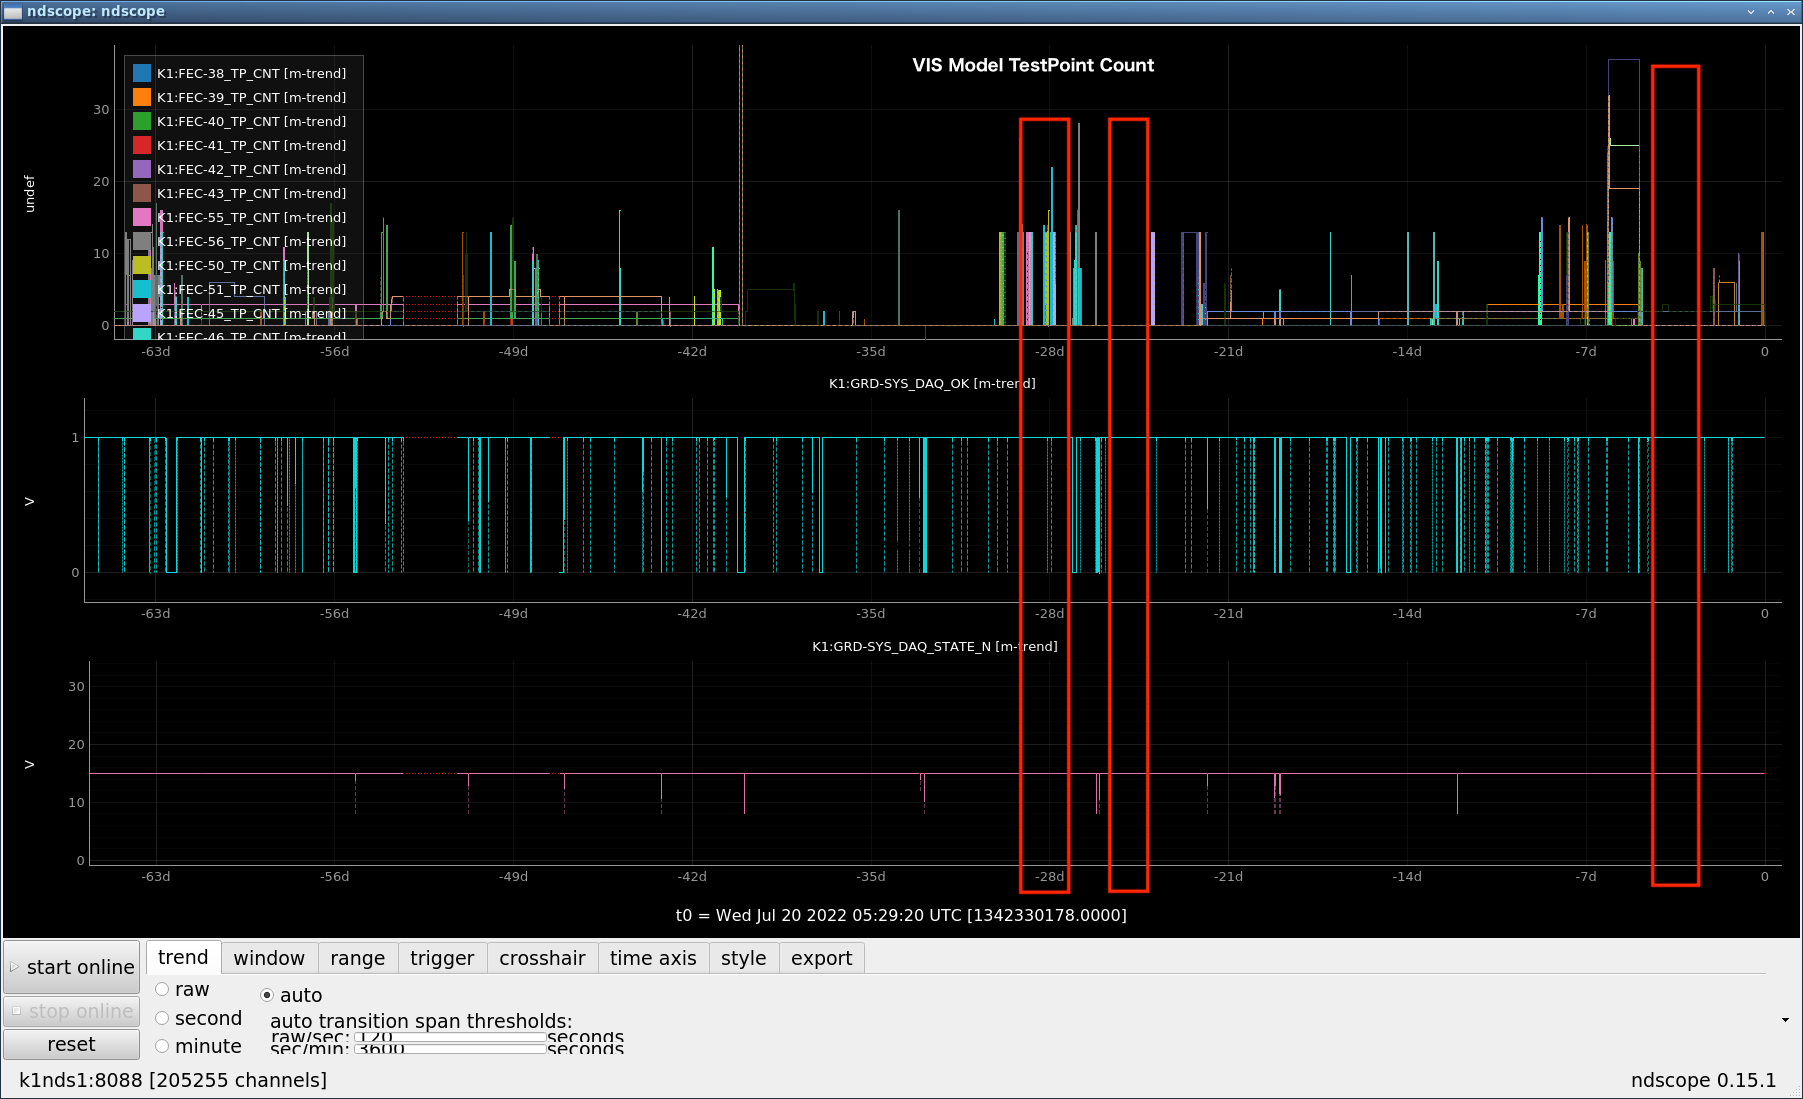
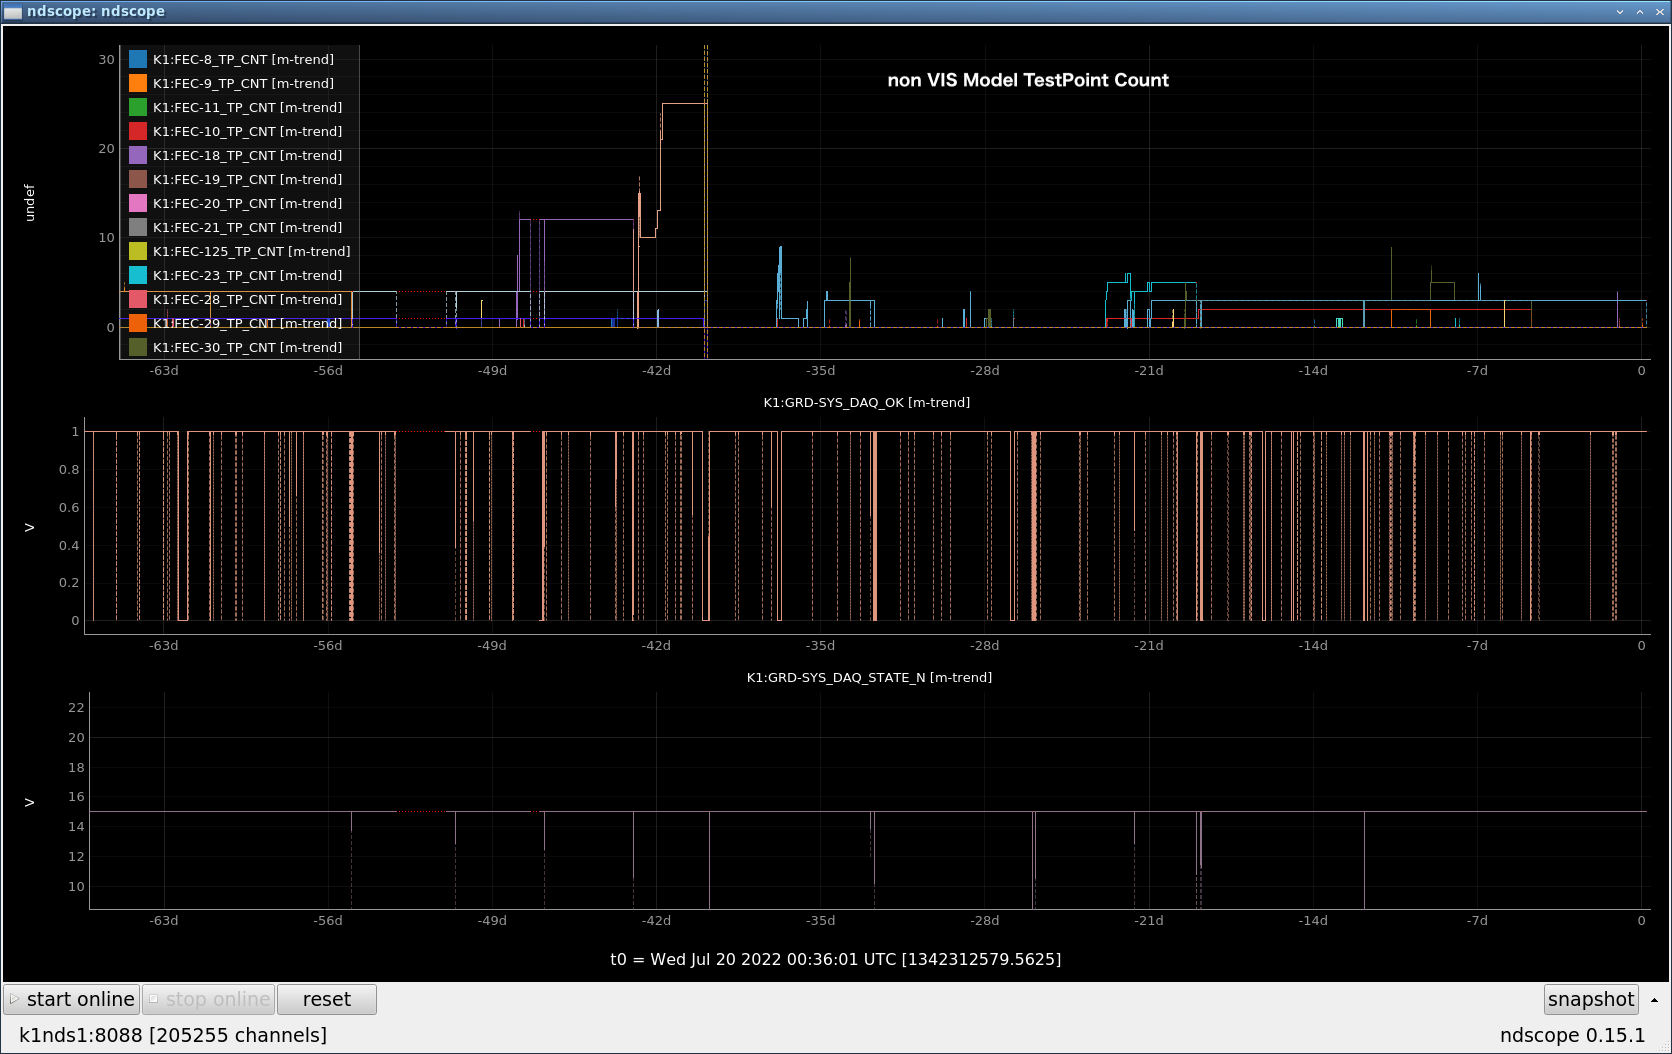
The correlation between DAQ TimingError and the number of TestPoints used was confirmed.
Background.
DAQ TimingError occurrences decreased in frequency during the holidays.
There were multiple causes, but the number of TestPoints (data volume) was most likely the cause of the errors.
Investigation
Fig.1 shows the data of TestPoints related to VIS.
Fig.2 shows the data of TestPoints other than VIS.
When the number of TestPoints is small, no error occurs.
Even when the number of TestPoints is large, it seems that errors are unlikely to occur when the data rate is low.
When the number of TestPoints with a high data rate is small, the defect occurs even if the number of TestPoints is small.
In cases where TestPoints are not used, TimingError seems to occur less frequently.
Future Policy
Can we prevent errors from occurring even when TestPoints are used?
If we increase the number of TestPoints, the traffic from FEPC to DAQ will increase.
However, since it is highly likely that the error will not occur during observation, we will lower the priority.
Source code:
/users/ikeda/TPscope/tpscope.py