Reports 1-1 of 1 Clear search Modify search
MIF (General)
shun.saito - 21:42 Saturday 20 June 2026 (37098) Print this report
Confirmation of SRC flash

[Smith, Tanaka, Fujimoto, Saito]

The sub-laser beam was aligned to the main-laser beam, and after blocking the main laser, flashes from the SRY were observed using the OMC REFL PD. The alignment was further optimized using two mirrors to maximize the fringe amplitude, and the positions of the two lenses were also adjusted. However, the resulting fringe amplitude was smaller than that observed previously (klog:37065). In addition, the signal level in the single-pass configuration was equal to the minimum value of the fringe signal. The mode shape observed with the camera also appeared as if the beam was being clipped somewhere in the optical path. Furthermore, when the beam position was checked in front of the iris located before the sub-laser beam entered the SRY, the beam was found to be offset from the center, even when the fringe amplitude had been maximized. Therefore, it is possible that the alignment was not properly optimized.
 

  • First, the alignment was performed using two irises, and the main-laser beam was blocked. When the OMC REFL PD was used to monitor flashes from the SRY, flashes were successfully observed. The alignment was then further optimized using two mirrors to increase the fringe amplitude. The positions of the 200 mm and 150 mm focal-length lenses were also adjusted to maximize the fringe amplitude. However, the resulting fringe amplitude was smaller than that obtained previously (klog:37065) (Fig. 1). Next, the SRM was misaligned to observe the single-pass signal. The signal level was found to be equal to the minimum value of the fringe signal. The HWP located after the FI was then rotated to check whether the signal level could be increased, but the signal was already at its maximum value. The SRM was subsequently realigned, and the spatial mode was observed with a camera. The mode shape appeared as though the beam was being clipped somewhere along the optical path. In addition, after optimizing the alignment to maximize the fringe amplitude, the beam position was checked in front of the iris located before the sub-laser beam entered the SRY. The beam was found to be displaced from the center of the iris. Therefore, it is possible that the alignment was not properly optimized.
Images attached to this report
Comments to this report:
shun.saito - 23:03 Tuesday 23 June 2026 (37116) Print this report

[Smith, Tanaka, Hirose, Fujimoto, Saito]

The sub-laser beam was aligned to the main laser beam, and after blocking the main laser, SRY fringes were observed using the OMC REFL PD. The alignment was optimized using two mirrors to maximize the fringe amplitude. The measured FSR was approximately 2.3 MHz. Since this value is very close to the expected FSR, we conclude that the observed signal corresponds to SRY fringes. Measurements of the main laser and sub-laser beam profiles showed that the beam waist positions differed by approximately 65 mm. Therefore, a beam profiler was placed at the main laser waist position, and the positions of the two lenses were adjusted so that the sub-laser beam waist would be located there. After blocking the main laser again and observing the SRY fringes with the OMC REFL PD, the alignment was optimized using two mirrors. As a result, the fringe amplitude increased to approximately 1.3 μW. However, the mode shape was not circular. In addition, both the main laser and sub-laser beams were found to be incident on the lower part of a lens that had originally been installed in the optical path. Next time, we plan to further adjust the positions of the two lenses to determine whether the fringe amplitude can be increased. We are also considering adjusting the height of the existing lens so that the beams pass through its center.


  • First, the alignment was performed using two irises. After blocking the main-laser beam, SRY fringes were observed using the OMC REFL PD. The alignment was then optimized using two mirrors to maximize the fringe amplitude (Fig. 1). The sub-laser PZT was driven with an 8 Vpp triangular waveform. In Fig. 1, the upper trace of the ndscope display shows the OMC REFL PD signal, while the lower trace shows the signal applied to the PZT. From the plot, an 8 V change corresponds to approximately 6.5 FSR. Since the PZT efficiency of the sub-laser measured at Kashiwa was 1.871 MHz/V, the FSR is estimated as FSR=(1.871 MHz/V)×(8 V)/6.5​=2.3 MHz. Because this value agrees well with the expected FSR, we conclude that the observed signal is indeed the SRY fringe.
     
  • Next, the beam profiles of the main laser and sub-laser were measured to evaluate the mode matching. The sub-laser beam profile remained distorted, similar to what was observed previously (klog:37093). When the beam profile was examined from upstream toward the waist, the beam initially had a reasonably clean shape (Fig. 2), then gradually became distorted into a vortex-like pattern (Fig. 3), and finally returned to a cleaner shape near the waist region (Fig. 4). The measured beam profiles were then fitted (Fig. 5). The resulting waist positions and waist radii are listed below. The origin is defined as the position of the mirror immediately after the BS in the path through which the sub-laser enters the interferometer.

    Main laser

    x direction: Waist position = 303.2 ± 8.8 mm, Waist radius = 0.0545 ± 0.0022 mm
    y direction: Waist position = 330.3 ± 10.6 mm, Waist radius = 0.0609 ± 0.0026 mm
    →Average: Waist position = 317 mm, Waist radius = 0.058 mm

    Sub-laser

    x direction: Waist position = 255.8 ± 5.2 mm, Waist radius = 0.0528 ± 0.0014 mm
    y direction: Waist position = 247.8 ± 5.3 mm, Waist radius = 0.0548 ± 0.0015 mm
    →Average: Waist position = 252 mm, Waist radius = 0.054 mm

    From these results, the mode-matching ratio was estimated to be approximately 7.5%. Since the waist positions differed by about 65 mm, the beam profiler was placed at the main laser waist position, and the positions of the 200 mm and 150 mm focal-length lenses were adjusted so that the sub-laser beam waist would coincide with that position. After blocking the main laser and observing the SRY fringes with the OMC REFL PD, the alignment was optimized again using two mirrors. The fringe amplitude became larger than that shown in Fig. 1 (Fig. 6), reaching approximately 1.3 μW. However, as shown in the camera image in the lower-left corner of Fig. 6, the mode shape was not circular. Therefore, next time we plan to further adjust the positions of the two lenses and investigate whether the fringe amplitude can be increased further.
     

  • In addition, the position of the sub-laser beam was checked at the location of the lens that had originally been installed downstream of the iris. The beam was not passing through the center of the lens (Fig. 7). The same was true for the main laser beam. It is possible that the fact that the sub-laser beam enters the interferometer while passing through the lower part of the lens is affecting the observed performance.

Images attached to this comment
Non-image files attached to this comment
shun.saito - 4:36 Thursday 25 June 2026 (37121) Print this report

[Ushiba, Smith, Tanaka, Fujimoto, Saito]

First, the appearance of the sub-laser beam on the OMC REFL camera was examined under the single-pass condition. The mode shape appeared elongated in the horizontal direction. Next, to avoid saturating the OMC REFL PD with the main-laser light, the PD gain was reduced from 40 dB to 0 dB. The PD output was connected to an SR560, which was configured as an AC-coupled second-order high-pass filter with a cutoff frequency of 300 Hz and a gain of 100. When the sub-laser PZT was driven with an 8 Vpp, 500 Hz triangular wave, the noise from the main laser and the amplitude of the sub-laser fringes were comparable, making it difficult to distinguish the fringes. However, when the ISS was turned on, the noise from the main laser was reduced, and by lowering the PZT drive frequency to 170 Hz, the sub-laser fringes became clearly visible. Therefore, it appears feasible to scan the SRY. Next, the ND filter in the sub-laser path of the PLL setup was changed from OD = 0.5 to OD = 0.6. After realigning the PLL path to maximize the beat signal, the beat signal amplitude reached approximately 4.82 dBm. When the LO frequency was tuned to the beat frequency, the PLL successfully locked. Furthermore, when the LO frequency was varied, the beat frequency followed accordingly, confirming that the lock was functioning. However, even while locked, the beat frequency sometimes drifted spontaneously by several MHz. Therefore, the loop filter parameters will need to be adjusted to suppress this motion, and the open-loop transfer function will also be measured. In addition, a piezo driver will be introduced to drive the PZT over a wider frequency range.
 

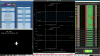
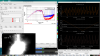
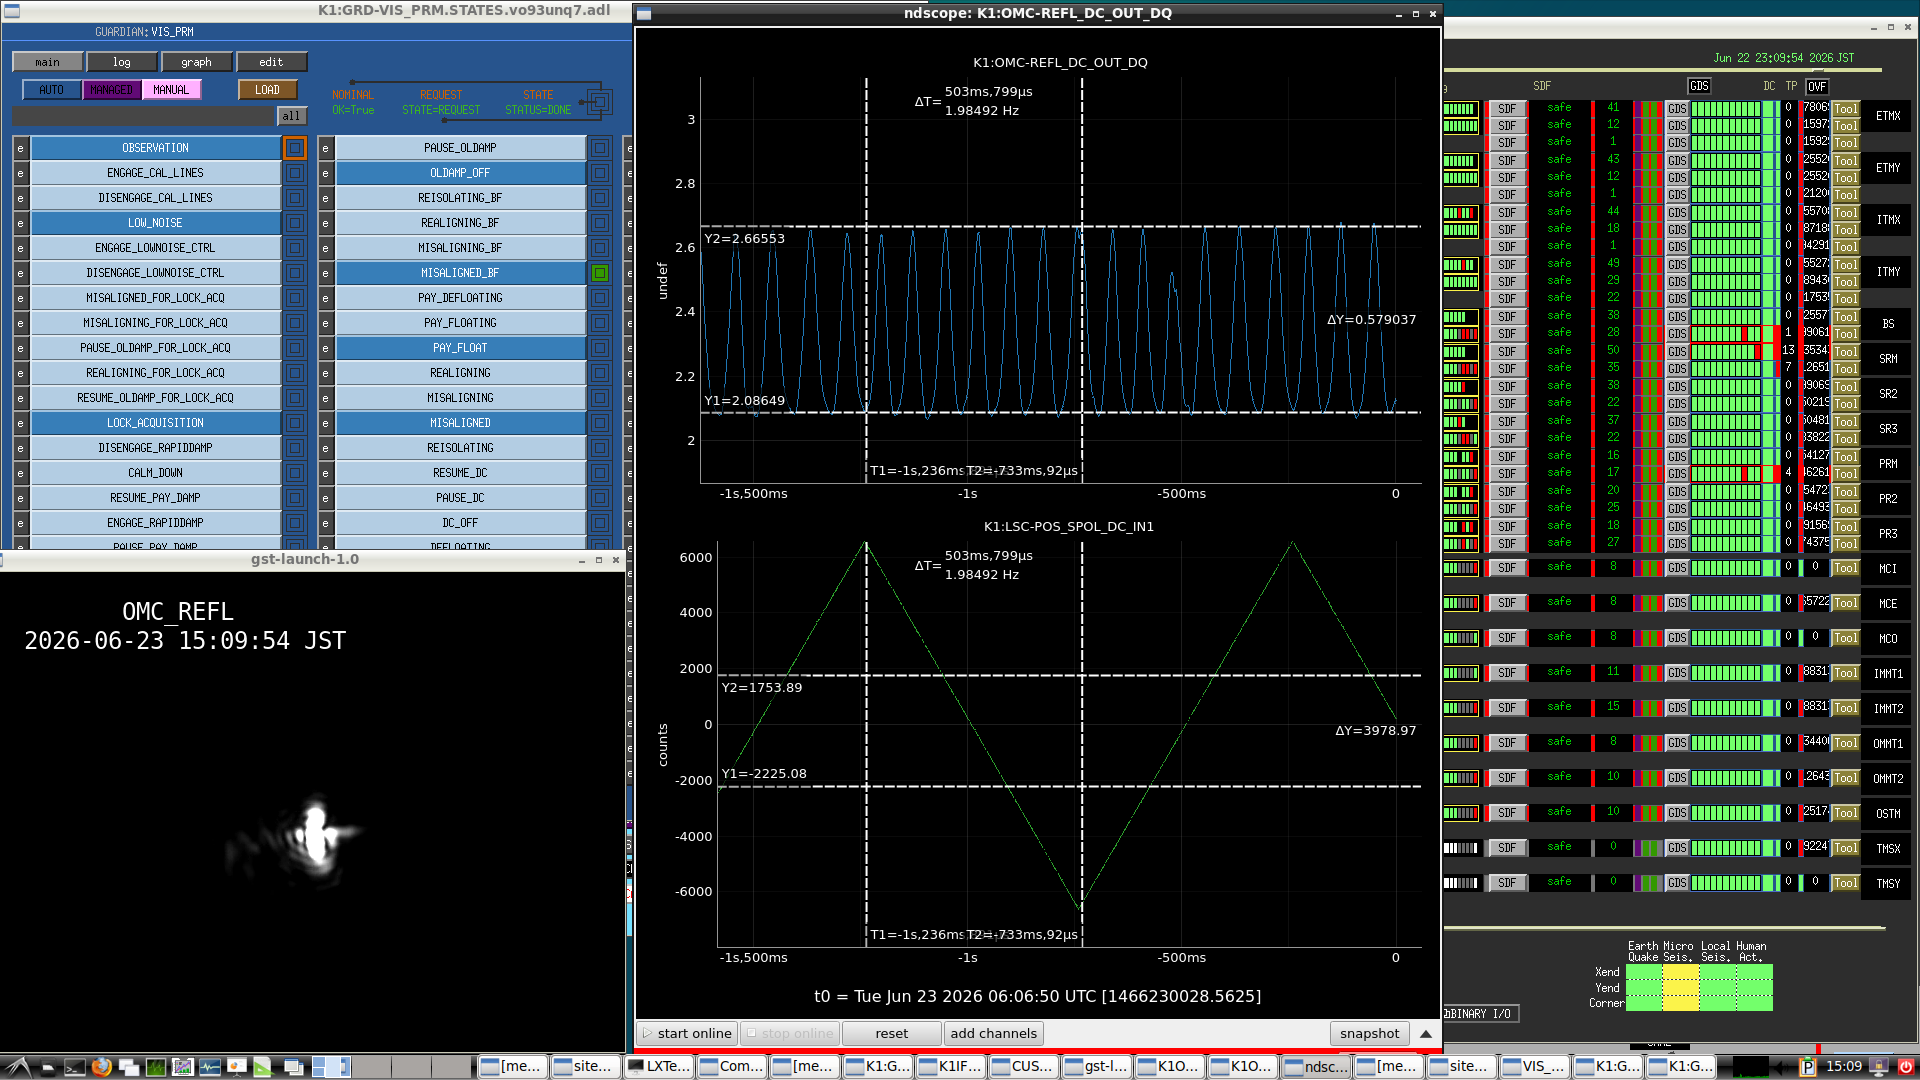
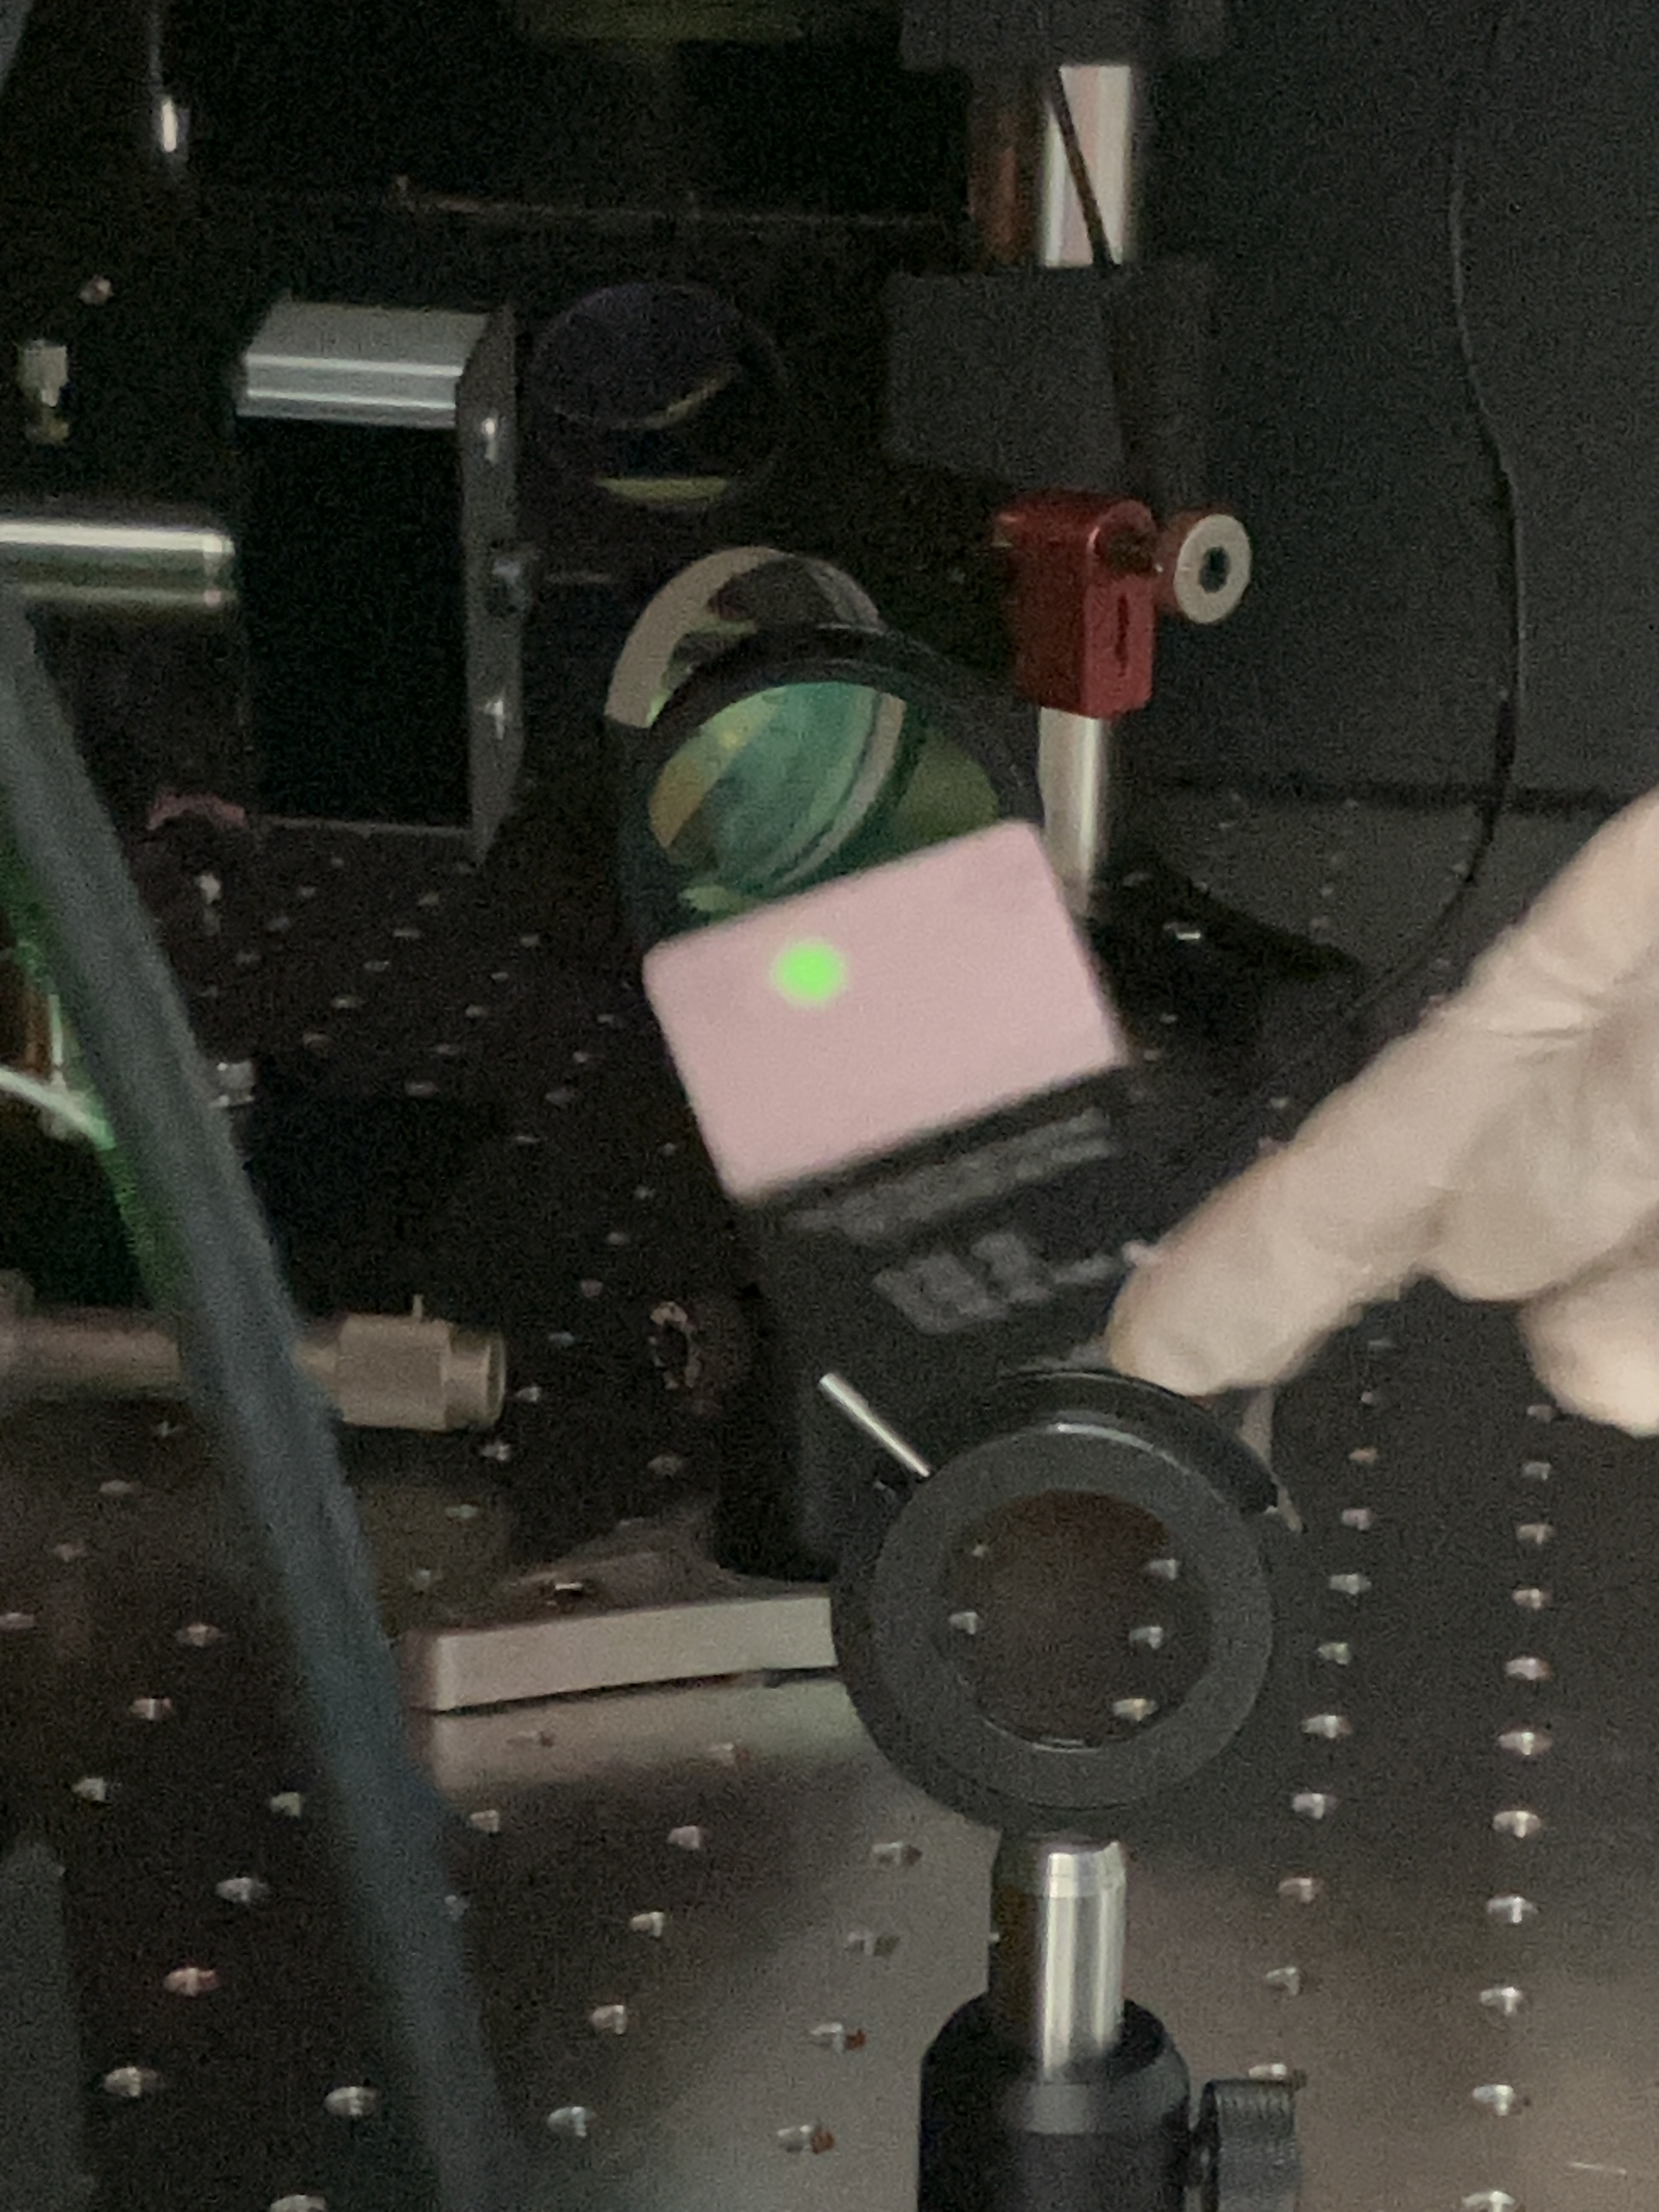
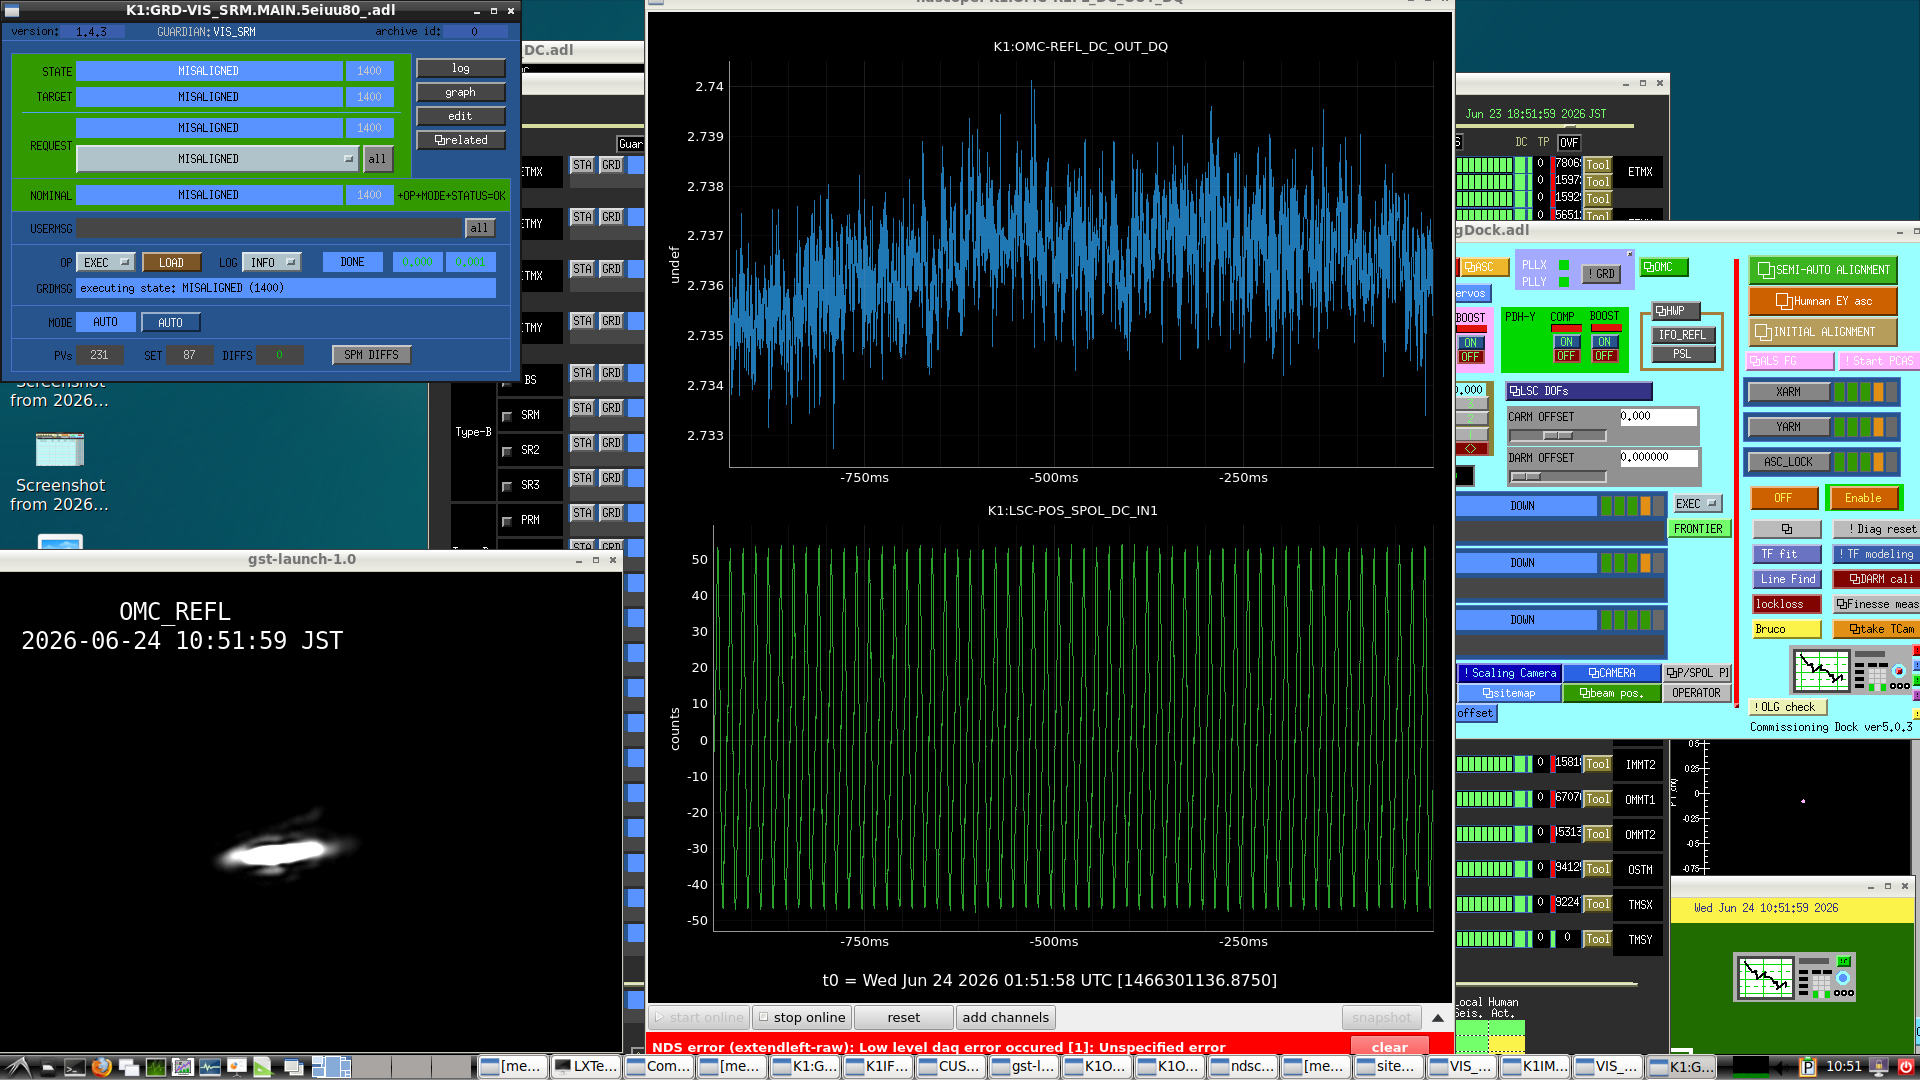
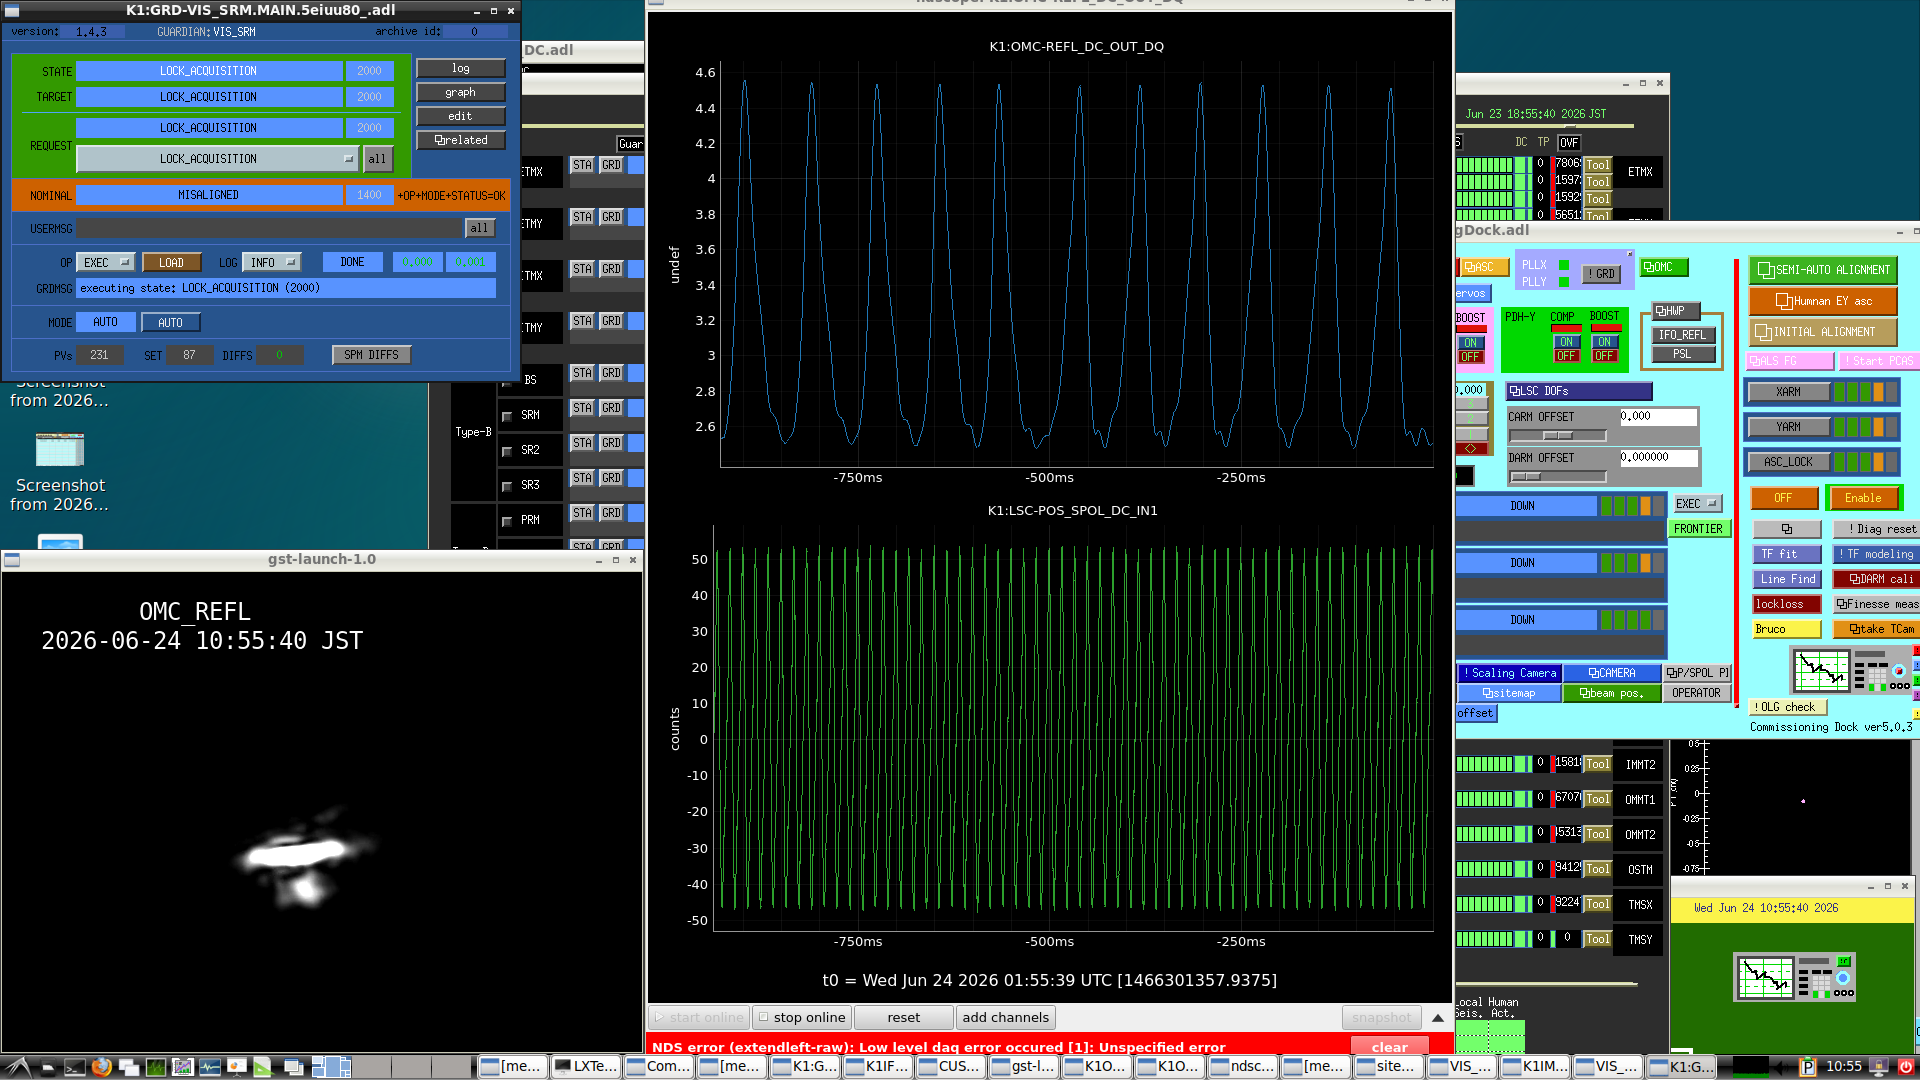
  • First, the main laser was turned off and the SRM was misaligned to observe how the sub-laser beam appeared on the OMC REFL camera in the single-pass configuration. The mode shape appeared horizontally elongated (Fig. 1). This is likely because the beam was hitting the lower part of a lens that had originally been installed in the optical path. Next, when the SRM was aligned, the fringe amplitude was approximately 2 μW (Fig. 2). Since this was comparable to the result obtained previously (klog:37116), the alignment of the sub-laser was not further adjusted.
     
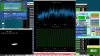
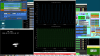
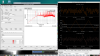
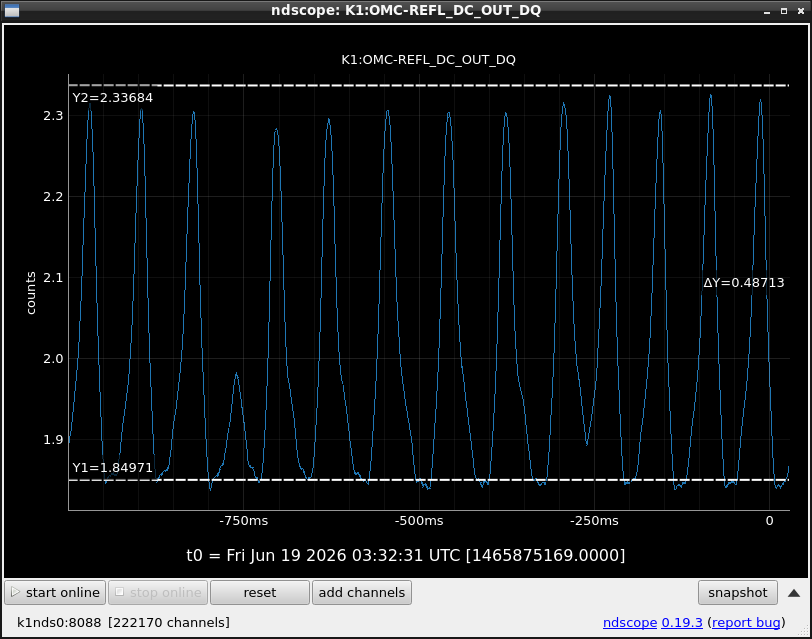
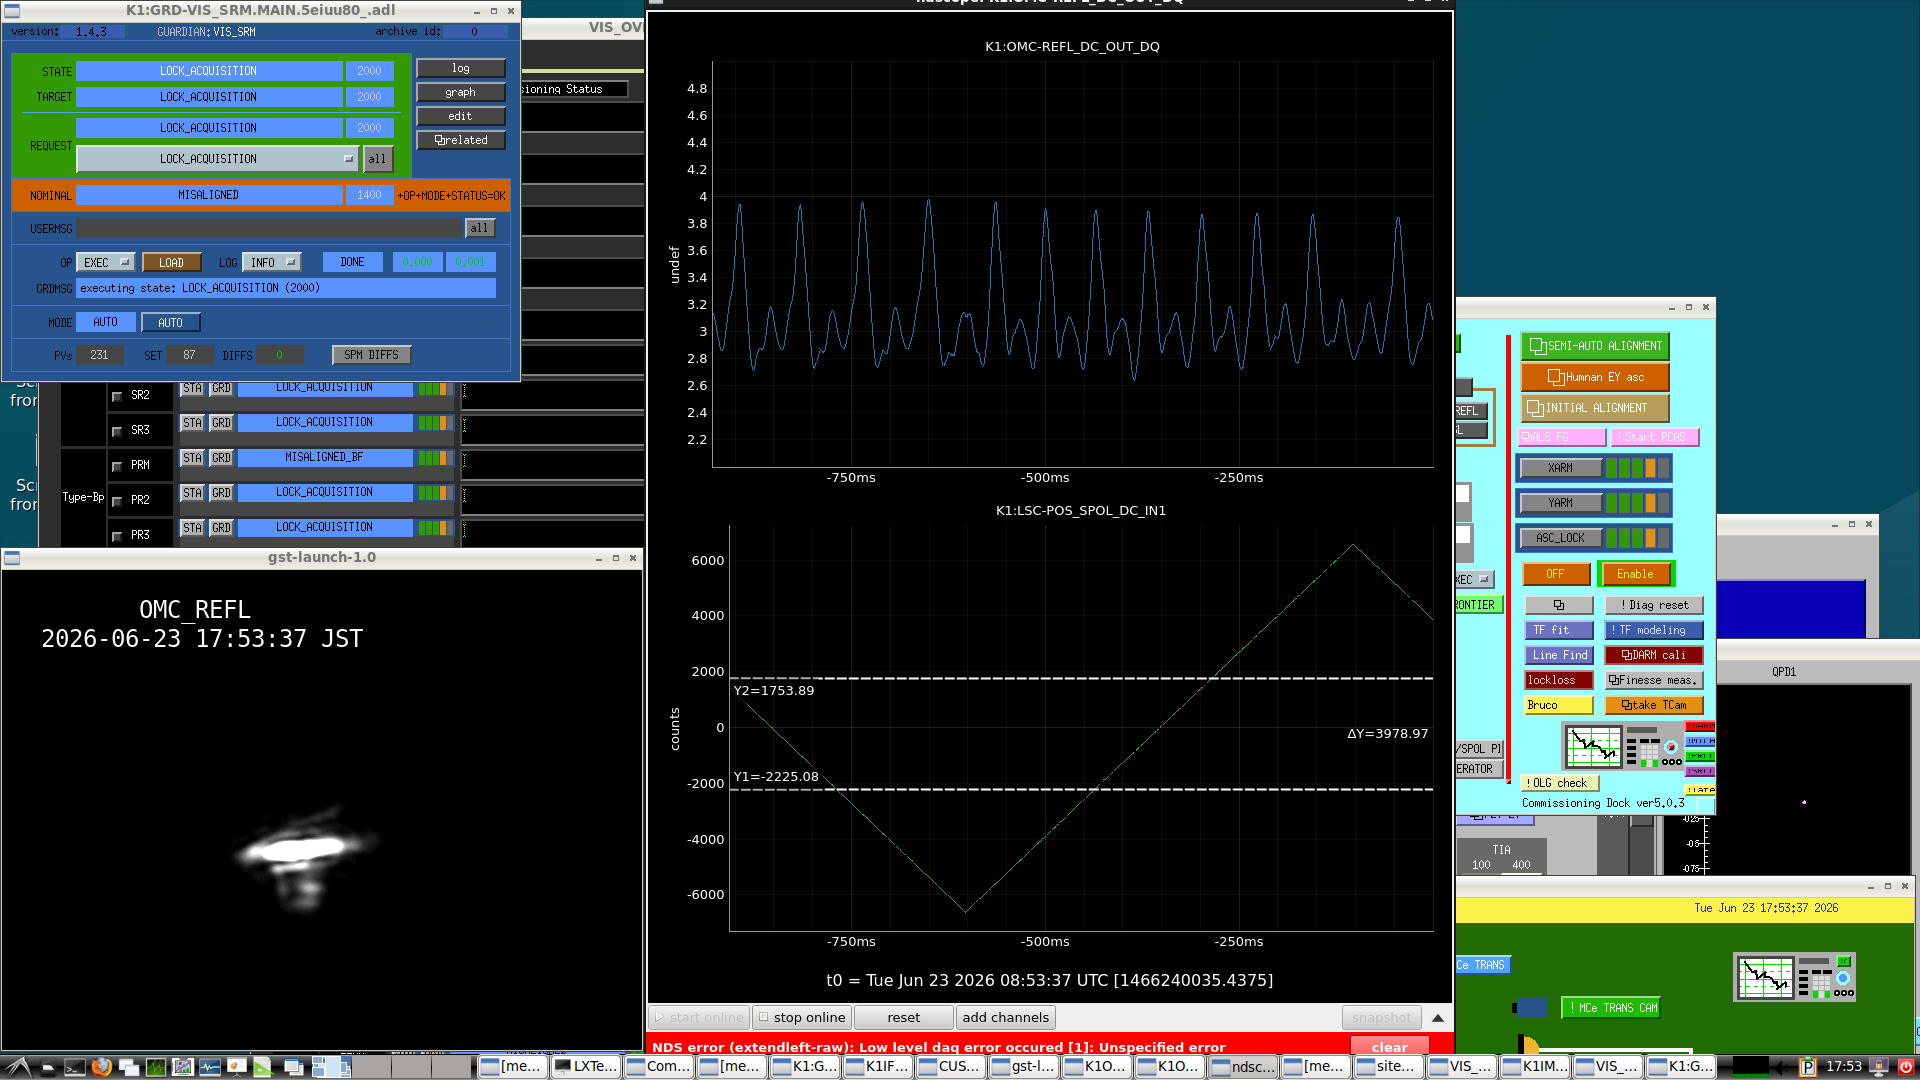
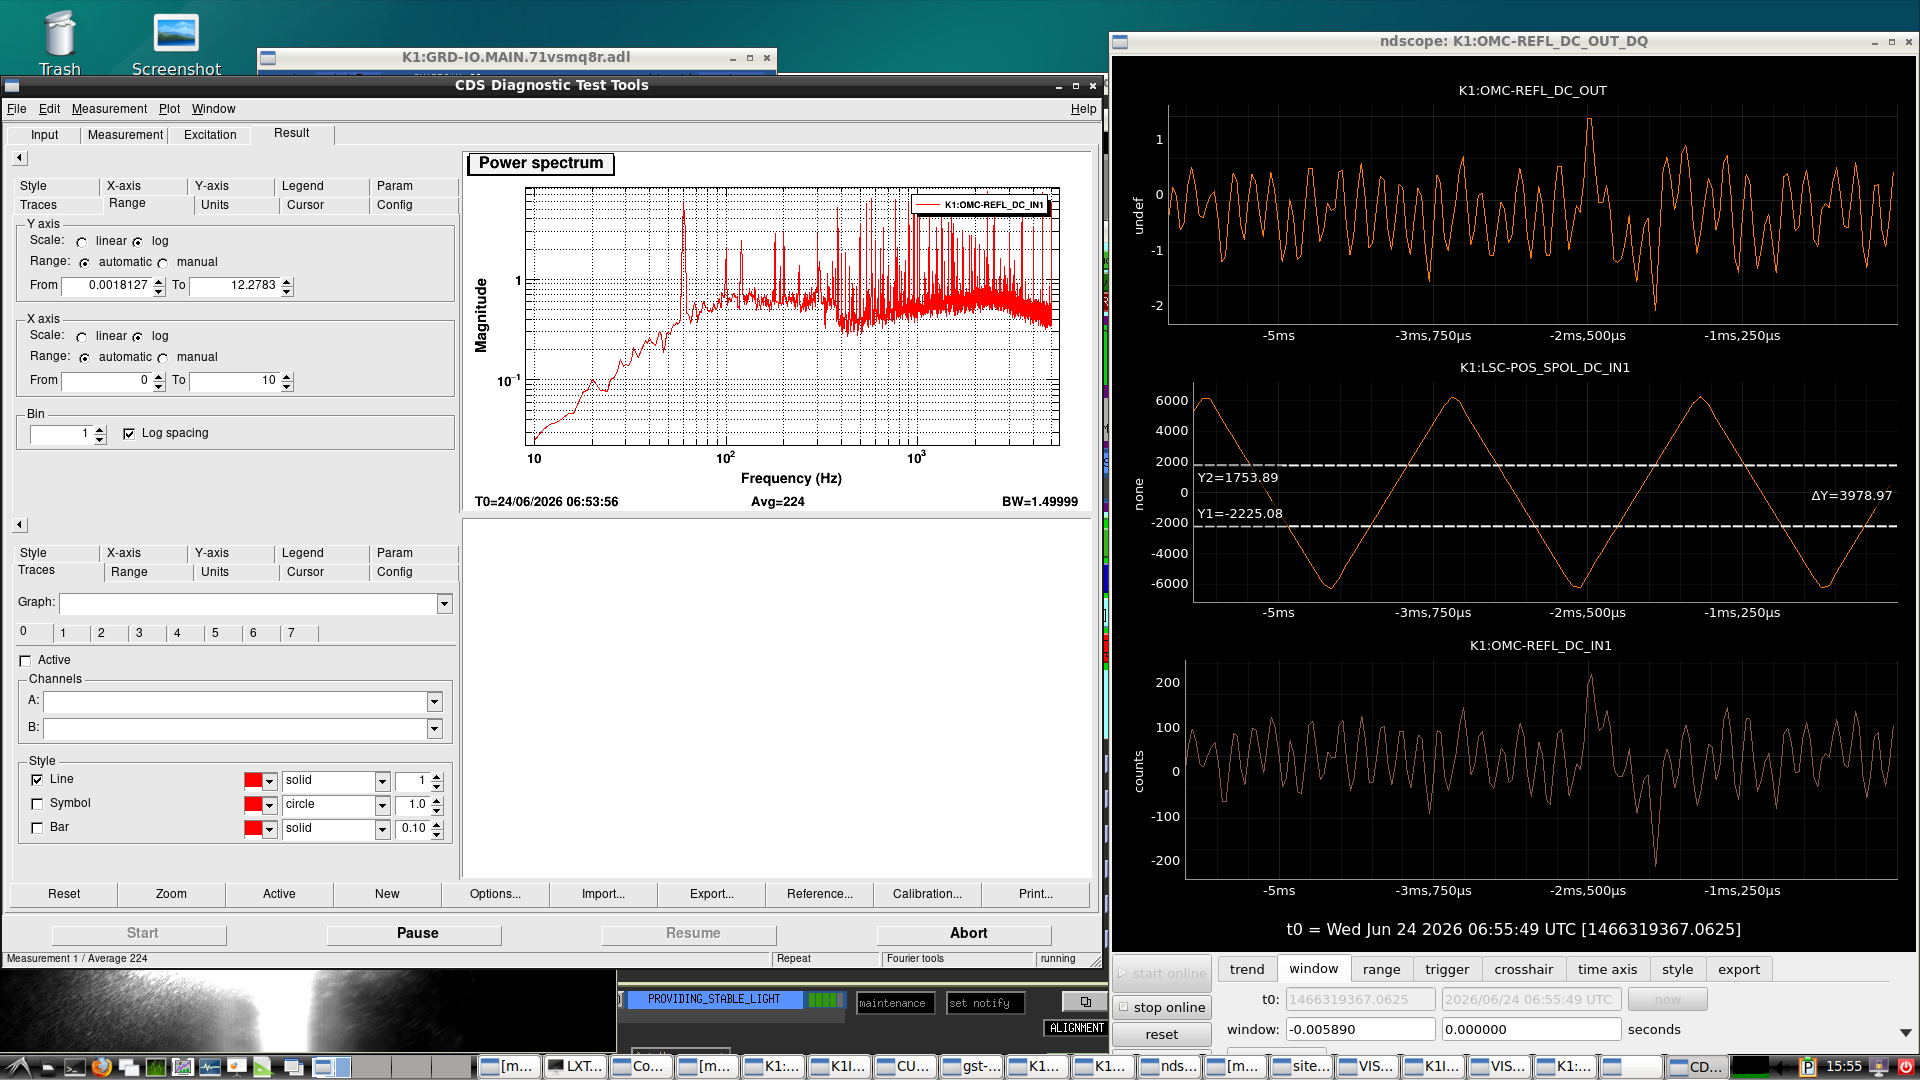
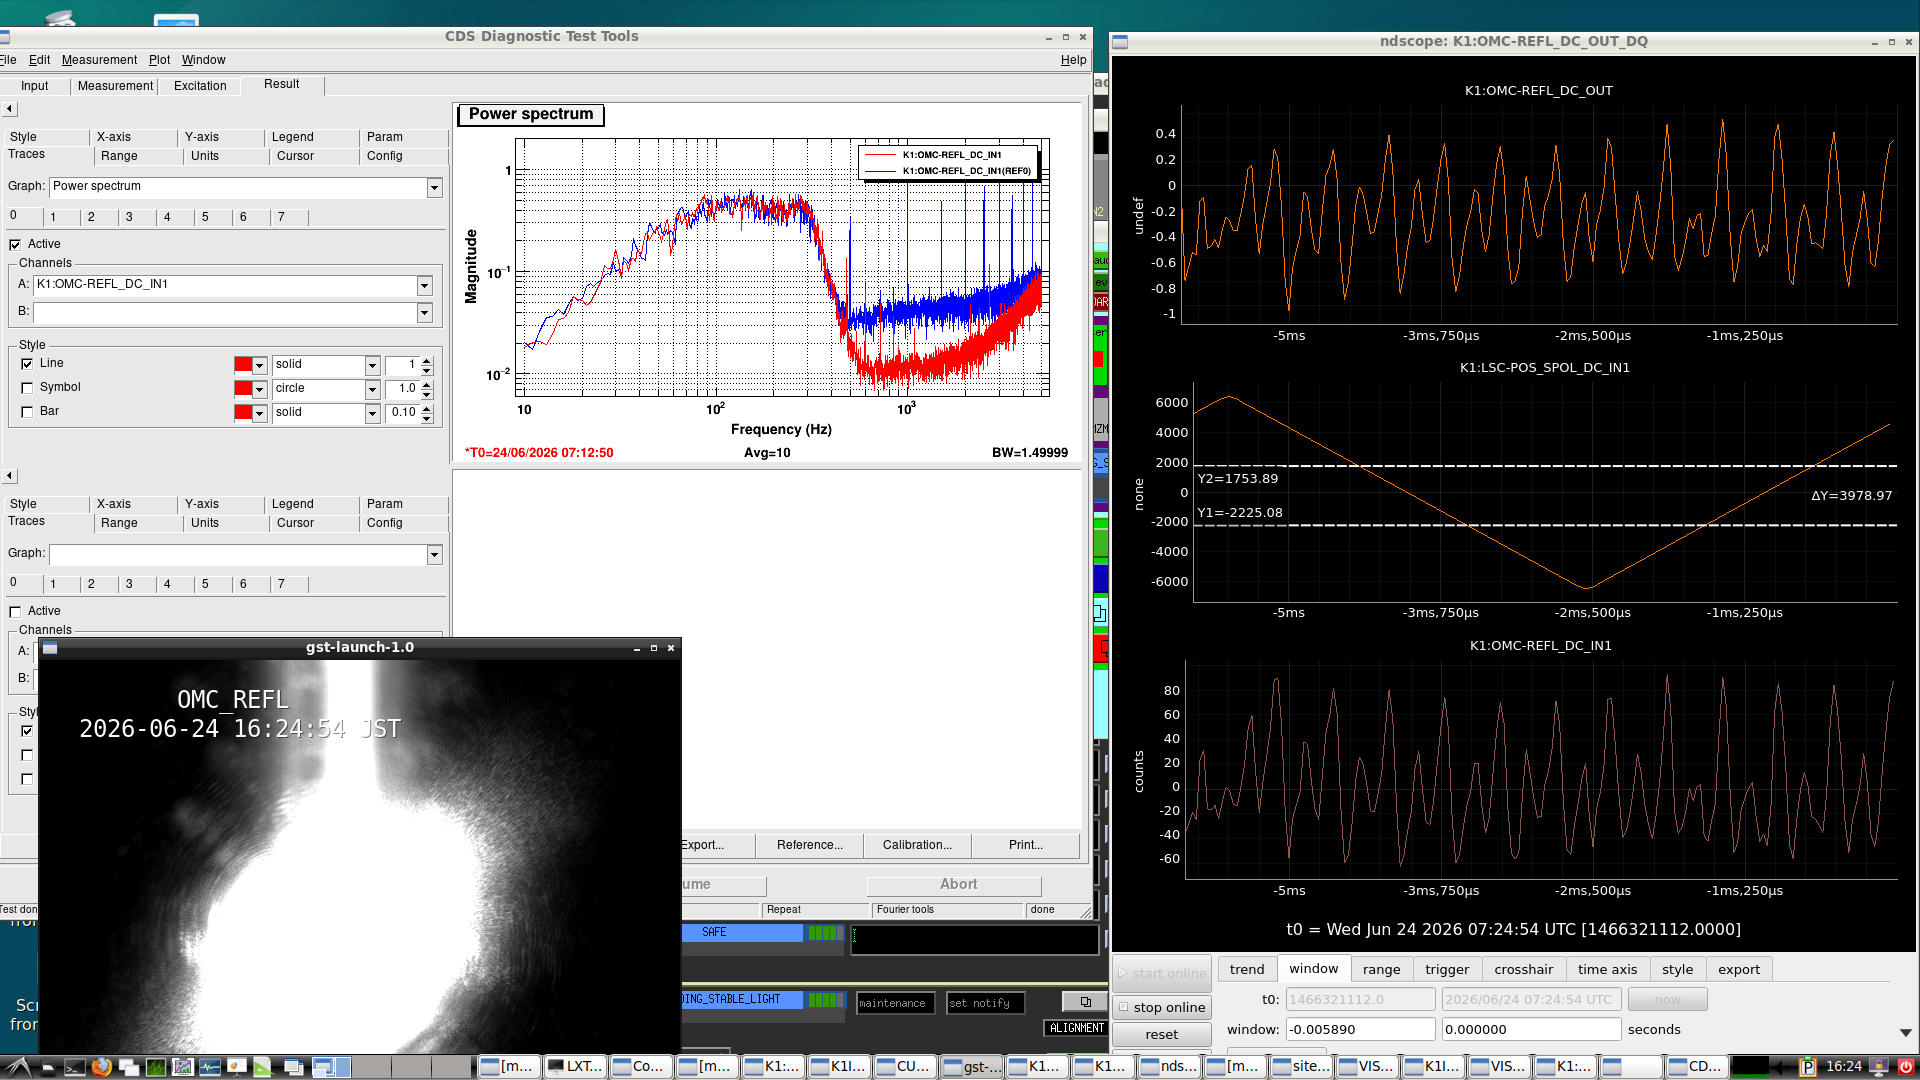
  • Next, the main-laser power measured at the OMC REFL PD under the single-pass condition was approximately 1.95 mW, while it increased to approximately 6 mW when the SRM was aligned. To avoid saturating the OMC REFL PD with the main-laser light, the PD gain was reduced from 40 dB to 0 dB. Under this condition, when the main laser was resonant in the SRY, the PD output was approximately 3600 counts, corresponding to approximately 2.1 V, allowing the PD output to be connected directly to the SR560. The SR560 was configured in AC-coupled mode, and the cutoff frequency of the high-pass filter was chosen while observing the OMC REFL PD signal with only the main laser present so as to minimize signal fluctuations. The gain was then increased while ensuring that the SR560 did not overload. Next, only the sub-laser beam was injected and it was confirmed that fringes could be observed when the sub-laser PZT was driven. The main-laser beam was then reintroduced. With the SR560 configured as a second-order high-pass filter with a cutoff frequency of 300 Hz and a gain of 100, and with the sub-laser PZT driven by an 8 Vpp, 500 Hz triangular wave, the noise from the main laser and the sub-laser fringe amplitude were of comparable magnitude, making fringe identification difficult (Fig. 3). However, after turning on the ISS, the noise from the main laser was significantly reduced. Furthermore, by lowering the PZT drive frequency to 170 Hz, the sub-laser fringes became clearly visible (Fig. 4). The power spectra shown in Figs. 3 and 4 correspond to K1:OMC-REFL_DC_IN1. In Fig. 4, the blue trace was taken while the sub-laser PZT was being driven, while the red trace was taken without driving the PZT. Comparing Figs. 3 and 4 clearly shows that the ISS reduced the noise level. Therefore, scanning the SRY appears to be feasible.

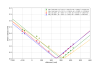
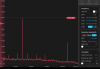
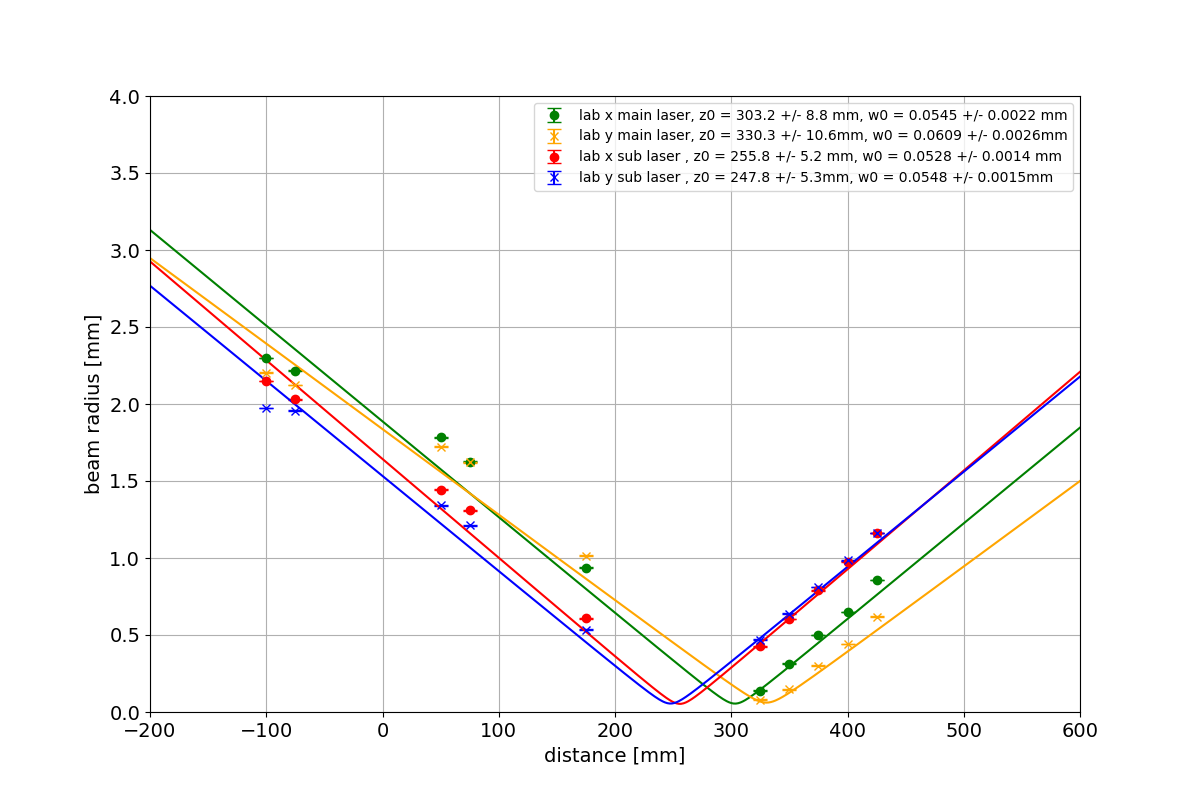
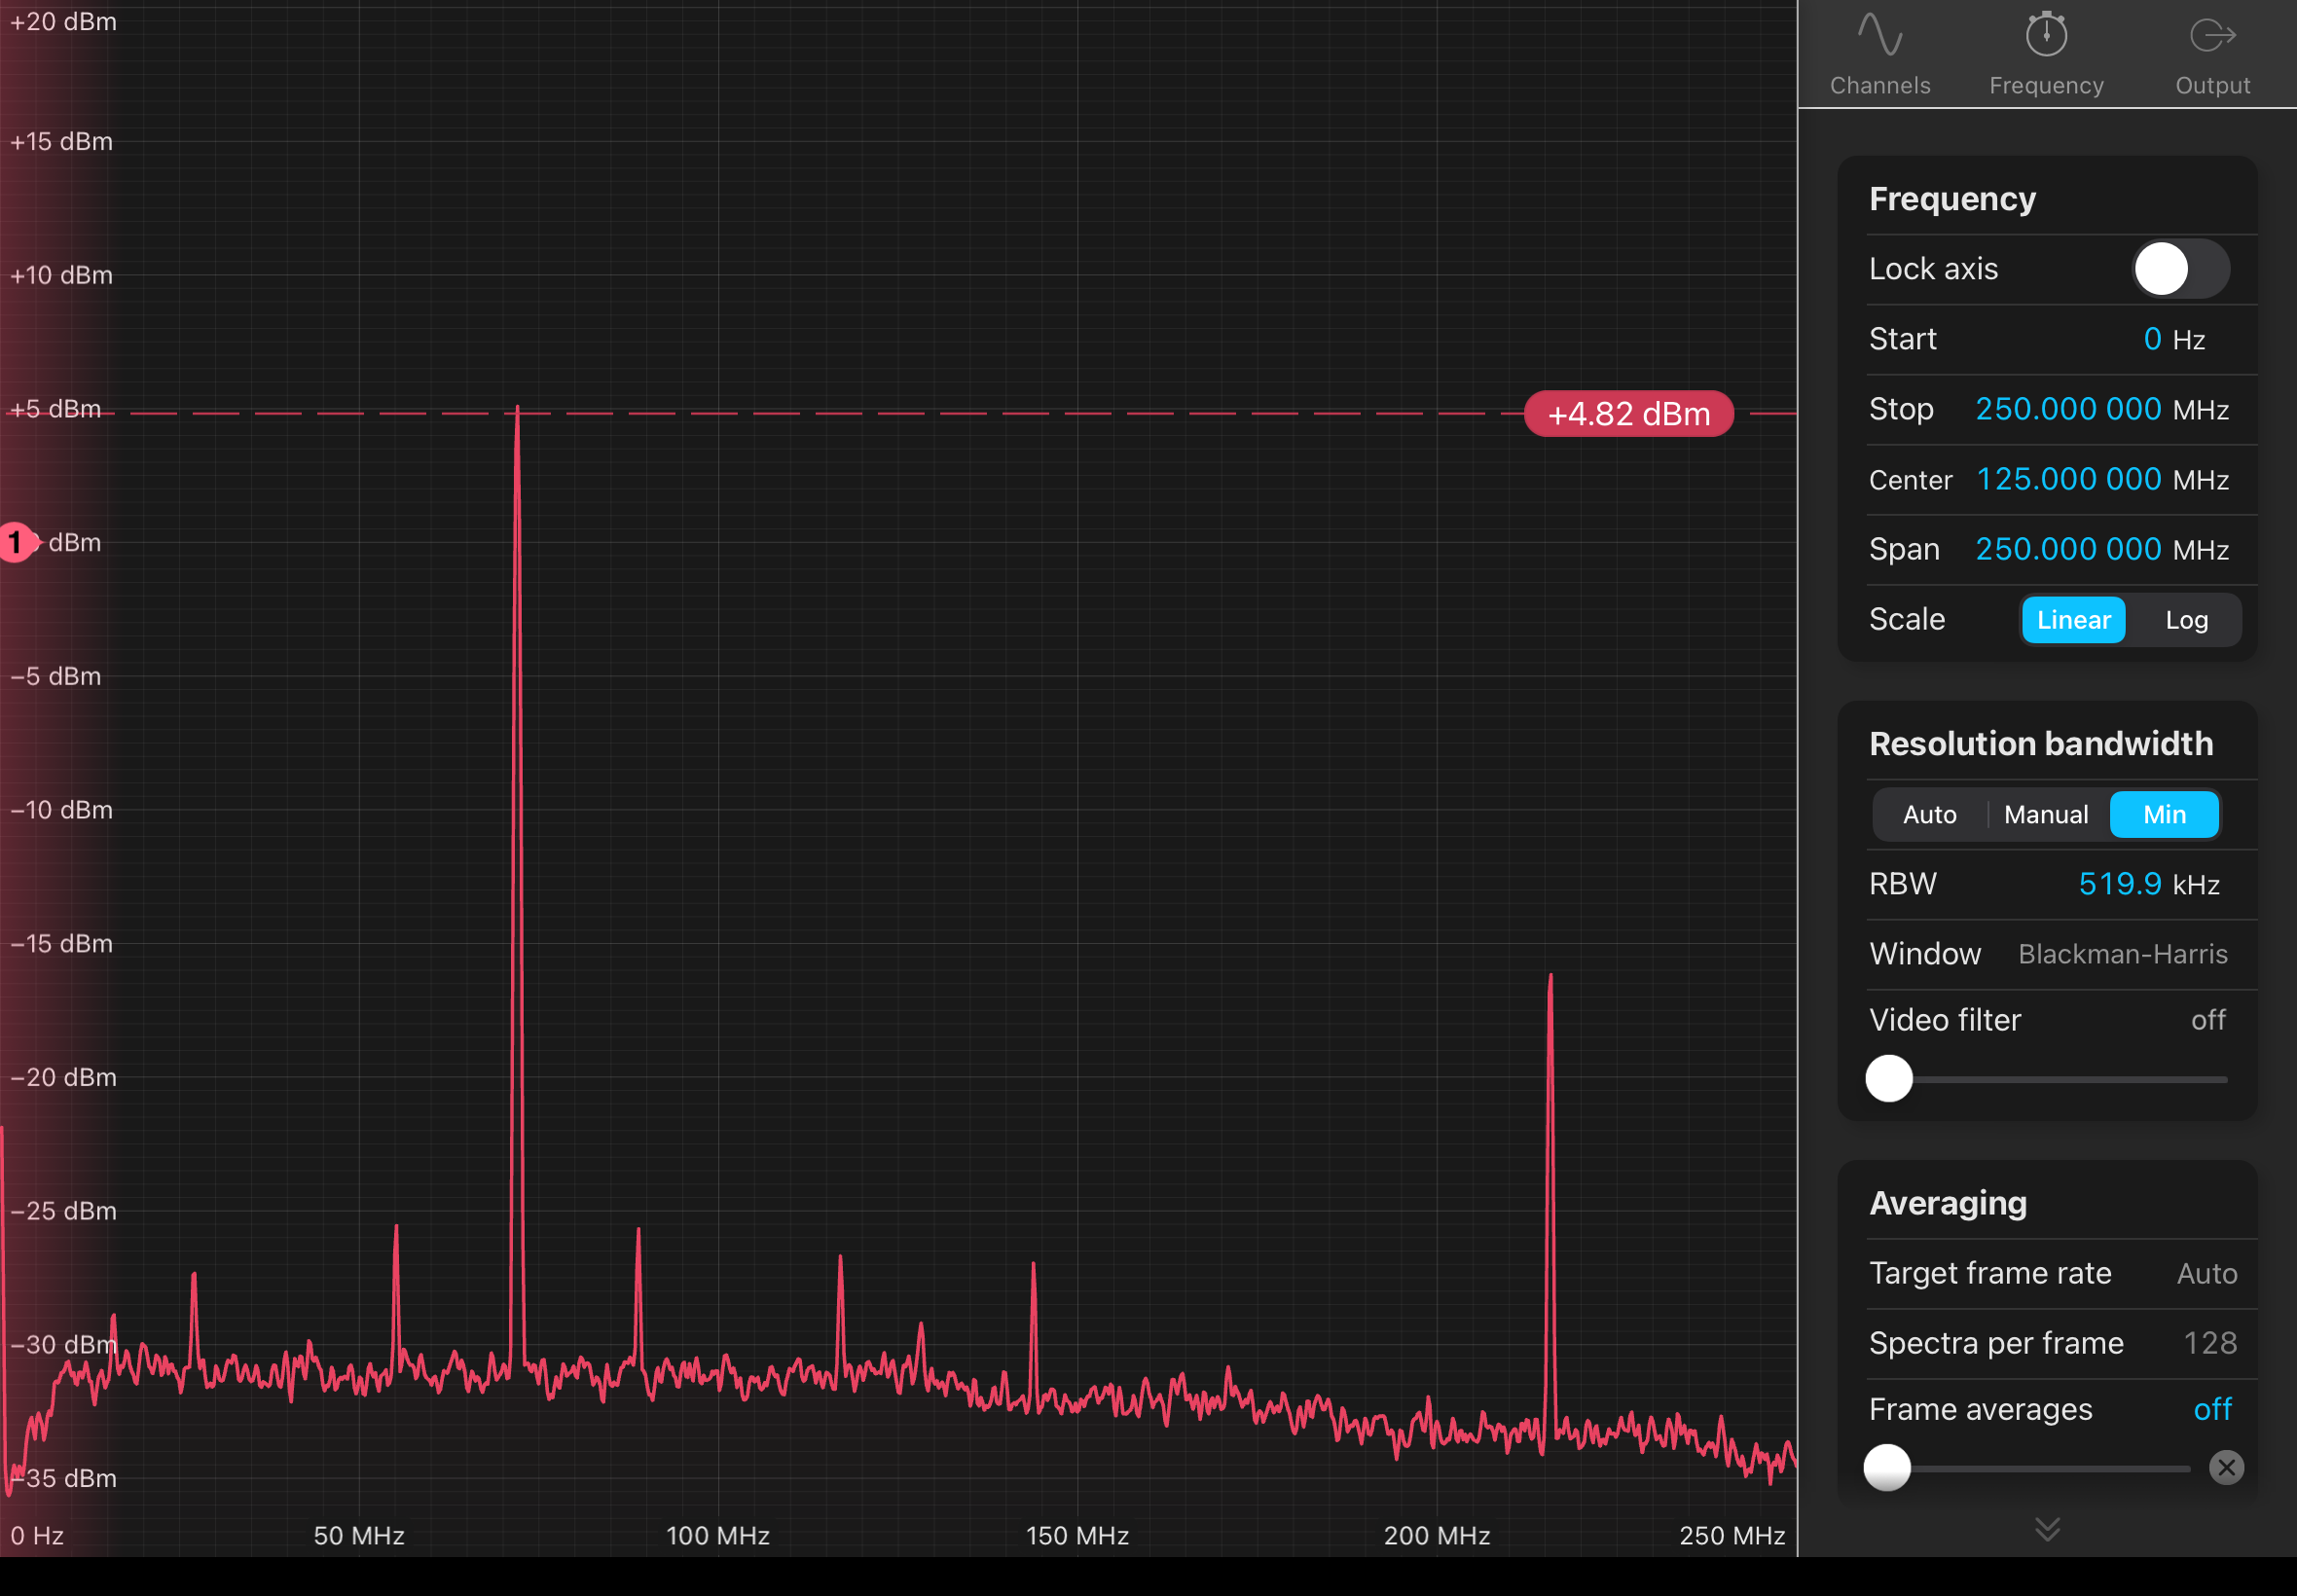
  • Next, the optical powers measured immediately before the RFPD in the PLL path were 45.5 μW for the main laser and 2.122 mW for the sub-laser. Since the sub-laser power might have been too high, the ND filter in the sub-laser path was changed from OD = 0.5 to OD = 0.6. The sub-laser power was then remeasured and found to be 1.349 mW. The PLL optical path was then realigned to maximize the beat signal (Fig. 5), resulting in a beat signal amplitude of approximately 4.82 dBm. Using a filter similar to that employed in klog:37052 and setting the LO frequency equal to the beat frequency, the PLL successfully locked. Furthermore, changing the LO frequency caused the beat frequency to follow accordingly, confirming proper PLL operation. Next, an attempt was made to scan the SRY by sweeping the LO frequency. However, clean fringes such as those shown in Fig. 4 were not observed. In addition, even while the PLL was locked, the beat frequency occasionally drifted spontaneously by several MHz, indicating that further adjustment of the loop filter is necessary to stabilize the lock. The open-loop transfer function will also need to be measured. Furthermore, a piezo driver will be introduced in order to drive the PZT over a wider frequency range.

Images attached to this comment
Search Help
×

Warning

×