[Fujimoto, Tanaka, Hirose]
This is a continuation of klog37368.
Based on the demodulation phase plots of the sensing matrix measured in klog37368, we adjusted the demodulation phases of the WFS signals. And we tried to WFS control to BS roughly.
Phasing
-
REFL QPDA1 RF17
For REFL QPDA1 RF17, the responses of PR3, SR3, and BS were almost orthogonal in the demodulation phase plot. Therefore, we rotated the demodulation phase by 73.5deg to minimize the PR3 response in the I signal.
However, when we checked the power spectrum, the WFS signal still showed a correlation with the PR3 OPLEV signal, as seen before. Therefore, we concluded that it is difficult to use REFL QPDA1 RF17 for BS control. (I will summarize the details later.)
-
AS QPDA2 RF28
For AS QPDA2 RF28, we set the demodulation phase to +46.6 deg to reduce the SR3 and PR3 responses in the I signal as much as possible. At this phase, the expected response ratio of BS, SR3, and PR3 is [BS : PR3: SR3 = 0.148[cnt/urad]: 0.0401[cnt/urad]: 0.0472[cnt/urad] = 1 : 0.271 : 0.319].
To check whether the measured responses follow the demodulation phase plot of the sensing matrix, we measured the transfer functions with the demodulation phases set to 0 deg, +46.6 deg, and −46.6 deg.
When BS was excited, the measured response approximately followed the demodulation phase plot of the sensing matrix. However, this was not the case when SR3 was excited. The reproducibility of the SR3 measurement needs to be checked. (I will summarize the details later.)
Input matrix and preliminary control test
After rotating the demodulation phase of AS QPDA2 RF28 by +46.6 deg, we also measured the sensing matrix in the YAW direction. Since the signal was larger in Q than in I for YAW, we decided to use the I signal for PIT and the Q signal for YAW.
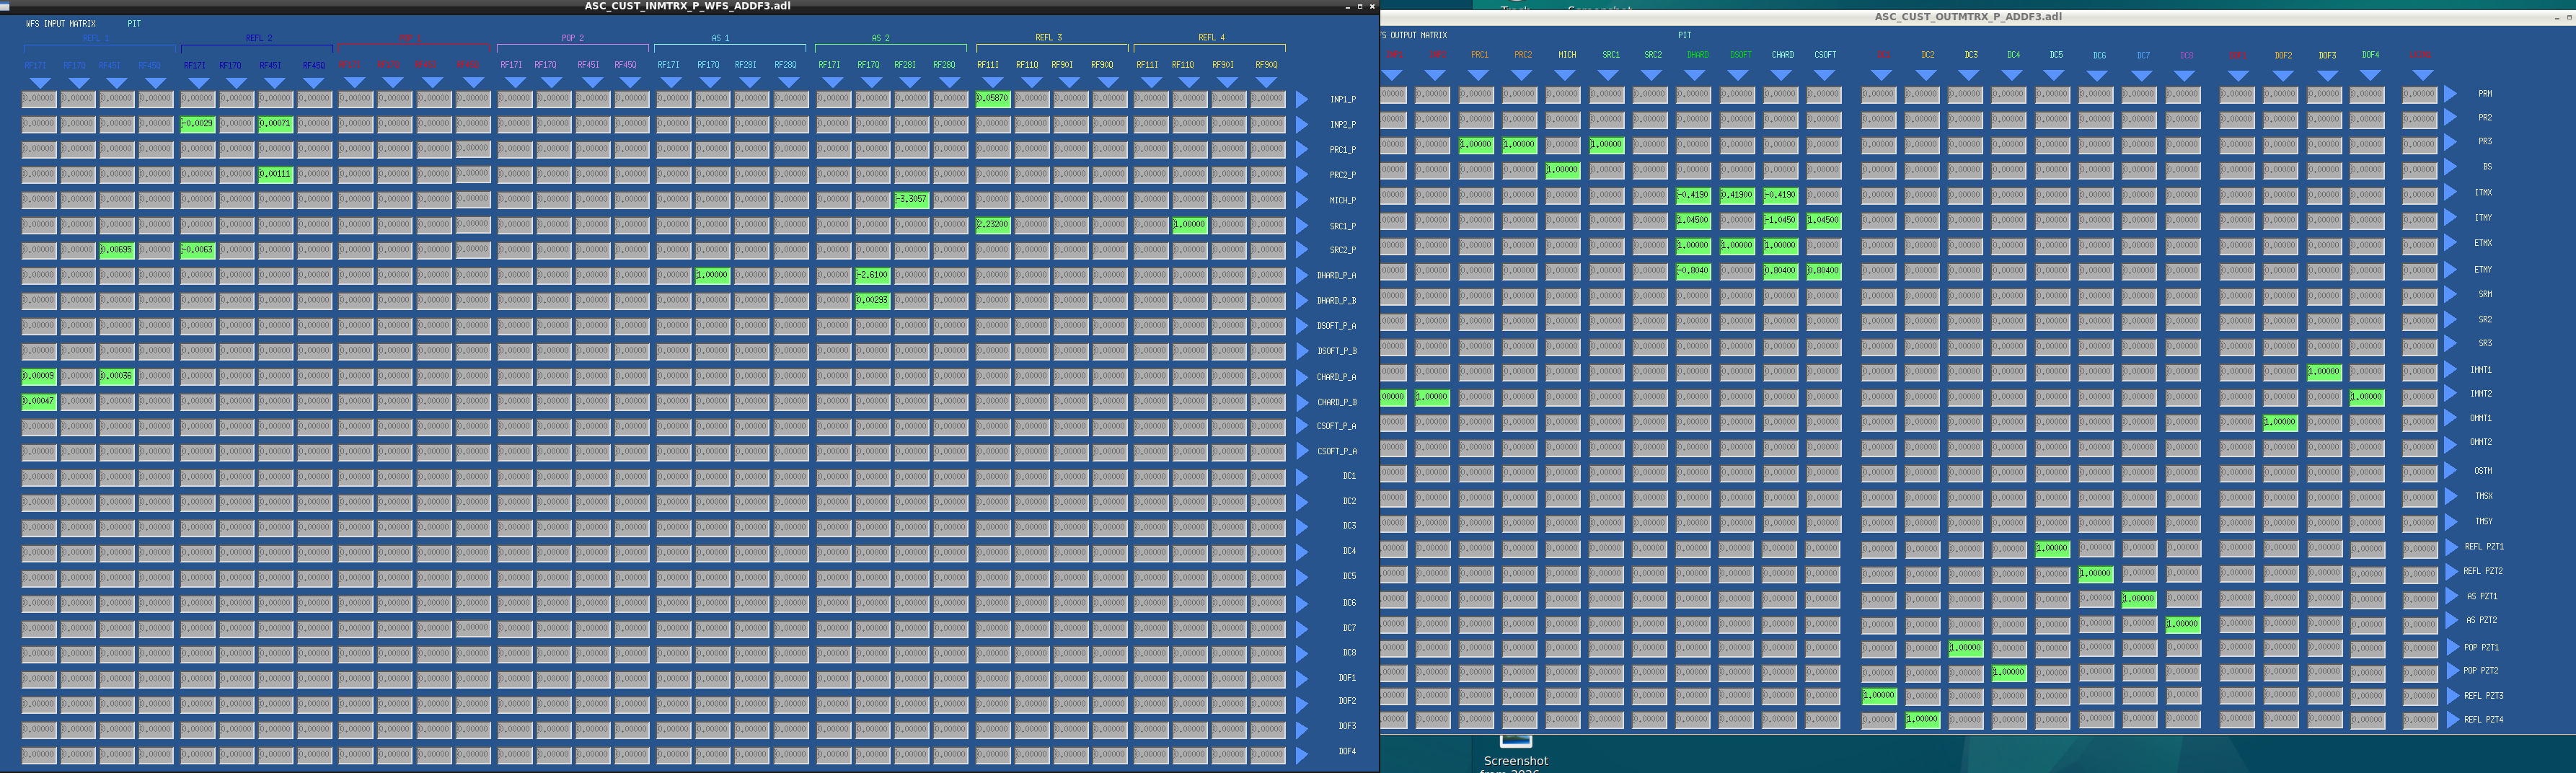
For each direction, we calculated the inverse of QPD signal / OPLEV signal and used it as the coefficient in the input matrix. The input matrix was applied to the MICH filter on ASC_OVERVIEW MEDM screen.
- Before applying the input matrix: FIG1, FIG2
- After applying the input matrix: FIG3, FIG4
With this configuration, we added an integrator and (very low) gain and turned on the BS WFS control. Before turning on the control, we added an offset so that the error signal stayed at the same position as before the control was engaged. (FIG5)
The control did not oscillate. However, when we increased the gain further, the fluctuation of POPRF90 became larger, possibly due to gain peaking.
When the SRM ADS was turned on together with the BS WFS control, both SRM and BS continued to move in the same direction at DC. This may indicate that the BS WFS and SRM ADS are competing with each other.
Also, when the WFS offset was set to zero, both POP90 and AS34 decreased.(FIG6)
Next step
- In this test, we used only one QPD for a rough lock test. To decouple the other degrees of freedom properly, we will use multiple QPD signals and combine them to cancel the responses from the other degrees of freedom.
- Since the WFS signals currently show larger responses to SR3 and PR3 than to BS, we will try using WFS control for SR3 and PR3 instead. In that case, we will turn the BS ADS back on.