[Aritomi, Ushiba, Tanaka, Saito]
Sub-laser light was injected into the SRY, PRY, PRX, and SRX, and a PLL was established. The LO frequency was then swept to scan the beat signal. Using the maximum hold function of the Moku:Lab spectrum analyzer, transmission power as a function of frequency was recorded around 190 MHz, 160 MHz, 140 MHz, −140 MHz, −160 MHz, and −190 MHz. The data were fitted both with and without a linear background, and the maximum and minimum peak frequencies within the corresponding fitting uncertainties were determined. The cavity lengths were then calculated from these results. The differences between the measured cavity lengths and the design values were 0.15 ± 0.33 cm for PRY and 1.58 ± 0.82 cm for SRY. Therefore, the PRY measurement is consistent with the design value within its uncertainty of 0.33 cm, whereas the SRY measurement differs from the design value by more than the estimated uncertainty, suggesting that the actual cavity length may differ from the design value. The results for PRX and SRX will be reported after the analysis is completed.
- As in the previous measurement (klog:37201), sub-laser light was injected into the SRY, PRY, PRX, and SRX, and a PLL was established. The beat signal was observed using the RFPD installed at OMC REFL. The LO frequency was then swept to scan the beat signal. Using the maximum hold function of the Moku:Lab spectrum analyzer, transmission power as a function of frequency was measured around 190 MHz, 160 MHz, 140 MHz, −140 MHz, −160 MHz, and −190 MHz for each cavity. Here, negative frequencies correspond to the case where the sub-laser frequency was lower than that of the main laser.
-
For the data near each resonance peak, fitting was performed both with and without a linear background, following the same procedure as in the previous analysis (klog:37201). From the fitted peak frequencies and their uncertainties, the maximum and minimum frequencies within the fitting uncertainty were determined. The overall uncertainty range was then defined as the largest and smallest values obtained from both fitting models. The following data were used to determine the PRY and SRY cavity lengths.
PRY
Minimum (MHz) Maximum (MHz)
186.9049 186.9561
163.8426 163.8974
131.4761 131.5159
-115.5105 -115.4909
-157.0807 -157.0589
-189.4049 -189.3442
SRY
Minimum (MHz) Maximum (MHz)
186.8354 186.9305
166.0559 166.2530
131.4035 131.4918
-127.2003 -126.2609
-159.4324 -159.3557
-189.3570 -189.2707
-
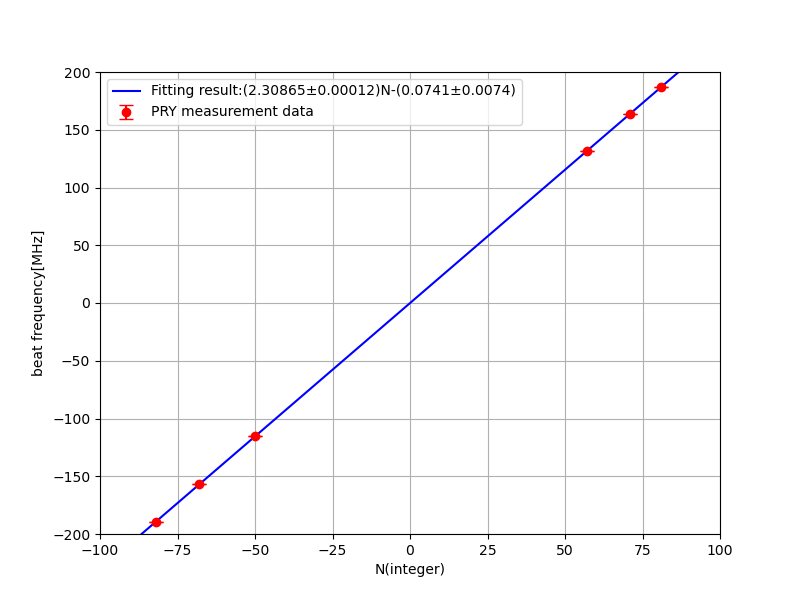
From the measurement results, the midpoint between the minimum and maximum frequencies was calculated for each resonance. These midpoint frequencies were divided by the FSR calculated from the design cavity lengths (64.9265 m for PRY and 64.9264 m for SRY). The resulting values were rounded to the nearest integers, and the measured frequencies were fitted with the linear function AN+B, where A and B are fitting parameters and N is the rounded integer. The fitting results were as follows.
PRY (Fig. 1)
A: 2.30865 ± 0.00012 MHz
B: −0.0741 ± 0.0074 MHz
SRY (Fig. 2)
A: 2.30815 ± 0.00029 MHz
B: −0.092 ± 0.021 MHz
-
Since A corresponds to the FSR, the cavity lengths were calculated from the fitted values of A.
PRY
Measured cavity length: 64.9280 ± 0.0033 m
Design value: 64.9265 m
Difference (measured − design): 0.15 ± 0.33 cm
SRY
Measured cavity length: 64.9422 ± 0.0082 m
Design value: 64.9264 m
Difference (measured − design): 1.58 ± 0.82 cmTherefore, the PRY measurement is consistent with the design value within the uncertainty of 0.33 cm. In contrast, the difference between the measured and design values for SRY exceeds the estimated uncertainty, suggesting that the actual SRY cavity length may differ from the design value. The results for PRX and SRX will be posted once the analysis has been completed.