[Aritomi, Ushiba, Tanaka, Saito]
The sub-laser was injected into SRY, and the PLL was engaged while the LO frequency was swept to scan the beat signal. Using the maximum hold function of the Moku:Lab spectrum analyzer, the SRY transmitted power was recorded as a function of frequency. Because the slopes on the two sides of the resonance peak were different, the data were fitted both with and without a linear background offset. The two fitting methods yielded resonance frequencies differing by approximately 47.9 kHz. If this difference is regarded as the fitting uncertainty, it is comparable to the measurement uncertainty reported previously (klog:37191). The PLL UGF was then reduced to narrow the beat-signal linewidth, and the measurement and fitting procedure was repeated. However, the fitted resonance frequencies with and without a linear background offset differed by approximately 143 kHz, indicating that the fitting uncertainty was not improved. To achieve more accurate fitting, it will likely be necessary to suppress fluctuations in the beat-signal amplitude and reduce the influence of higher-order modes.
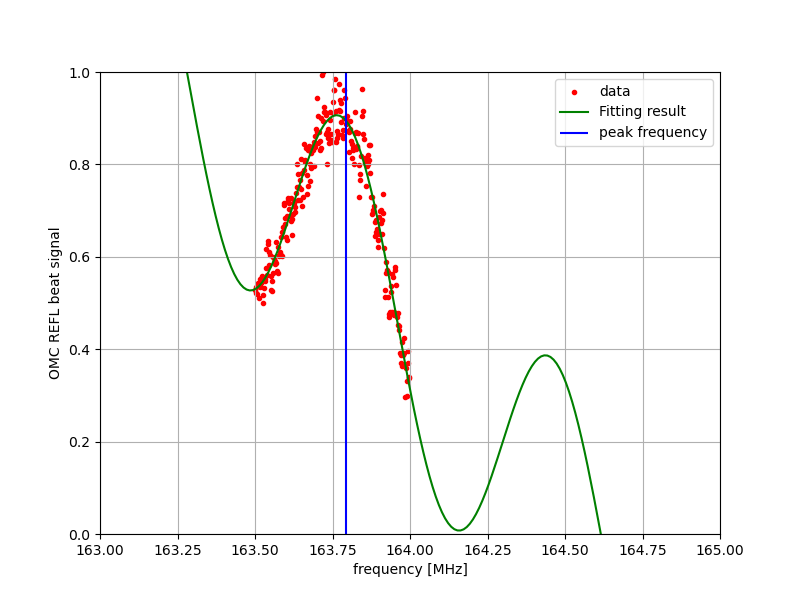
- The sub-laser was injected into SRY, the PLL was engaged, and the beat signal was observed using the RFPD installed at OMC REFL. The LO frequency was then swept to scan the beat signal. The maximum hold function of the Moku:Lab spectrum analyzer was used to obtain the transmitted power of SRY as a function of beat frequency (Fig. 1). In Fig. 1, the orange trace represents the maximum-hold spectrum, while the red trace shows the instantaneous beat signal. The data between 163.5 MHz and 164.0 MHz were fitted using Φ=A*f−B,P_t=C/(1+D(sin(Φ/2))^2), where f is the beat frequency. The fitted resonance frequency was 163.7443 ± 0.0017 MHz. However, as shown in Fig. 1, the slopes on the two sides of the resonance peak were asymmetric, and the fitted curve did not perfectly reproduce the measured data. Based on a suggestion from ChatGPT that a linear background should be included for such asymmetric data, the data were also fitted using Φ=A*f−B,P_t=C/(1+D(sin(Φ/2))^2)+E*f+F, where E and F represent the linear background terms (Fig. 3). This fit yielded a resonance frequency of 163.7922 ± 0.0057 MHz. The fit including the linear background appears to reproduce the measured data better than the fit without the background. However, the resonance frequencies obtained from the two fitting methods differ by approximately 47.9 kHz. Therefore, if this difference is regarded as the fitting uncertainty, it is comparable to the uncertainty obtained in the previous measurement (klog:37191).
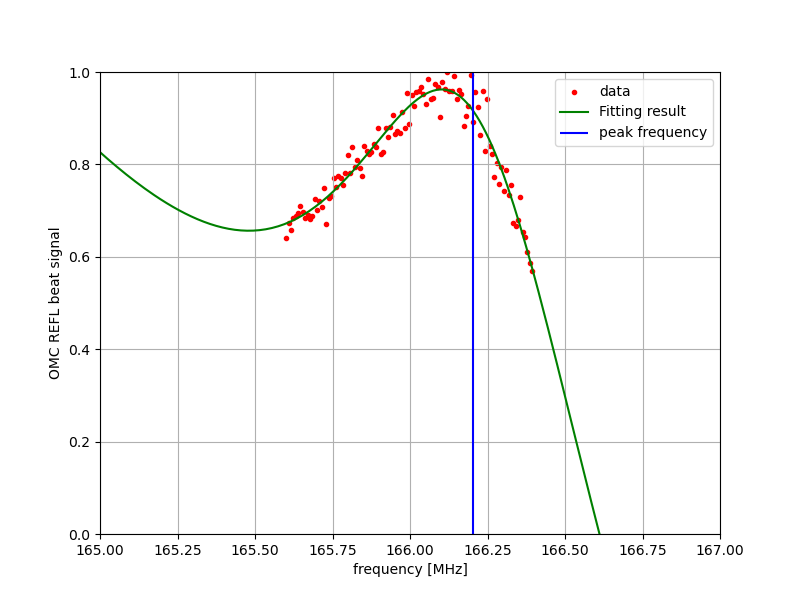
- Next, an attempt was made to perform the PLL using the SRMI signal, but the PLL could not be locked. The SRM gain was also increased while measuring SRY, but no noticeable improvement was observed. The SRM gain was then restored to its original value, and the PLL UGF was reduced in order to narrow the beat-signal linewidth and thereby improve the acquisition of the maximum-hold spectrum during the LO frequency sweep. The UGF was reduced by changing the gain of the Moku:Lab filter from 0 dB to −40 dB. The LO frequency was swept again, and another transmission spectrum of SRY was obtained (Fig. 4). The data between 165.6 MHz and 166.4 MHz were first fitted without a linear background, yielding the result shown in Fig. 5. The fitted resonance frequency was 166.0614 ± 0.0055 MHz. The same data were then fitted with a linear background, as shown in Fig. 6, resulting in a resonance frequency of 166.204 ± 0.049 MHz. As in the previous measurement, the fit including the linear background appears to reproduce the measured data more accurately. However, the resonance frequencies obtained with and without the linear background differ by approximately 143 kHz, indicating that the fitting uncertainty was not improved. These results suggest that achieving more accurate fitting will require suppressing fluctuations in the beat-signal amplitude and reducing the influence of higher-order transverse modes.


 (1).gif)


 (1).gif)