Reports 1-1 of 1 Clear search Modify search
MIF (General)
shun.saito - 3:12 Thursday 09 July 2026 (37178) Print this report
Measurement of the PRC/SRC length using the beat signal at OMC REFL

[Joshua, Tanaka, Disha, Fujimoto, Saito]

To perform the measurement proposed in klog:37169 using the beat signal at the OMC REFL, a new RFPD was installed at OMC REFL. After injecting the sub-laser into PRX and engaging the PLL, the beat signal was successfully observed with the newly installed RFPD. The amplitude and frequency of the beat signal both fluctuated, making it difficult to finely adjust the LO frequency to maximize the beat signal. However, since both the resonance and anti-resonance points were successfully identified, we plan to reduce the effect of these fluctuations by increasing the number of averaging frames on the spectrum analyzer. The beat frequency will then be determined by measuring the minimum and maximum frequencies at which the beat-signal amplitude begins to decrease.


  • The reflected beam from the BS in front of the OMC REFL camera had previously been dumped, so this beam was utilized for the measurement. First, the beam dump was removed, and the beam power was measured to be approximately 3 mW using a power meter. A mirror, a lens with a focal length of 50 mm, an OD = 0.5 ND filter, and an RFPD were then installed (Fig. 1). The lens was inserted to focus the beam onto the RFPD, while the ND filter was used because the maximum allowable input power to the RFPD is 1 mW. The optical power measured immediately before the RFPD was approximately 0.95 mW. The alignment was then adjusted to maximize the DC output of the RFPD.
     
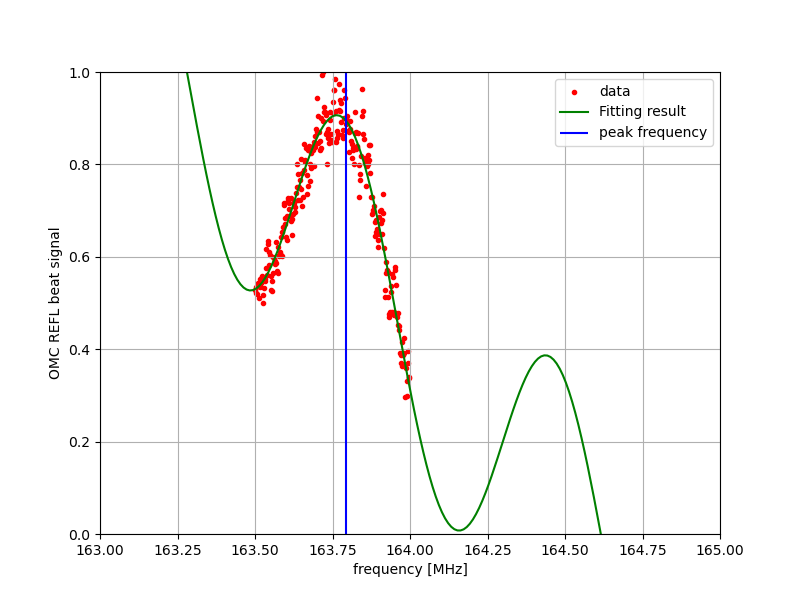
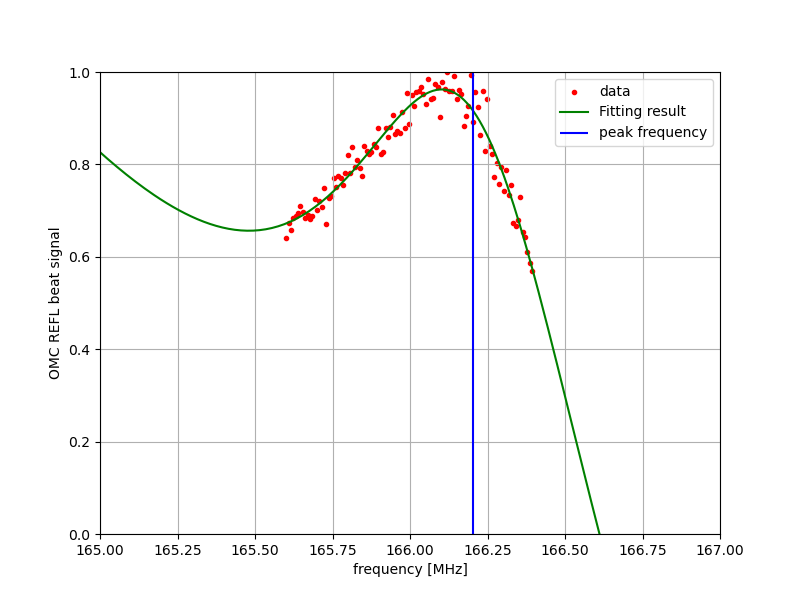
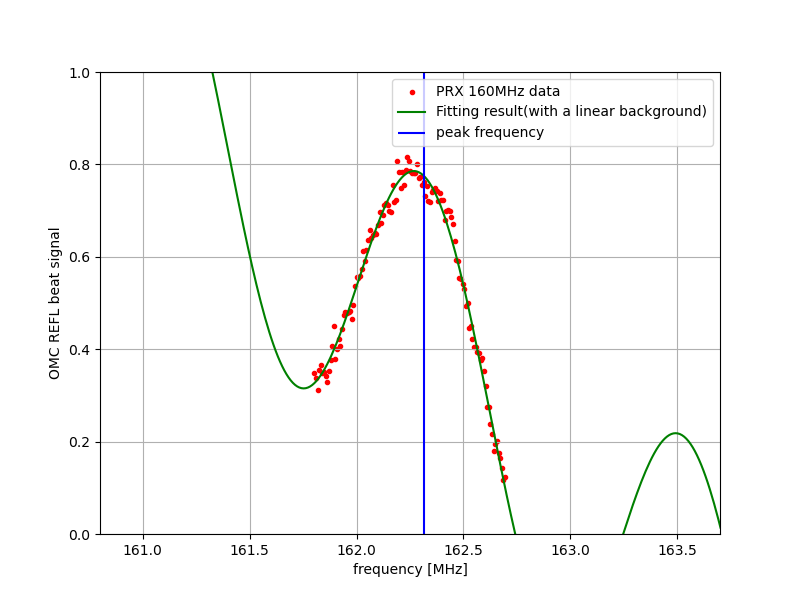
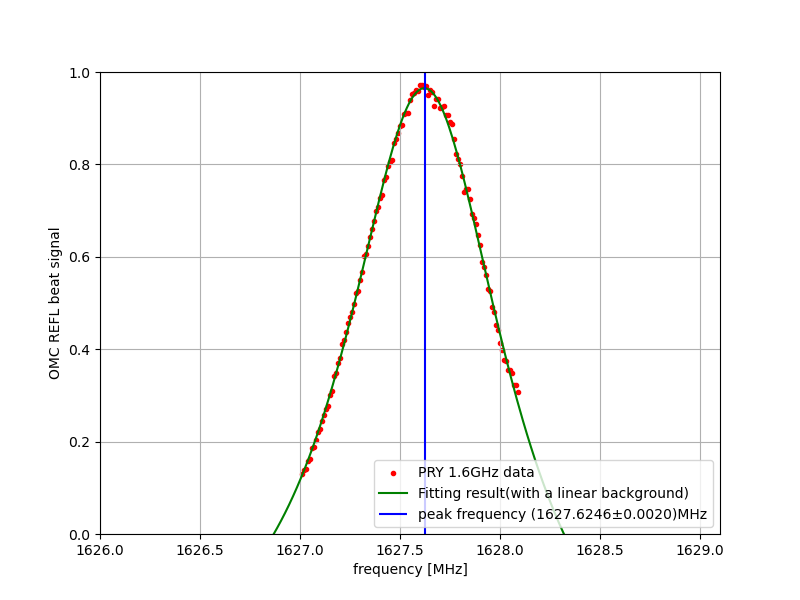
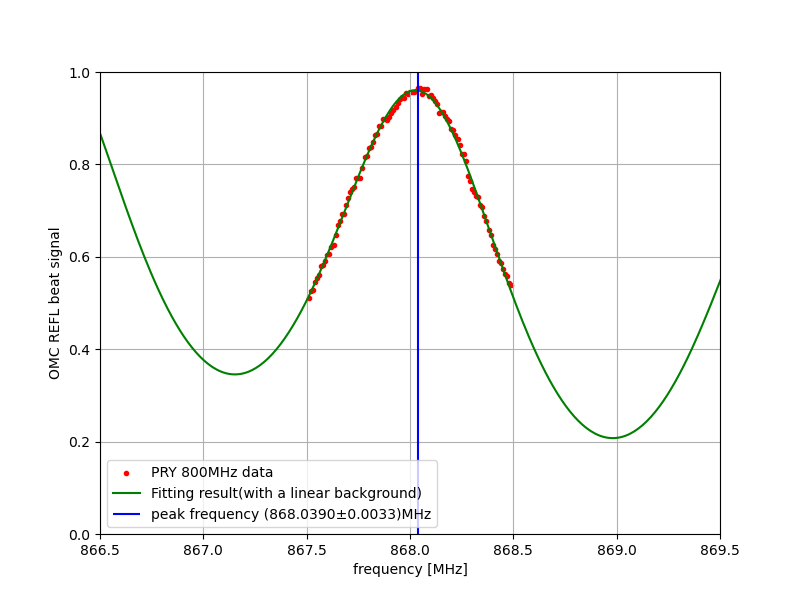
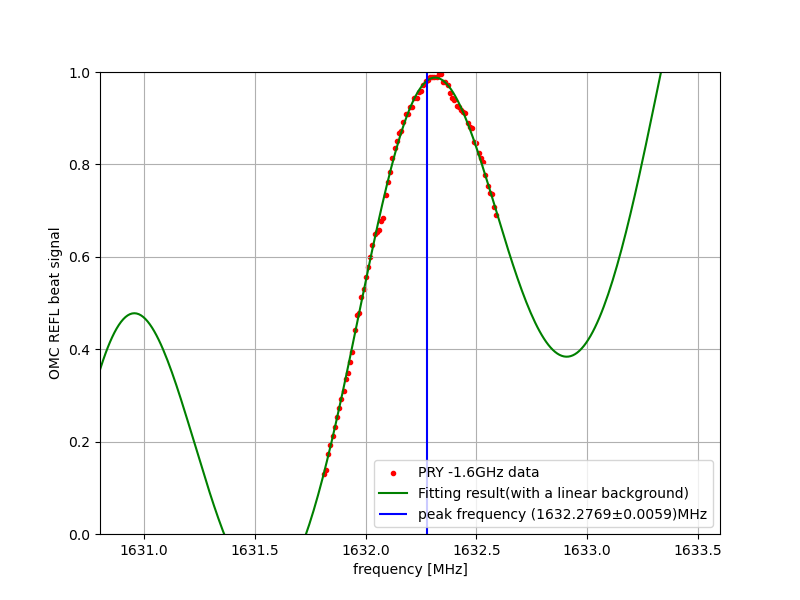
  • Next, the sub-laser was injected into PRX, the PLL was engaged, and the beat signal was observed using the RFPD installed at OMC REFL. The beat signal was successfully detected. However, it was difficult to finely adjust the LO frequency used for the PLL to maximize the beat signal because both its amplitude and frequency fluctuated. Therefore, the LO frequency was swept by ±3 MHz around 160.4 MHz at a rate of 10 mHz. Under these conditions, both the resonance point (Fig. 2) and the anti-resonance point (Fig. 3) were observed. The spacing between adjacent resonance points was approximately 2.2 MHz. Based on these results, we plan to increase the number of averaging frames on the spectrum analyzer to suppress the influence of the fluctuations and determine the beat frequency by measuring the minimum and maximum frequencies at which the beat-signal amplitude begins to decrease.
Images attached to this report
Comments to this report:
shun.saito - 5:20 Friday 10 July 2026 (37185) Print this report

[Tanaka, Fujimoto, Saito]

To observe the beat signal with the RFPD installed at OMC REFL, the vertical axis of the spectrum analyzer was set to a linear scale, and the number of frame averages was increased to make the peak height and frequency easier to identify. During the observation, the beat frequency occasionally shifted toward lower frequencies, sometimes as often as once every few seconds. The No. 3 sub-laser used in this experiment (as identified in the JGW DOC documentation) is known to exhibit frequency-noise events that increase its RMS frequency noise approximately once every 5 s to 2 min, and the occurrence rate closely matched that of the observed beat-frequency shifts. Therefore, these frequency shifts are considered to originate from the frequency noise of the sub-laser. The beat-signal amplitude also fluctuated, which is believed to be caused by fluctuations of PRX. Accordingly, when the beat signal was stable, the LO frequency was varied, and the minimum and maximum frequencies at which the beat-signal amplitude reached its maximum were measured around 160 MHz, 140 MHz, −160 MHz, and −140 MHz. Fitting these measurements yielded a PRX length of 68.27 ± 0.01 m, compared with the design value of 68.2563 m.
 

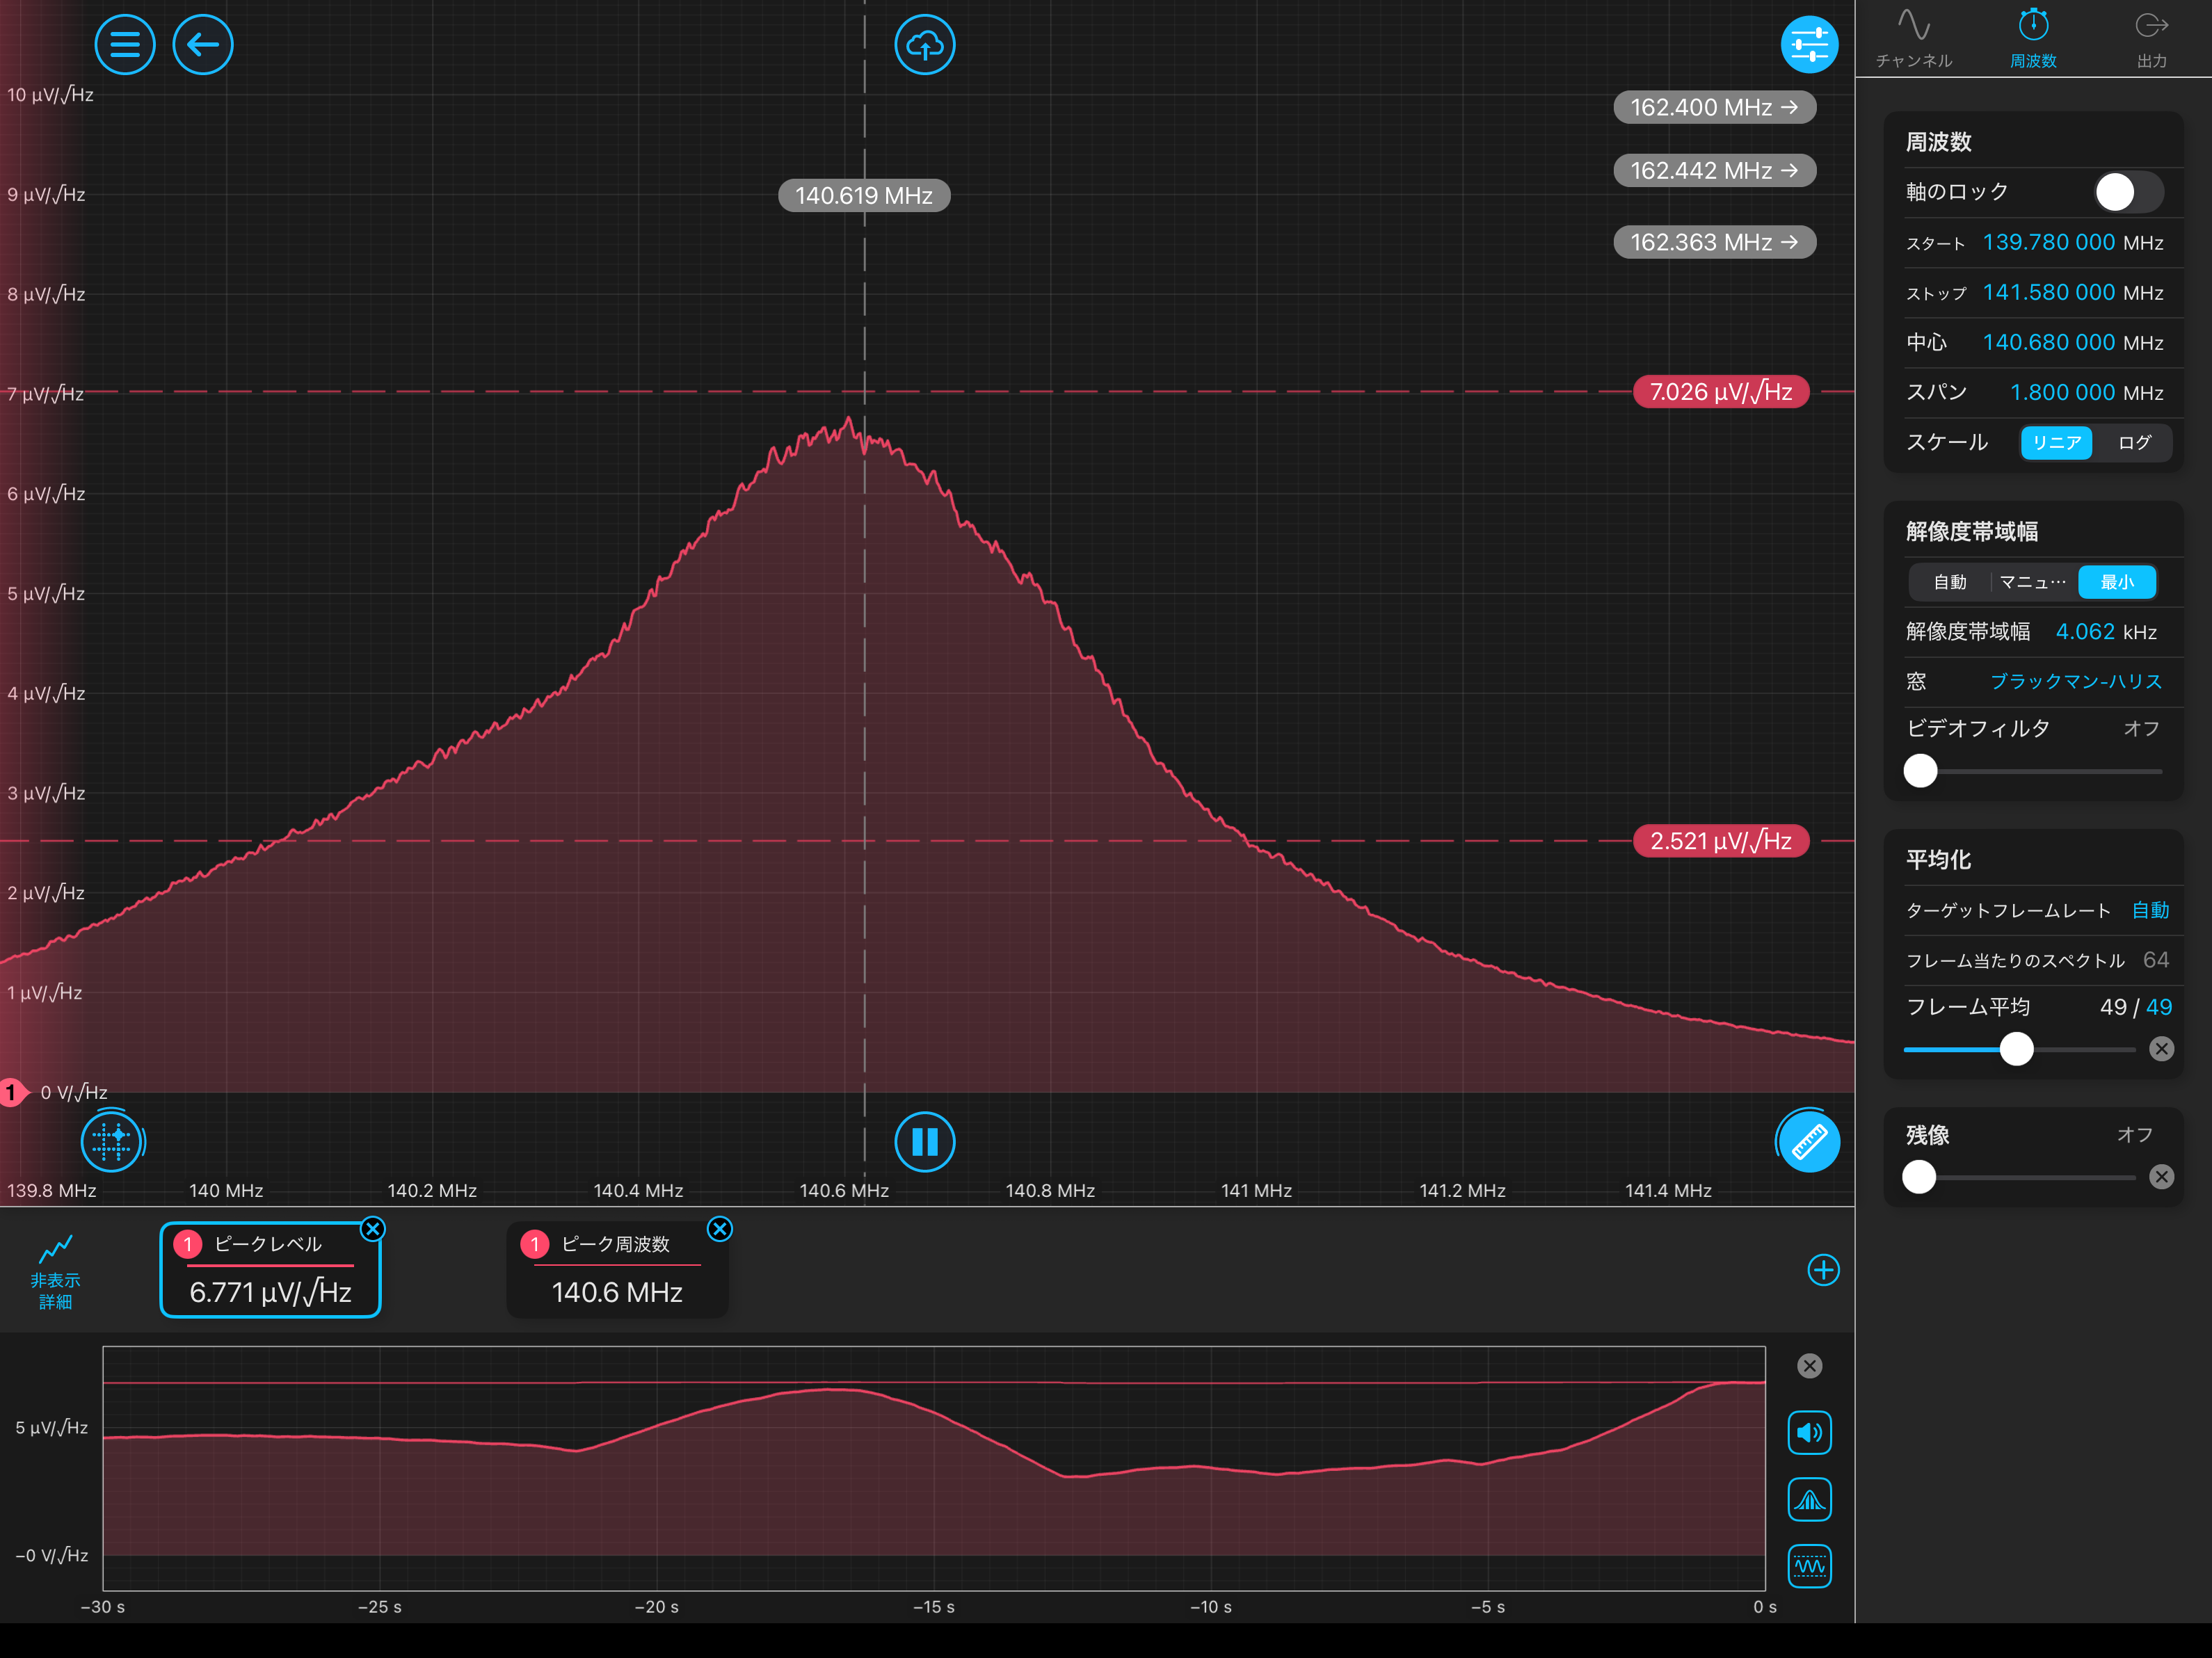
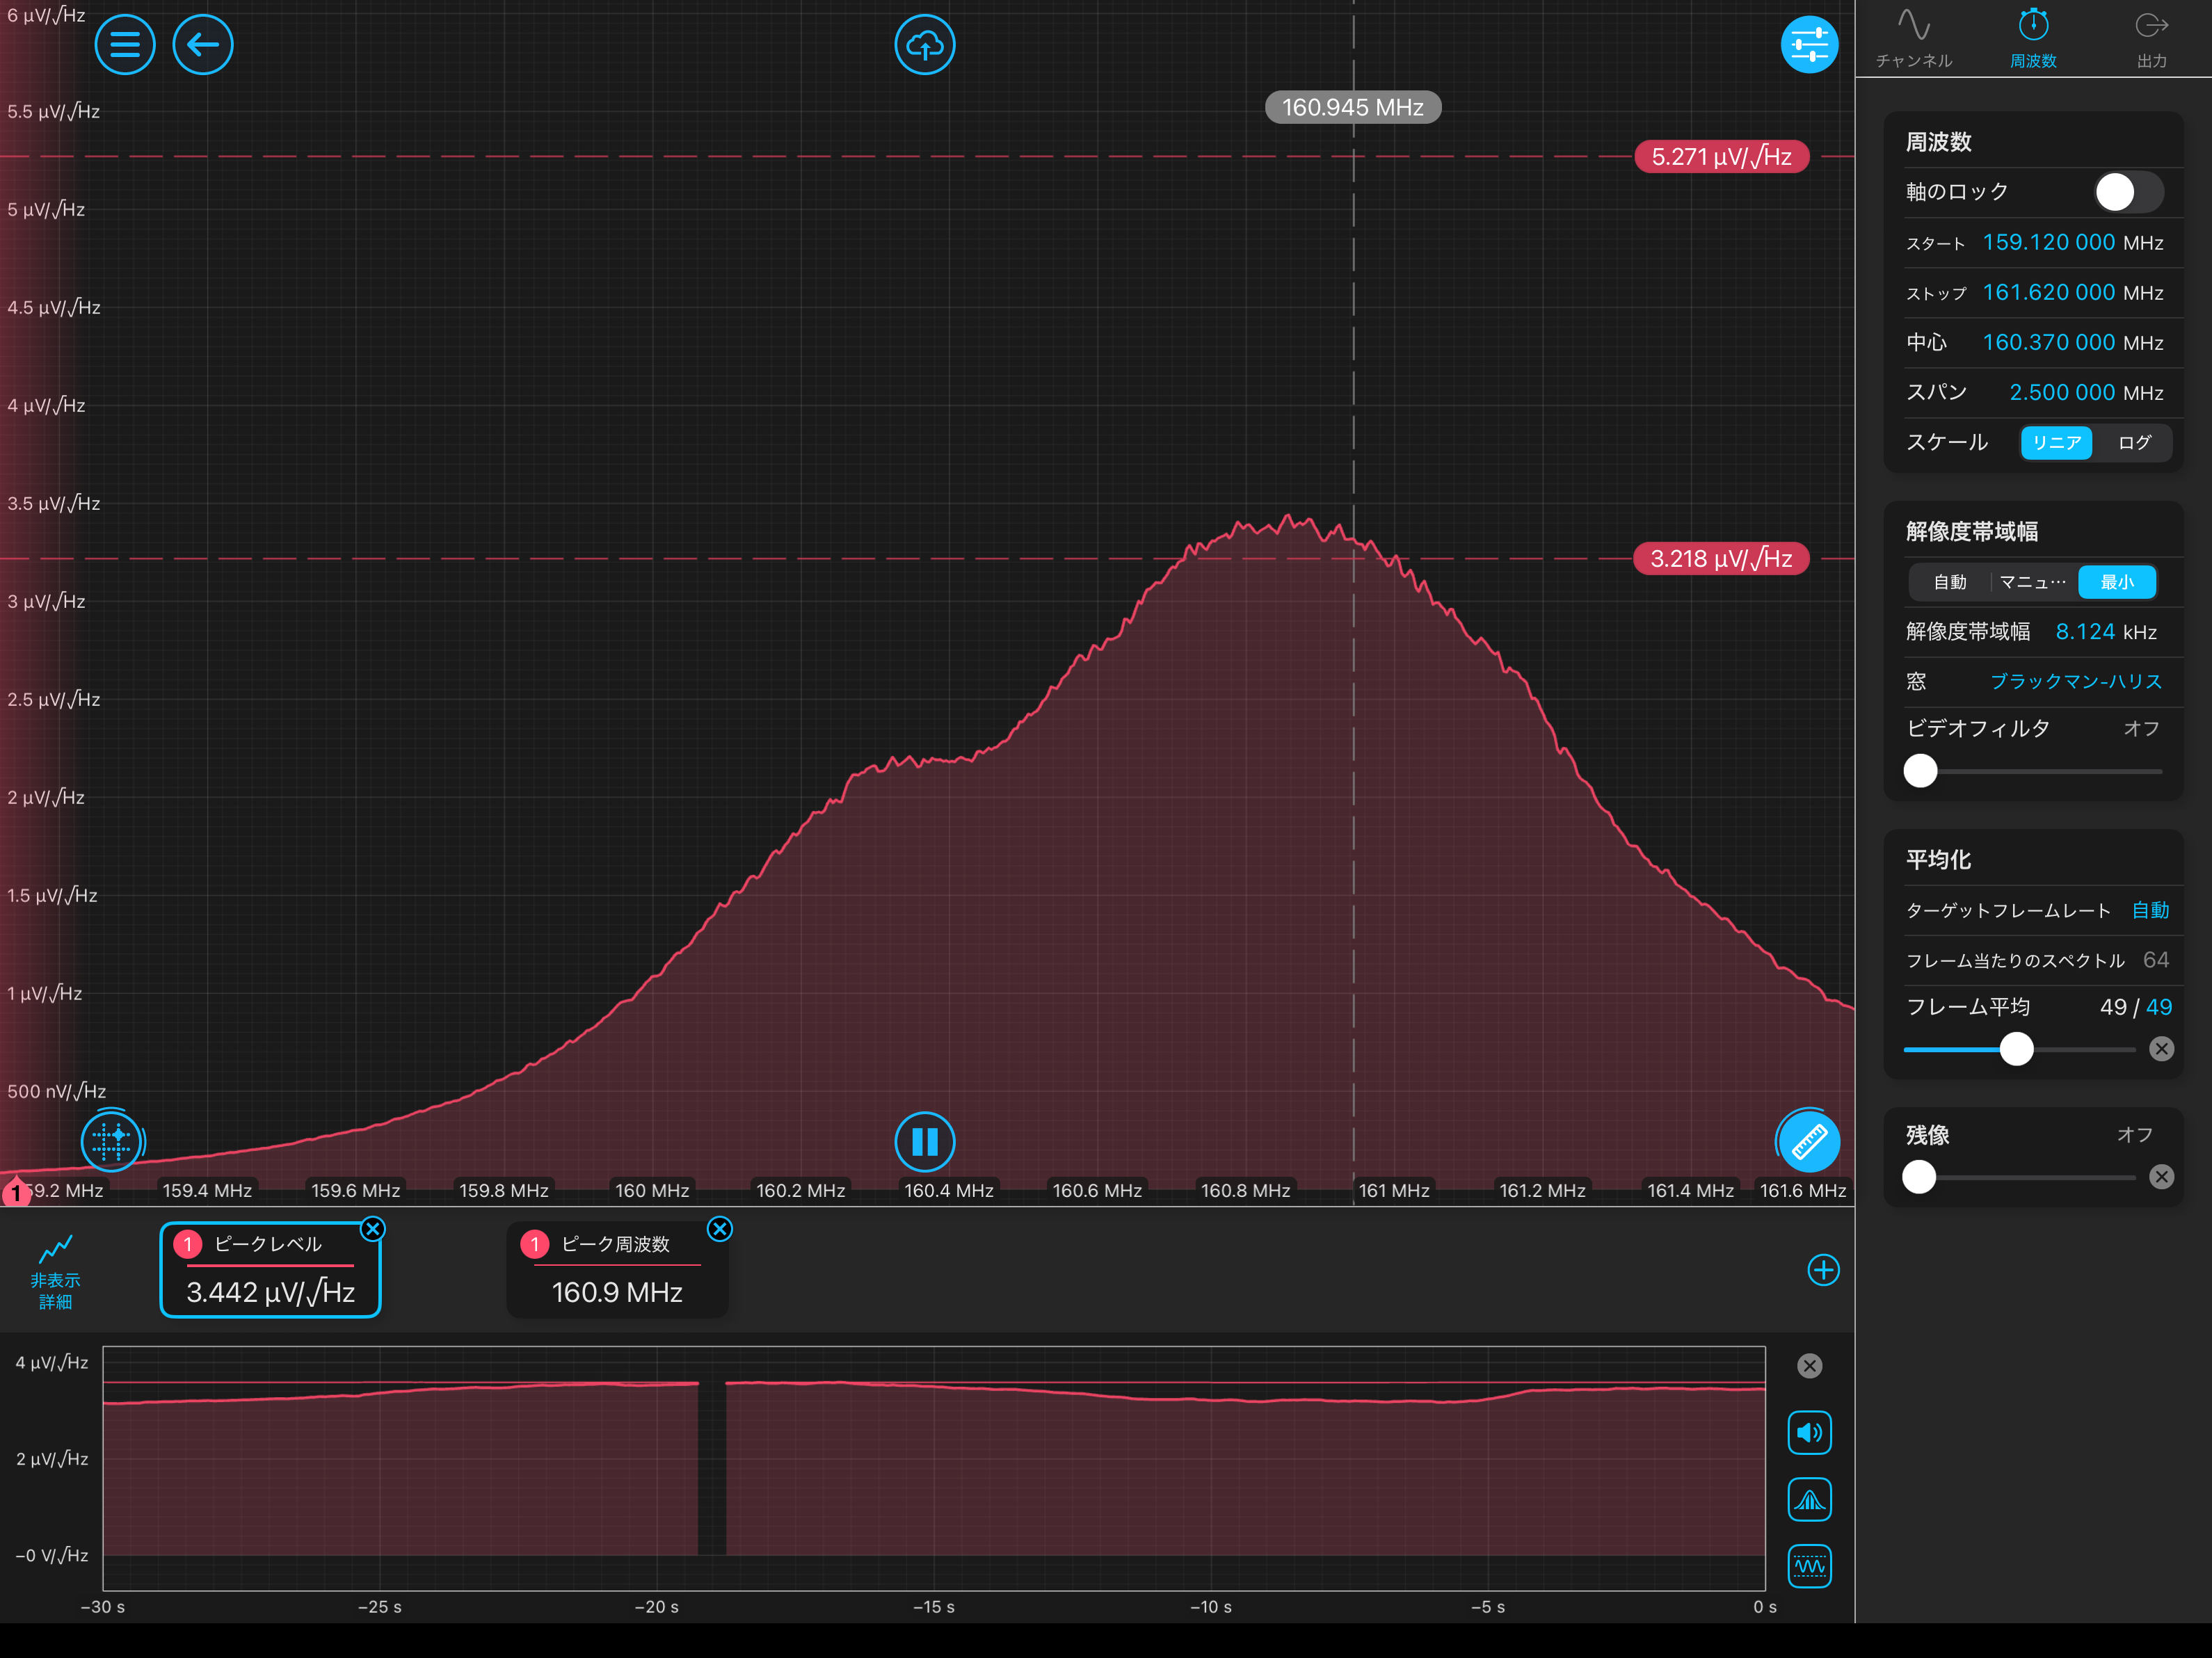
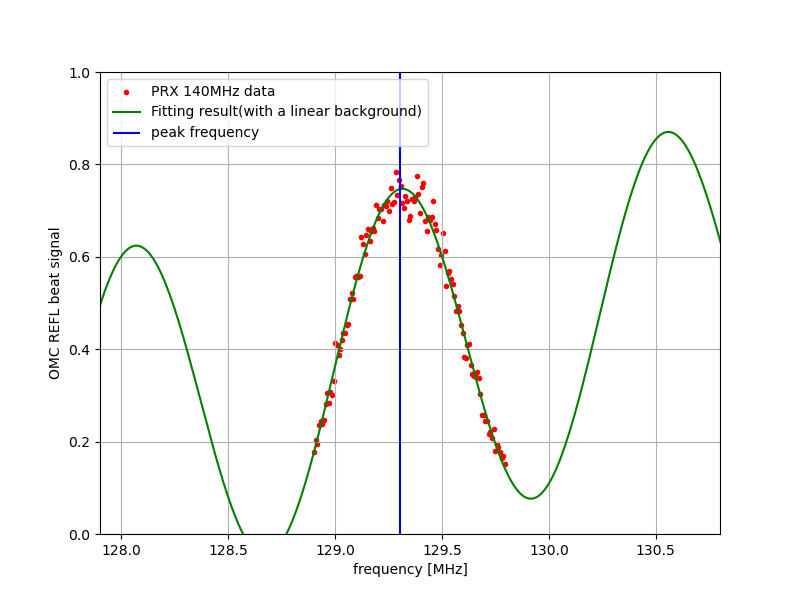
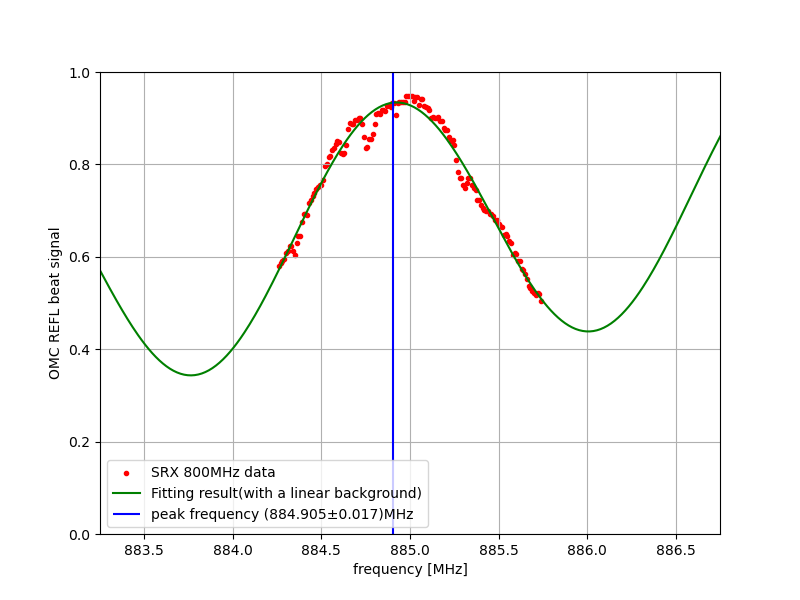
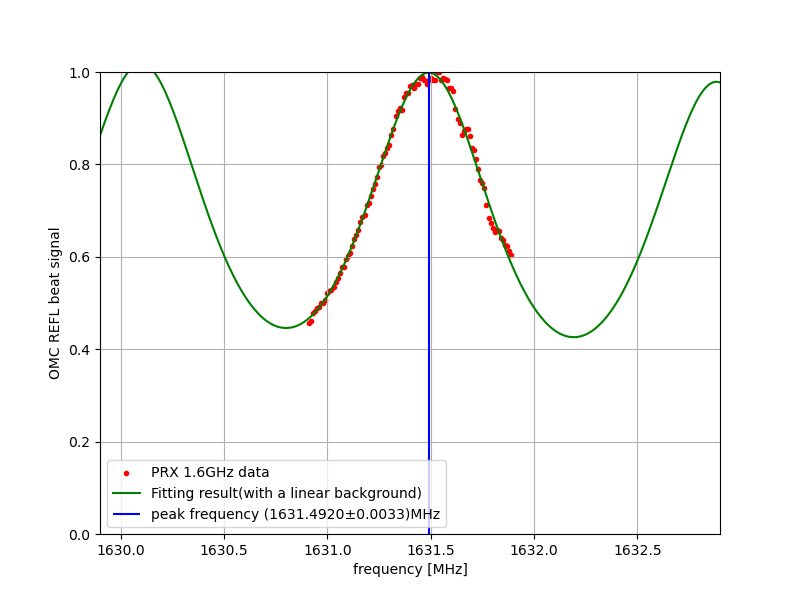
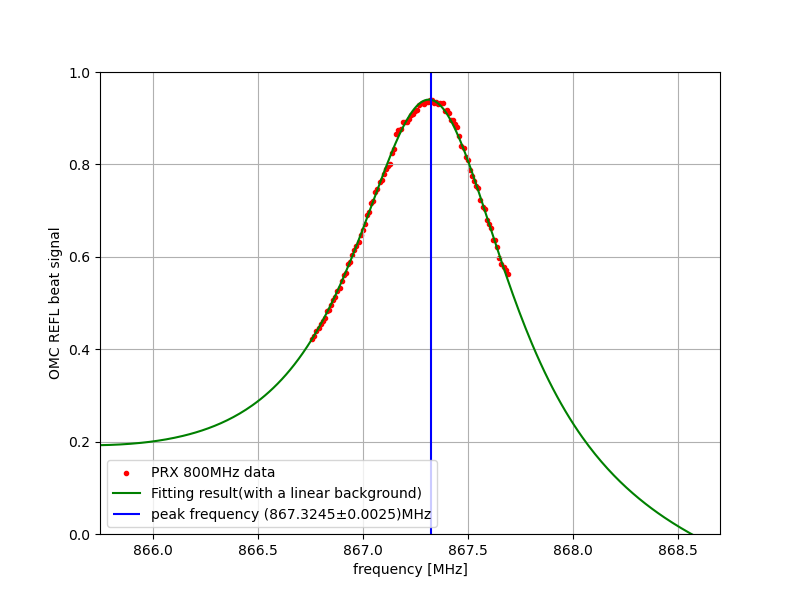
  • The sub-laser was injected into PRX, the PLL was engaged, and the beat signal was observed with the RFPD installed at OMC REFL. The objective was to determine the minimum and maximum frequencies at which the beat-signal amplitude reached its maximum. For this purpose, the vertical axis of the spectrum analyzer was set to a linear scale, and the number of frame averages was increased to improve the visibility of the peak height and frequency. By varying the PLL LO frequency, both the resonance point (Fig. 1) and the anti-resonance point (Fig. 2) were observed. At the anti-resonance point, however, the beat-signal peak appeared to split into two peaks.
     
  • During the measurements, the beat frequency occasionally shifted toward lower frequencies, sometimes as often as once every few seconds. The beat signal in the PLL path exhibited the same frequency shift. Initially, fluctuations of the Moku:Lab LO signal were suspected, so the LO source was switched from the Moku:Lab to the function generator that had originally been used. However, no change was observed. Fluctuations of the main laser were also considered, and an additional control loop was applied to suppress them, but this likewise produced no improvement. On the other hand, the No. 3 sub-laser used in this experiment (as described in the JGW DOC documentation) is known to exhibit frequency-noise events that increase its RMS frequency noise approximately once every 5 s to 2 min, and the occurrence rate closely matched that of the observed beat-frequency shifts. Therefore, the observed frequency shifts are considered to originate from the frequency noise of the sub-laser. The beat-signal amplitude also fluctuated, which is believed to be caused by fluctuations of PRX.
     
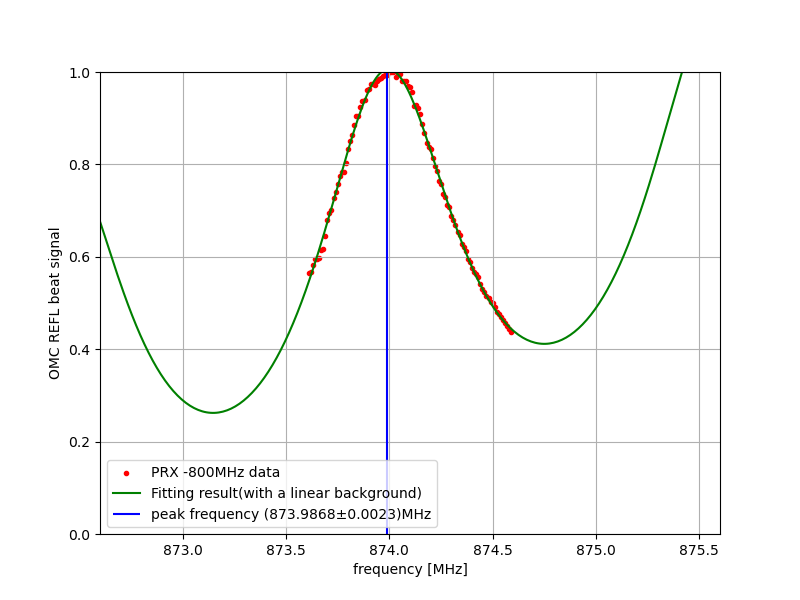
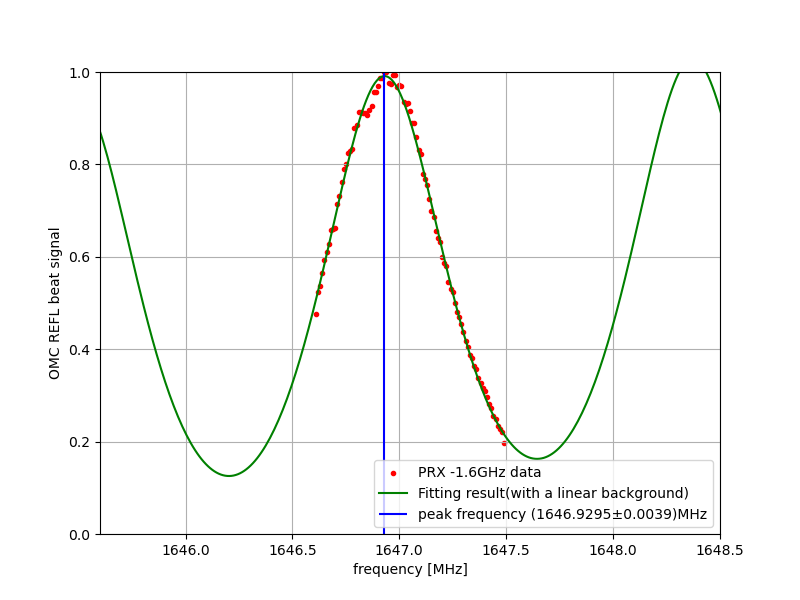
  • Therefore, when the beat signal was stable, the LO frequency was varied, and the minimum and maximum frequencies at which the beat-signal amplitude reached its maximum were measured around 160 MHz, 140 MHz, −160 MHz, and −140 MHz. Negative frequencies correspond to the case where the sub-laser frequency is lower than the main-laser frequency. The measured values are listed below.

    Minimum    Maximum
    162.363 MHz    162.442 MHz
    140.366 MHz    140.494 MHz
    −140.683 MHz    −140.555 MHz (assuming ±0.064 MHz around −140.619 MHz)
    −160.435 MHz    −160.307 MHz (assuming ±0.064 MHz around −160.371 MHz)

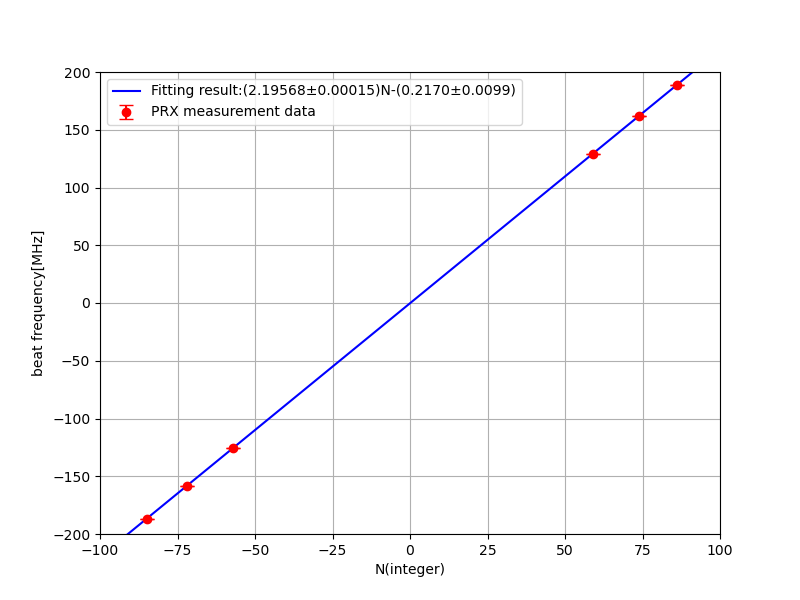
    The midpoint between the minimum and maximum frequencies was then calculated for each measurement. Each midpoint was divided by the FSR calculated from the PRX design length of 68.2563 m. The resulting values were rounded to the nearest integers, and the measured frequencies were fitted with the linear function AN+B, where A and B are fitting parameters and N is the corresponding integer. The fitting results are shown in Fig. 3 and are summarized below:

    A = 2.1957 ± 0.0004 MHz
    B = −0.08 ± 0.03 MHz

    Since A corresponds to the FSR, the PRX length calculated from the fitted FSR is

    Fitted PRX length: 68.27 ± 0.01 m
    Design value: 68.2563 m

Images attached to this comment
shun.saito - 19:53 Saturday 11 July 2026 (37191) Print this report

[Tanaka, Hirose, Fujimoto, Saito]

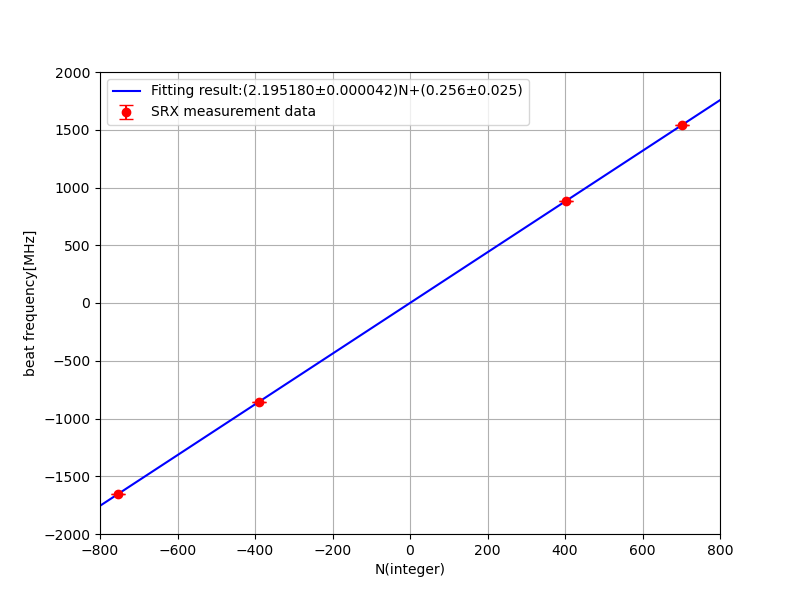
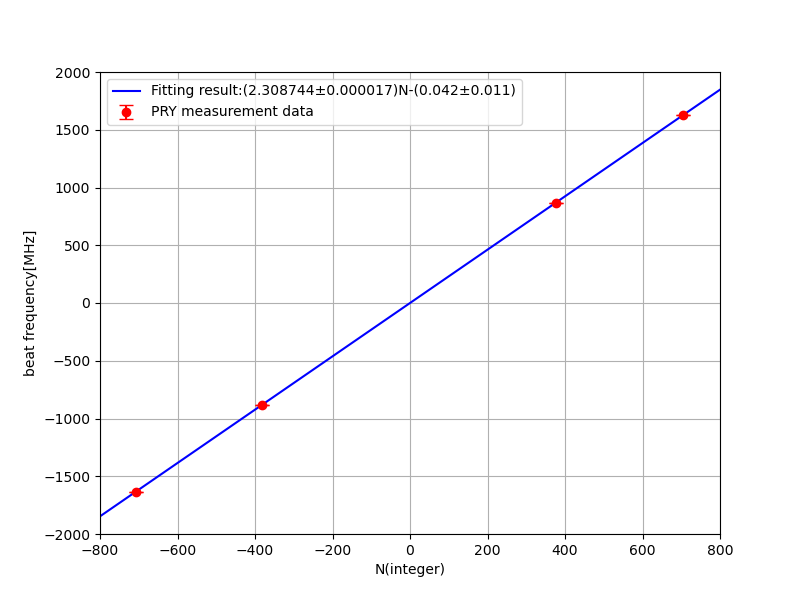
Following the same procedure as in the previous measurement (klog:37185), the lengths of PRY, SRY, and SRX were measured. The differences between the measured and design values were 0.6 ± 1.2 cm for PRY, 1.5 ± 1.3 cm for SRY, and 2.8 ± 1.6 cm for SRX. Therefore, the PRY measurement is consistent with the design value within the measurement uncertainty of 1.2 cm, whereas the differences for SRY and SRX exceed their respective uncertainties, suggesting that their actual lengths may differ from the design values.
 

  • As in the previous measurement (klog:37185), the sub-laser was injected into PRY, SRY, and SRX, the PLL was engaged, and the beat signal was observed with the RFPD installed at OMC REFL. The minimum and maximum frequencies at which the beat-signal amplitude reached its maximum were measured. The results are summarized below.

    PRY
    Minimum    Maximum
    161.501 MHz    161.583 MHz
    138.351 MHz    138.485 MHz (assuming ±67 kHz around 138.418 MHz)
    −140.999 MHz    −140.865 MHz (assuming ±67 kHz around −140.932 MHz)
    −161.783 MHz    −161.649 MHz (assuming ±67 kHz around −161.716 MHz)
    SRY
    Minimum    Maximum
    161.371 MHz    161.492 MHz
    140.6095 MHz    140.7305 MHz (assuming ±60.5 kHz around 140.67 MHz)
    −141.0055 MHz    −140.8845 MHz (assuming ±60.5 kHz around −140.945 MHz)
    −161.7595 MHz    −161.6385 MHz (assuming ±60.5 kHz around −161.699 MHz)
    SRX
    Minimum    Maximum
    −160.384 MHz    −160.244 MHz (assuming ±70 kHz around −160.314 MHz)
    −140.65 MHz    −140.51 MHz (assuming ±70 kHz around −140.58 MHz)
    162.316 MHz    162.456 MHz (assuming ±70 kHz around 162.386 MHz)
    140.33 MHz    140.47 MHz (assuming ±70 kHz around 140.400 MHz)

    During the measurements, the sub-laser temperature was changed significantly when switching the beat frequency from +160 MHz to −160 MHz. Under these conditions, the beat frequency observed at OMC REFL fluctuated much more frequently, suggesting that the fluctuations become significant until the sub-laser temperature stabilizes. In addition, after switching from +140 MHz to −140 MHz during the SRY measurement, the frequency fluctuations did not subside. However, when the MCE feedback was enabled during the subsequent SRX measurement, the fluctuations were noticeably reduced. This suggests that fluctuations of the main laser also contribute to the beat-frequency instability.
     

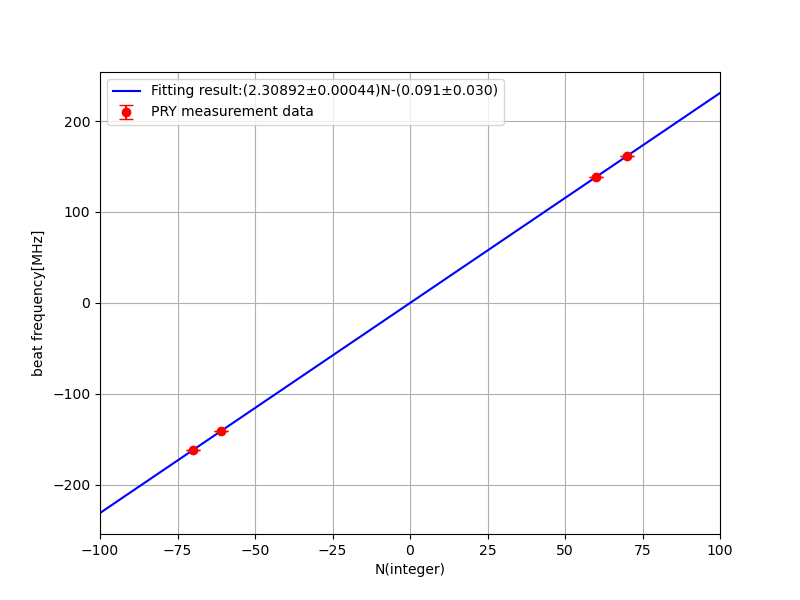
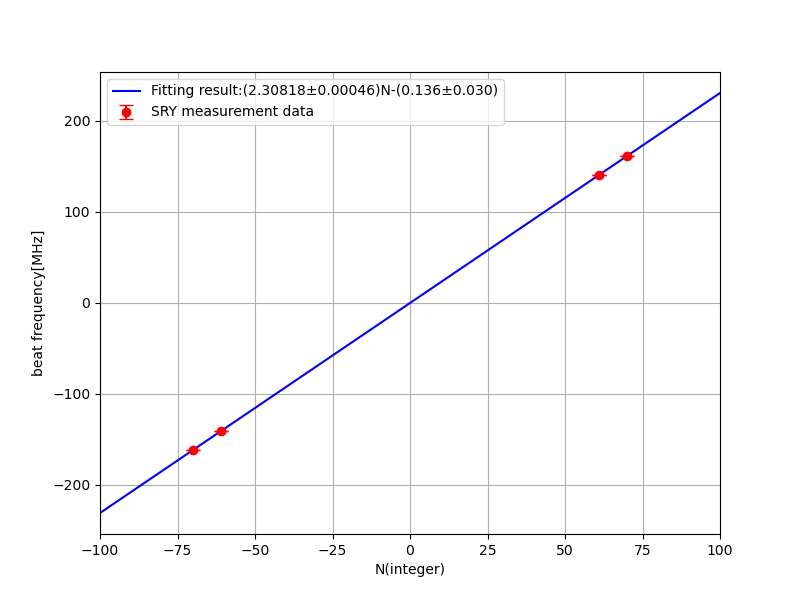
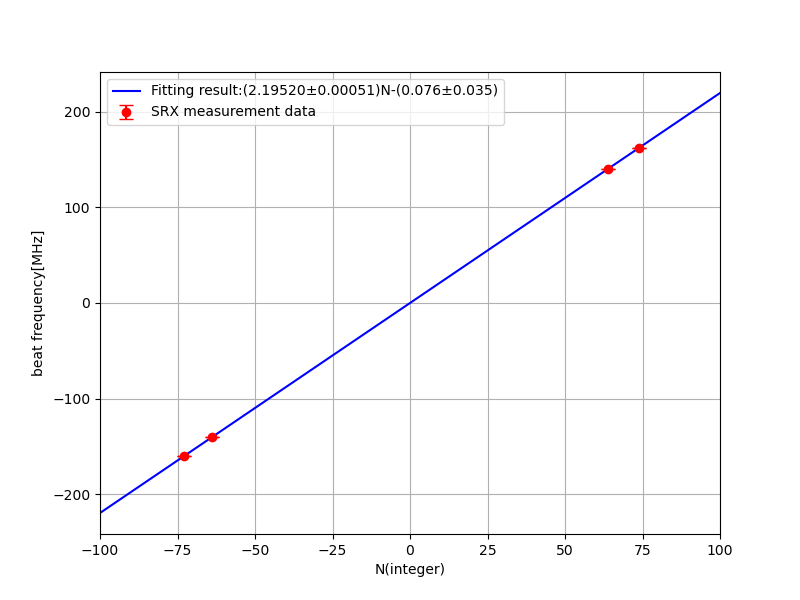
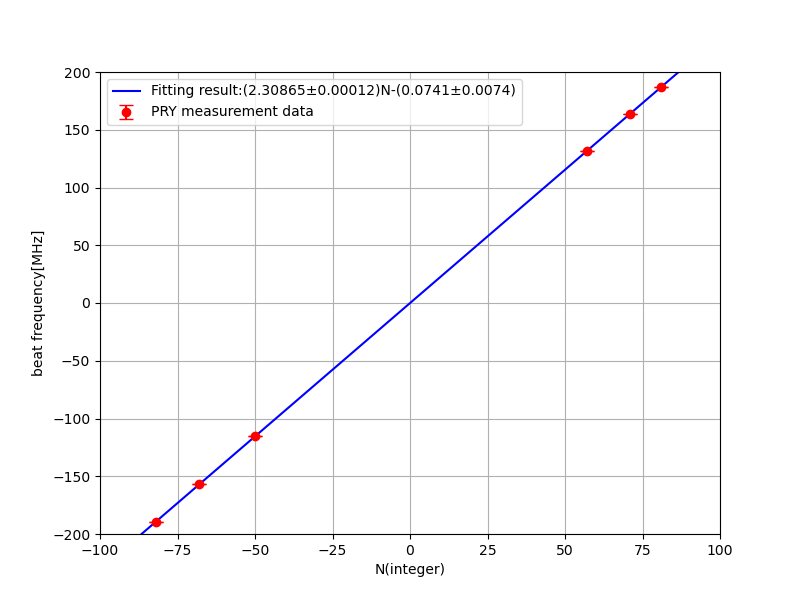
  • For each cavity, the midpoint between the measured minimum and maximum frequencies was calculated and divided by the corresponding FSR calculated from the design lengths of 64.9265 m (PRY), 64.9264 m (SRY), and 68.2562 m (SRX). The resulting values were rounded to the nearest integers, and the measured frequencies were fitted with the linear function AN+B, where A and B are fitting parameters and N is the corresponding integer. The fitting results are as follows.

    PRY (Fig. 1)
    A = 2.30892 ± 0.00044 MHz
    B = −0.091 ± 0.030 MHz
    SRY (Fig. 2)
    A = 2.30818 ± 0.00046 MHz
    B = −0.136 ± 0.030 MHz
    SRX (Fig. 3)
    A = 2.19520 ± 0.00051 MHz
    B = −0.076 ± 0.035 MHz

    Since A corresponds to the FSR, the cavity lengths obtained from the fitted FSR values are

    PRY
    Fitted length: 64.921 ± 0.012 m
    Design length: 64.9265 m
    Difference (Fitted − Design): −0.6 ± 1.2 cm
    SRY
    Fitted length: 64.941 ± 0.013 m
    Design length: 64.9264 m
    Difference (Fitted − Design): 1.5 ± 1.3 cm
    SRX
    Fitted length: 68.284 ± 0.016 m
    Design length: 68.2562 m
    Difference (Fitted − Design): 2.8 ± 1.6 cm

    Therefore, the measured PRY length is consistent with the design value within the measurement uncertainty of 1.2 cm. In contrast, the differences between the measured and design values for SRY and SRX exceed their respective uncertainties, suggesting that their actual cavity lengths may differ from the design values.

Images attached to this comment
Search Help
×

Warning

×