Reports 1-1 of 1 Clear search Modify search
MIF (General)
yuta.michimura - 22:24 Sunday 23 November 2025 (35639) Print this report
First noise spectra of TMS IR PDs to 500 kHz

[Takidera, Michimura]

We have measured the high frequency spectra of TMS polarization PDs.
TMSX polarization PD outputs seems to be somehow noisier now by a factor of ~3 than before (April and July).

What we did:
 - Took the 10 sec data of the following channels from 1435454718 (July 2 10:25:00 JST; during O4c) and from 1447918800 (Nov 23 16:39:42 JST; today).

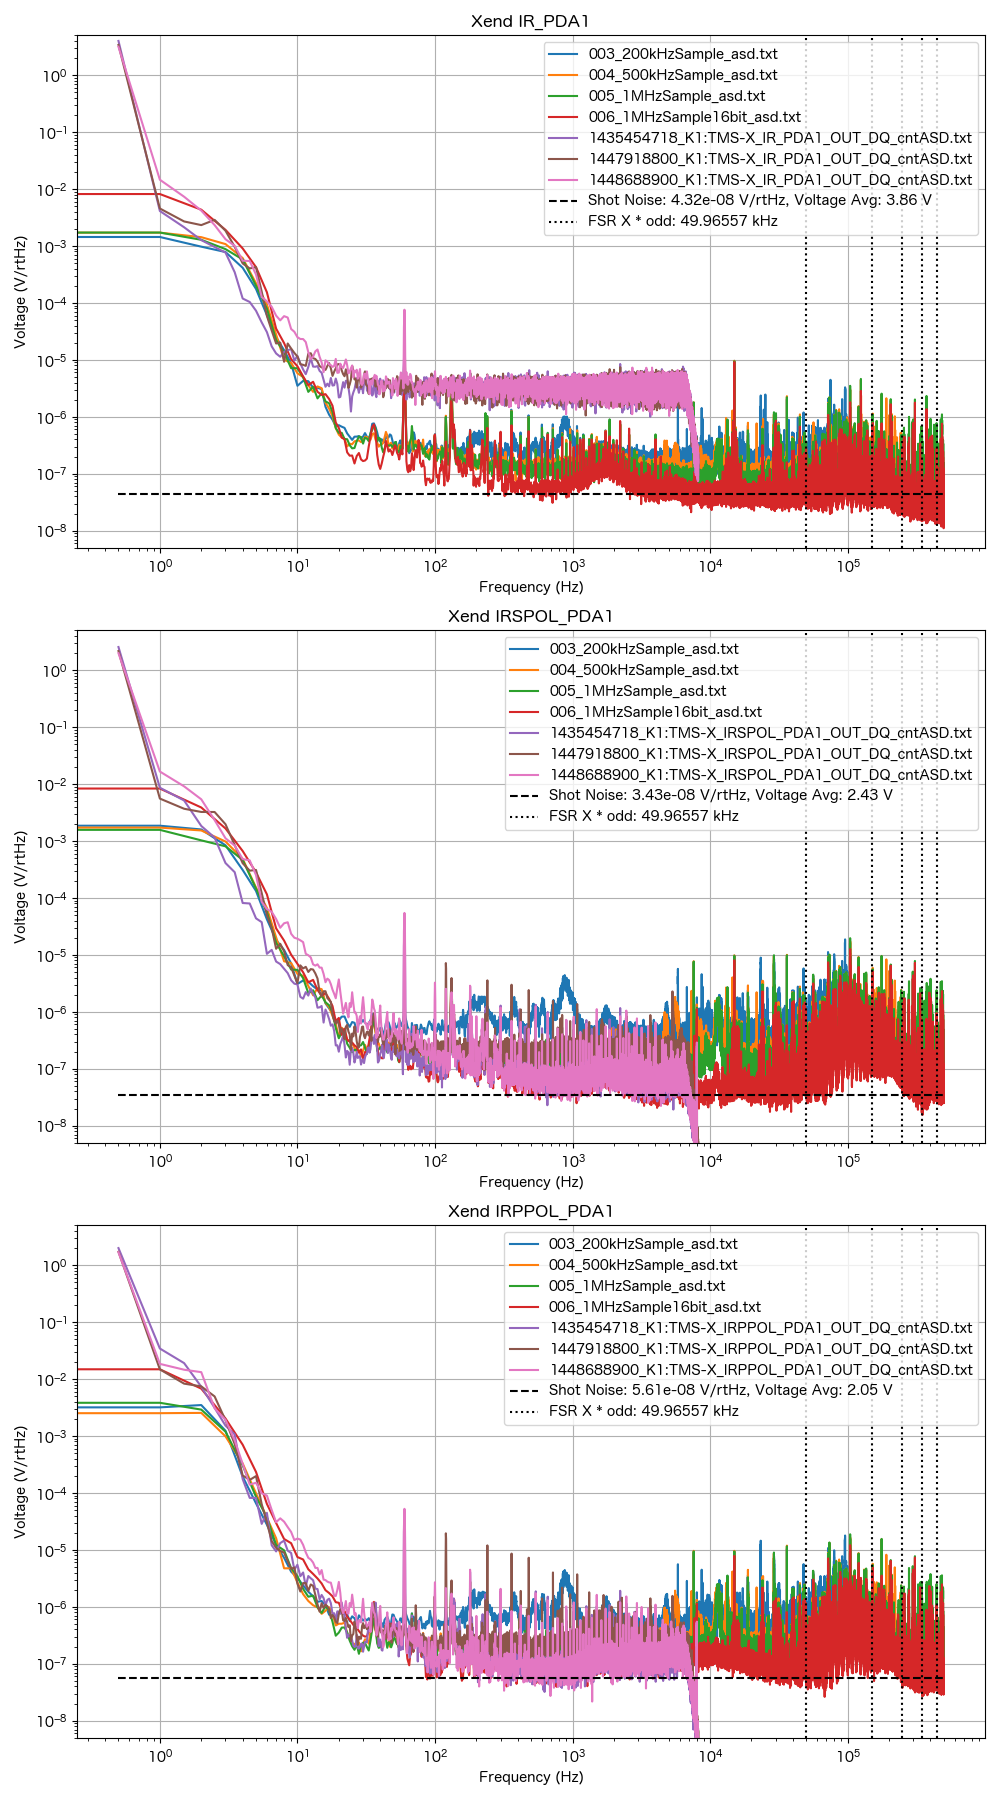
K1:TMS-(X|Y)_IR_PDA1_OUT_DQ
K1:TMS-(X|Y)_IRSPOL_PDA1_OUT_DQ
K1:TMS-(X|Y)_IRPPOL_PDA1_OUT_DQ

 - Calibrated them into volts at the output of PDs using the transimpedance settings described in klog #33283 and DAC conversion factor 40/2^16 V/counts.
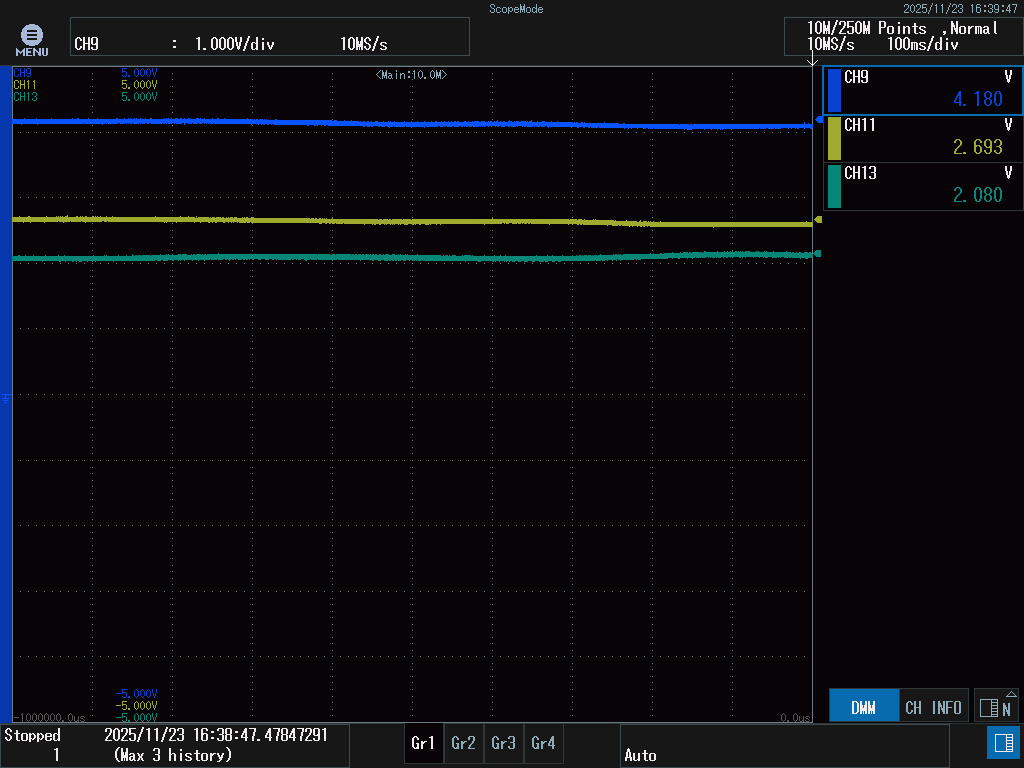
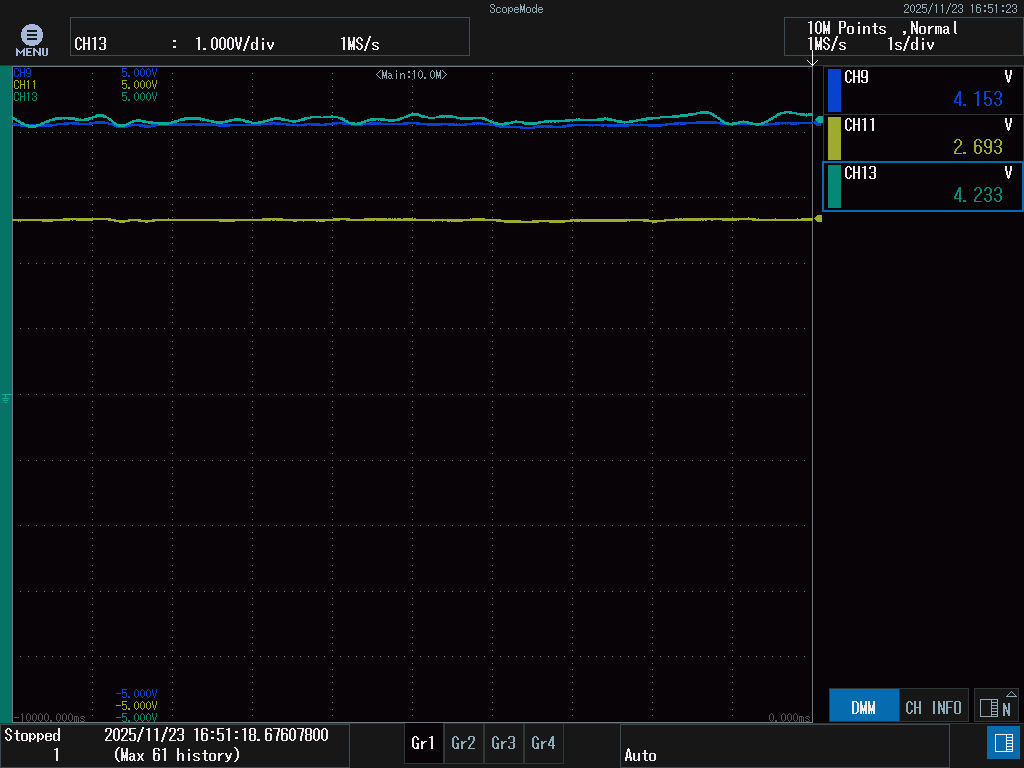
 - Took the DC voltage values from DL950 (Attachment #1 and Attachment #2) during the lock stretch containing 1447918800. See below for the summary. This result confirms the relative calibration between the CDS and DL950 within ~4%.

         1435454718    1447918800    DL950
X IR      4.88 V        4.16 V        4.18 V
X SPOL    3.12 V        2.66 V        2.69 V
X PPOL    2.44 V        2.10 V        2.08 V
Y IR      4.51 V        4.11 V        4.15 V
Y SPOL    2.87 V        2.65 V        2.69 V
Y PPOL    4.57 V        4.08 V        4.23 V

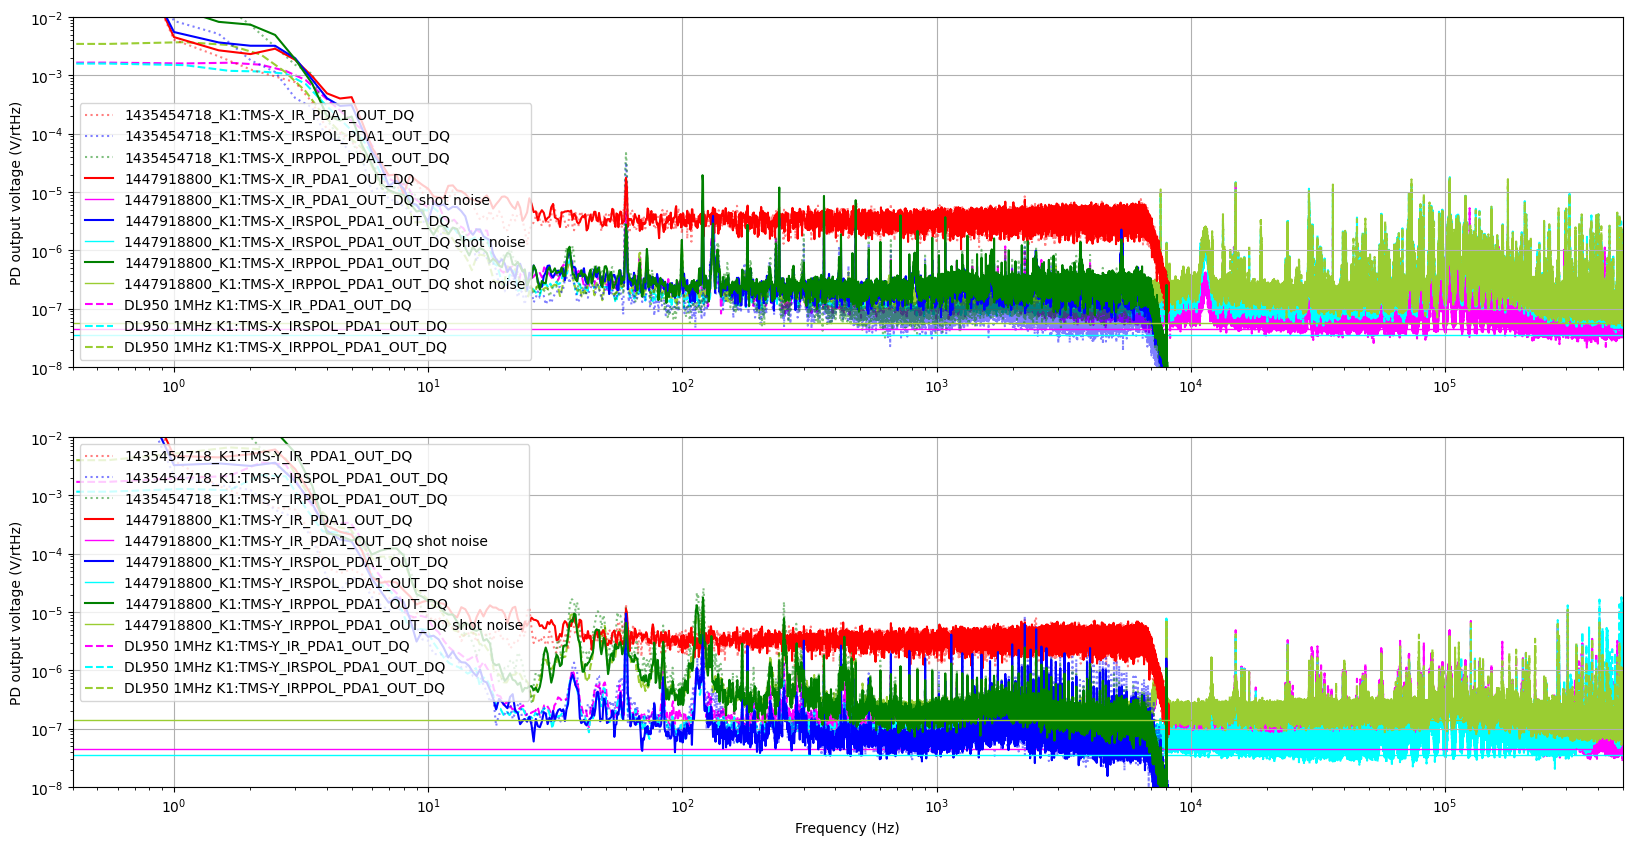
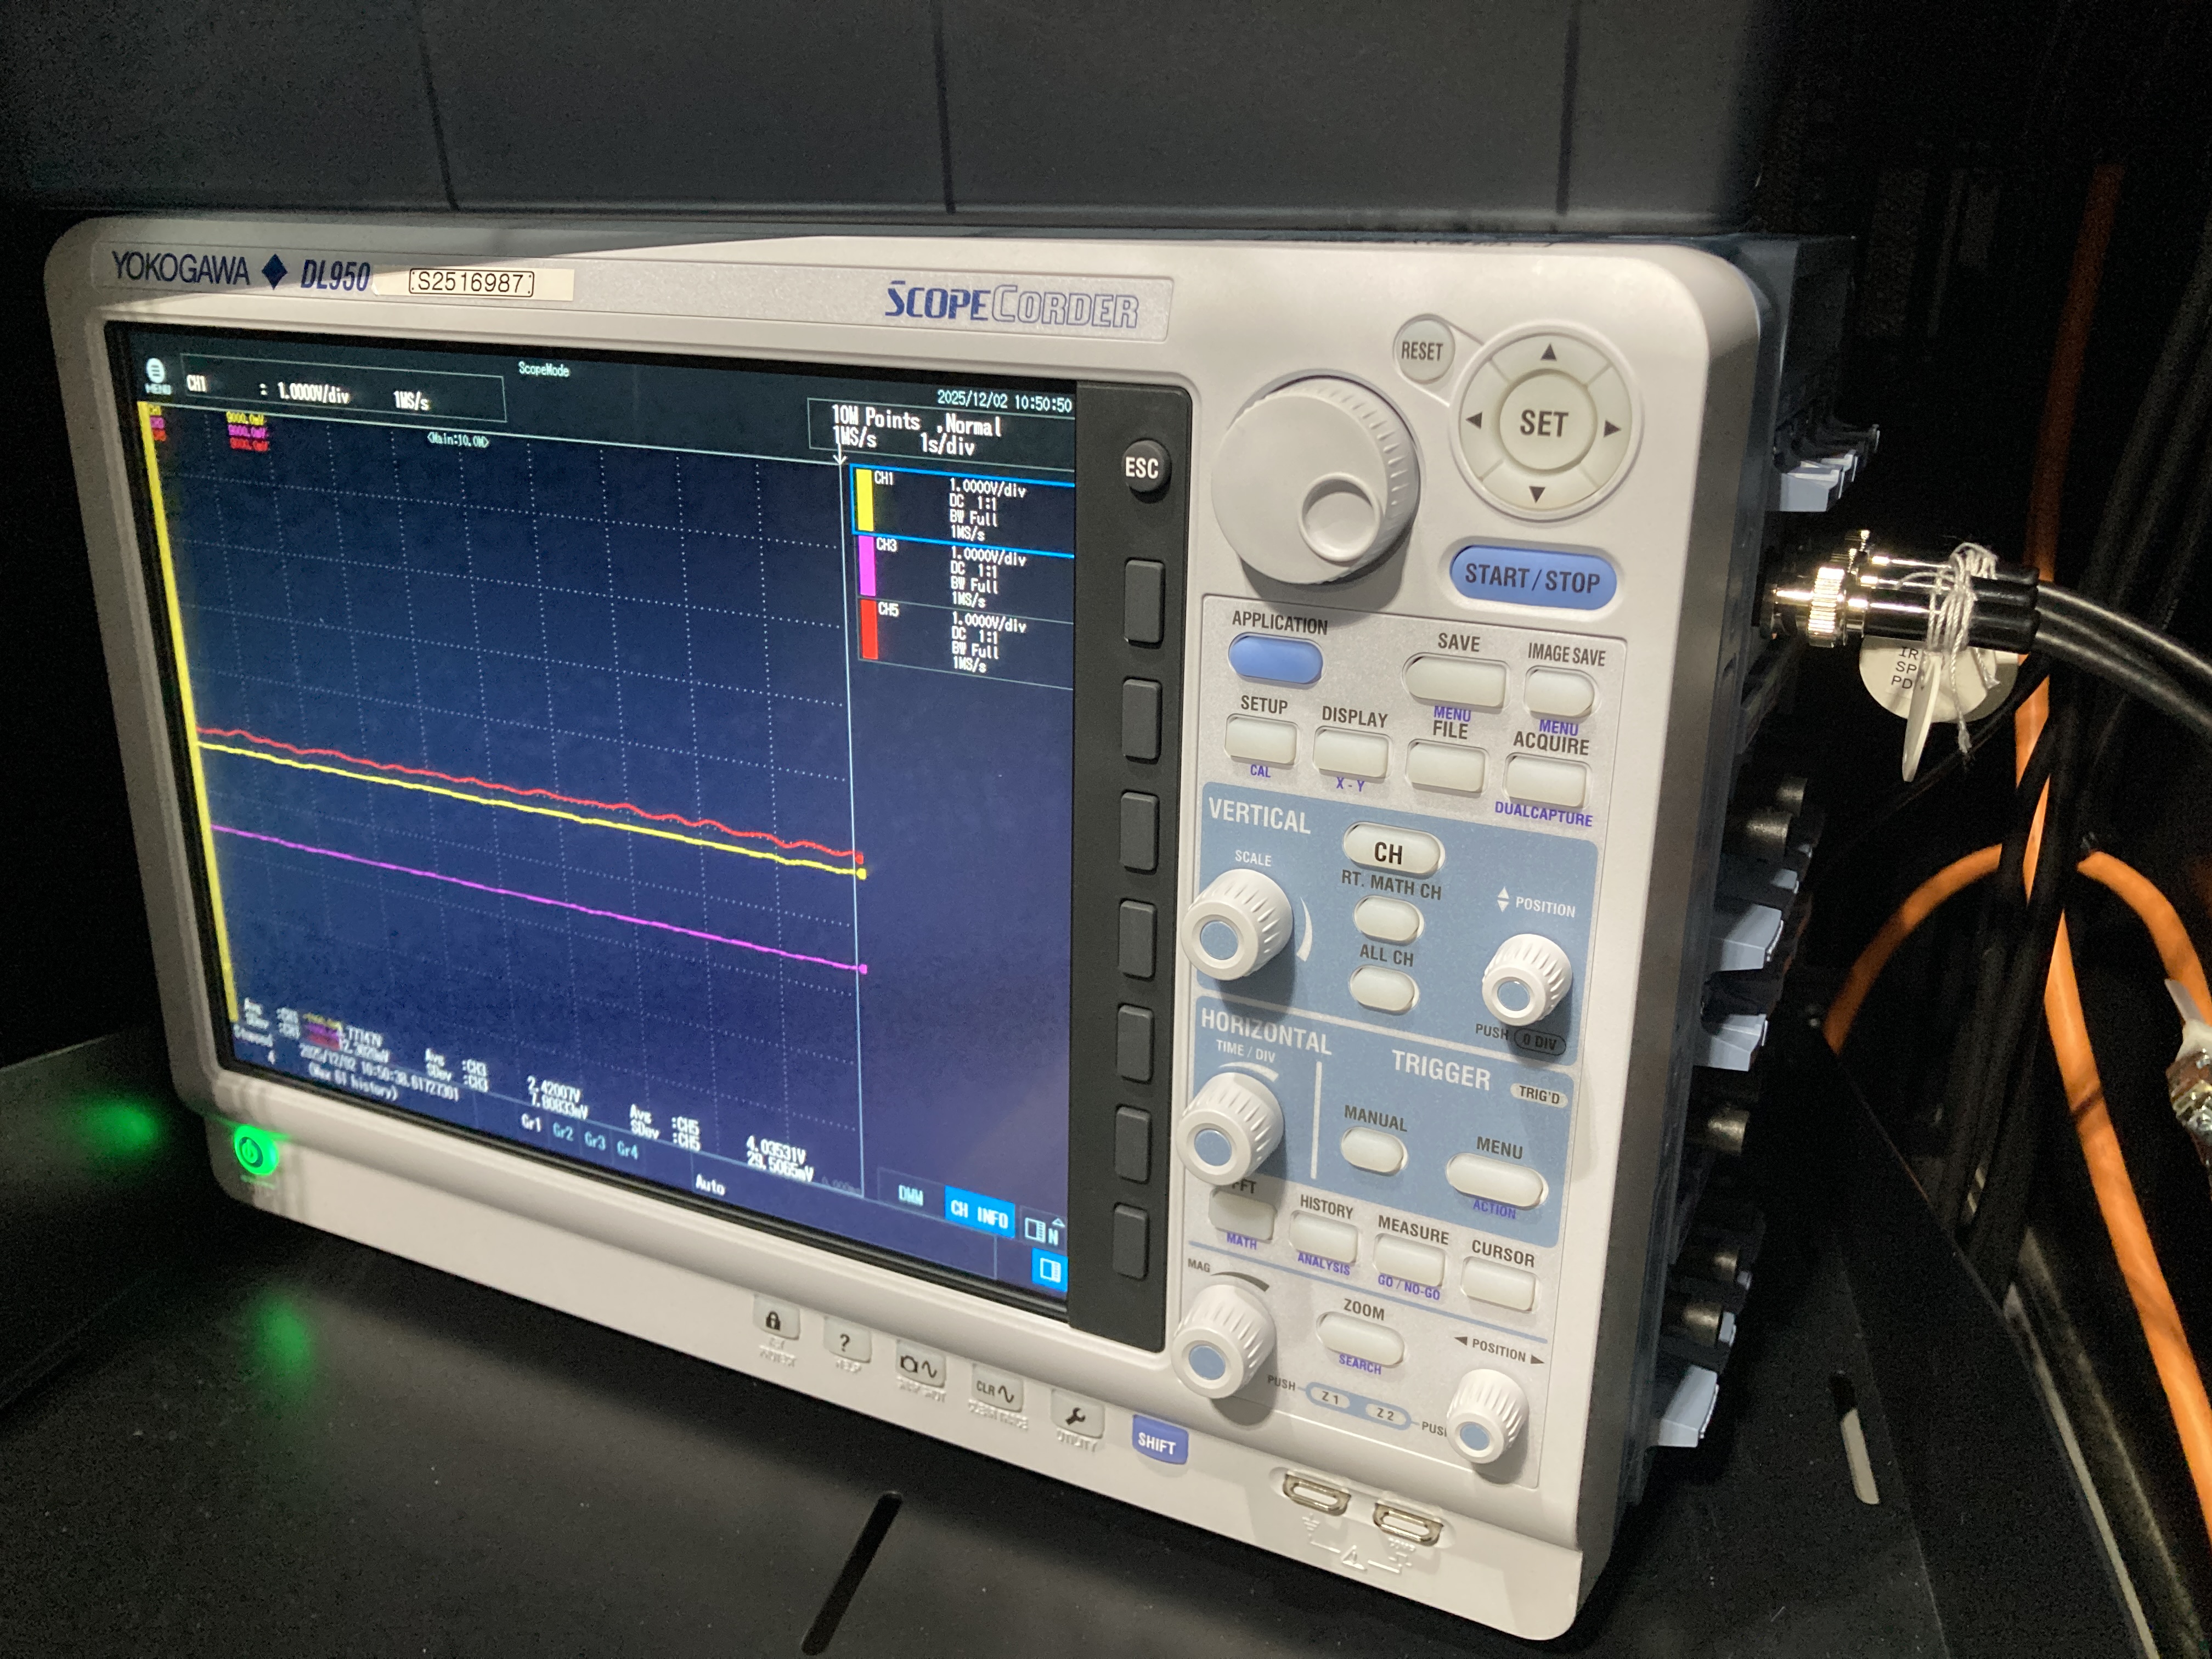
 - Took the data using DL950 with module 720250 (10 MHz, 12 bit) during the lock stretch containing GPS time 1447918800 for 10 sec with 5 mV/div, AC coupling, 1:1 probe, 500 kHz bandwidth settings. Compared the spectra with 200 kHz sampling, 500 kHz sampling and 1 MHz sampling. See Attachment #3. It seems like 1 MHz sampling is necessary for reducing noise from DL950.

 - Compared the spectra from the CDS calibrated into volts and DL950 1 MHz sampling. See Attachment #4. TMSX polarization PD outputs seem to be somehow noisier now by a factor of ~3 than the spectra from July and from April (see klog #33283), while those for Y seem to be comparable to before. X is noisier. The shot noise (calculated using the following equation) is pretty close to the measured value with in ~3 above ~3 kHz.

V_shot = sqrt(2*e*V_DC*TransImpedance)

Discussion:
 - Assuming that the calibration factors into polarization modulation angle are not too far from klog #33283, noise level in kHz to 500 kHz region is roughly 10^{-8} rad/rtHz.

Next:
 - Try to use module 701251 (1 MHz, 16 bit) instead to further reduce DL950 noise (the modules are already there).
 - Calibrate them into polarization modulation angle. We might need to scale the calibration factor using TRX/Y values to compensate for the power and finesse drift.

Images attached to this report
Comments to this report:
yuta.michimura - 21:07 Tuesday 02 December 2025 (35738) Print this report

[Fujimoto, Sugimoto, Kawaguchi, Michimura]

Instead of using the module 720250 (10 MHz, 12 bit), we switched to use the module 701251 (1 MHz, 16 bit) of DL950 for taking high frequency polarization data, for both Xend and Yend.
Now the data taking is done with 5 mV/div, AC coupling, 1:1 probe, Full bandwidth settings ("Full" bandwidth is actually upto 300 kHz; see manual).
Channel assignments are as follows
Ch1: IR
Ch3: IRSPOL
Ch5: IRPPOL

Images attached to this comment
kenzaburo.kawaguchi - 15:05 Wednesday 03 December 2025 (35752) Print this report

[Fujimoto, Sugimoto, Michimura, Kawaguchi]

We plotted the ASD of the Xend and Yend TMS transmitted light using both High Frequency (HF) sampling data (200 kHz - 1 MHz) from DL950 and standard DAQ data. We compared HF measurements in 12-bit resolution (taken on November 23, 2025; klog #35639) with 16-bit resolution measurements. The analysis indicates that the 16-bit resolution provides a slightly better noise floor, confirming the shot noise limitation.

Analysis Methods
Channels: IR_PDA1 (Total), IRSPOL (S-pol), and IRPPOL (P-pol).
Voltage Conversion (for DAQ data): Counts were converted to voltage using the factor 40/2^16 [V/count] divided by the Filter Gain (accounting for the gain of filters inserted in the signal path).
Shot Noise Calculation: Calculated using V_{shot} = \sqrt{2 e V_{avg} R}, where V_{avg} is the mean voltage calibrated from the DAQ data measured in GPS time 1448688900 and R is the resistance derived from the PD Gain settings (0/10/20 dB of PDA100A2).

Parameters and Results
The settings, measured DC voltage averages, and calculated shot noise levels for each channel are as follows. We have also compared the spectra with data taken with the standard DAQ from GPS times.

1. Xend

  • IR_PDA1
    • Filter Gain = 0.510091, PD Gain = 0 dB
    • DC Avg: 3.86 V
    • Shot Noise: 4.32e-8 V/rtHz
  • IRSPOL
    • Filter Gain = 1, PD Gain = 0 dB
    • DC Avg: 2.43 V
    • Shot Noise: 3.43e-8 V/rtHz
  • IRPPOL
    • Filter Gain = 1, PD Gain = 10 dB
    • DC Avg: 2.05 V
    • Shot Noise: 5.61e-8 V/rtHz

2. Yend

  • IR_PDA1
    • Filter Gain = 2.39184, PD Gain = 0 dB
    • DC Avg: 3.91 V
    • Shot Noise: 4.35e-8 V/rtHz
  • IRSPOL
    • Filter Gain = 1.00, PD Gain = 0 dB
    • DC Avg: 2.53 V
    • Shot Noise: 3.50e-8 V/rtHz
  • IRPPOL
    • Filter Gain = 1.00, PD Gain = 20 dB
    • DC Avg: 3.80 V
    • Shot Noise: 1.36e-7 V/rtHz

Discussion
 - 16 bit measurements with DL950 gives the best noise floor, and is mostly shot noise limited above 10^4 Hz.
 - Unknown bump at around 10^5 Hz.
 - Excess noise at around 20 Hz in measurement from yesterday. But the excess noise at higher frequencies in Nov 23 measurements compared with July measurements, reported in klog #35639, is gone now. Temporal variations (from beam spot motions?)?
 - Spectra shapes seems similar between IR_PDA1, IRSPOL_PDA1 and IRPPOL_PDA1. We might be able to subtract common noises.
​​​​​​
Next plans
 - Calibrate into radians using the calibration factor reported in klog #35743
 - Subtract common noises.

Images attached to this comment
kenzaburo.kawaguchi - 21:32 Wednesday 03 December 2025 (35761) Print this report

[Fujimoto, Sugimoto, Michimura, Kawaguchi]

We converted the Xend and Yend data into physical Polarization Rotation (rad) using the calibration factors obtained from the polarization monitor calibration (klog #35743, #35758, #35760).
We evaluated the ASDs of standard DAQ data and High Frequency (HF) 16-bit sampling data and compared them with the shot noise limit.

Methods
 1. Calibration Factors 
We used the factors reported in klog #35743, #35758, #35760  to convert voltage (V) and counts (cnt) into radians (rad). The conversion factors for each channel are as follows:

  • Xend:
    • S-pol: 0.516 rad/V (3.19e-4 rad/cnt)
    • P-pol: 0.166 rad/V (1.01e-4 rad/cnt)
  • Yend:
    • S-pol: 0.687 rad/V (4.27e-4 rad/cnt)
    • P-pol: 0.0716 rad/V (4.38e-5 rad/cnt)

2. Shot Noise
Similar to the previous report, we calculated the theoretical shot noise level (V/rtHz) from the DC voltage values and converted it to rad/rtHz by multiplying it by the voltage calibration factors (rad/V) listed above.

Result 
The resulting spectra are attached.

Discussion 
For both Xend and Yend, the measured noise floor in the high-frequency band (>10 kHz) agrees well with the calculated shot noise levels (indicated by the dashed lines in the figures). This confirms that the sensitivity of the polarization monitors is limited by shot noise.

 
Images attached to this comment
Search Help
×

Warning

×