M.Yamamoto,Nakano,Tanaka
Date of measurement:Sep.7,2023
abstract and result
The night of September 6, 2023, when FPMI was locked, we tried to excite an elastic mode of ITMY remotely using DGS.
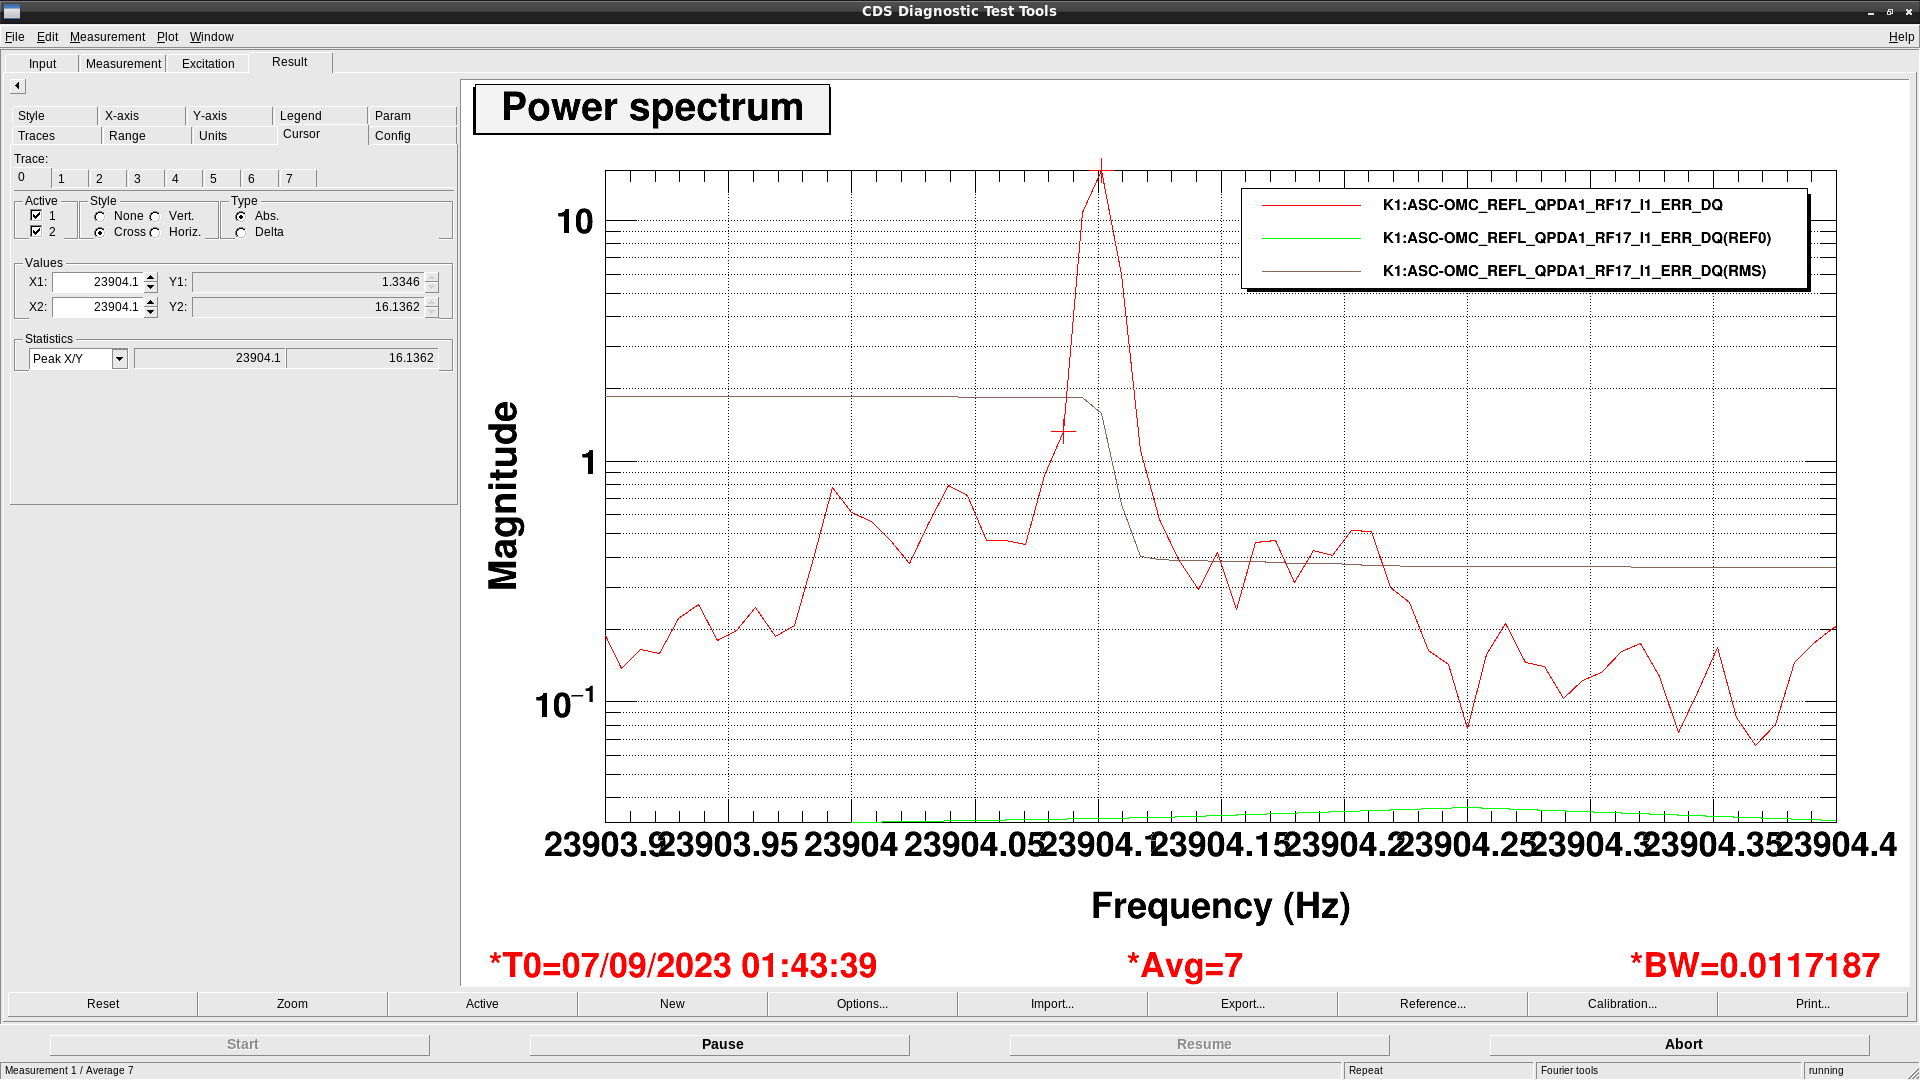
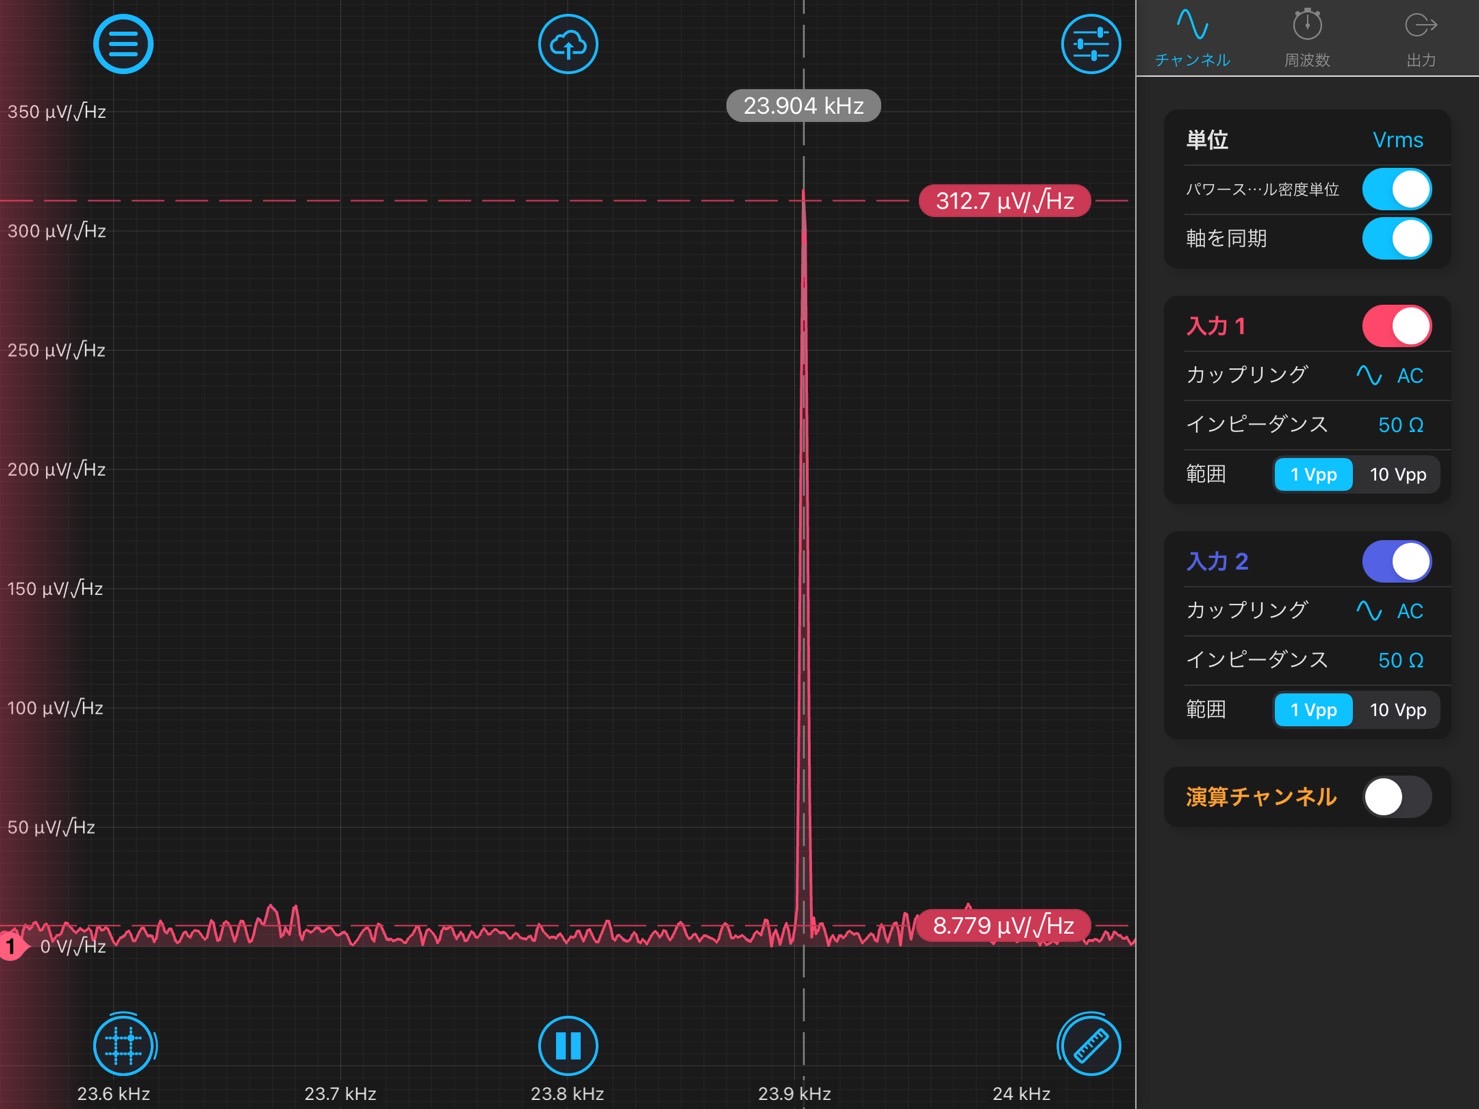
In this result, a peak of elastic mode was confirmed at 23.9041kHz.This resonant frequency is 1% higher than one at room temperature.
The reason why we could not detect resonance at the past try was because we did not have enough measurement range.
We observed the peak from IQ demodulator AS RPPDA1 RF17 in DGS and test ports in the Common path of CARM Common Mode Servo.
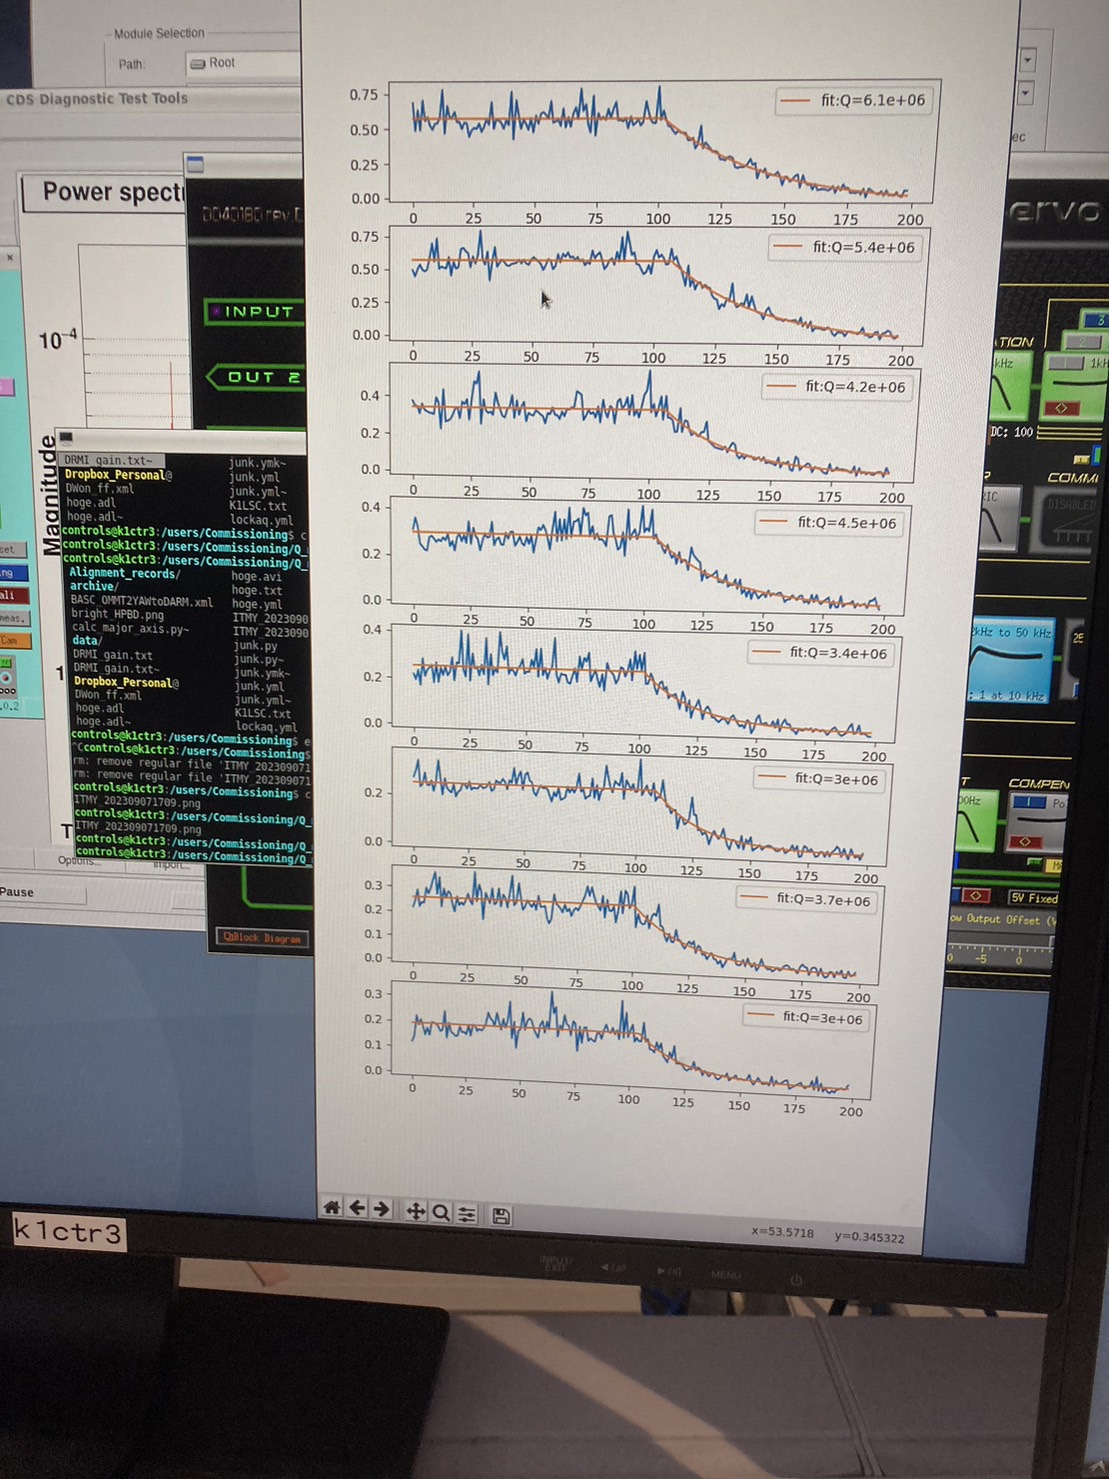
Nakano-san has already analyzed time series data obtained from IQ demodulator AS RPPDA1 RF17 in DGS. (attachement3)
According to the analysis, Q-value is higher than 10^6. This Q is roughly equal to Q logged with a lock-in amp.
what we did
・We search resonant frequency by injecting sweep sine signal from 64kHz model to the ITMY coil driver input port(https://klog.icrr.u-tokyo.ac.jp/osl/?r=26665).
set time: from 23.75kHz to 23.81kHz in 7h30m. but maybe the scan time was too long.
・We did spektrum analysys using DGS data(ASC-OMC-REFL _QPDA1_RF17_l1_ERR_DQ),and detected the peak.
・We measured decay time from SR560 50Ω output connected with the test port I demodulator AS RPPDA1 RF17 and logged it 10 times.
memo: We still changed the Coil Test Enable setting on ITMY Coil drive from 0.0 to 1.0.
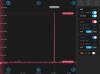
attachement1:peak of resonance measured from IQ demodulator AS RPPDA1 RF17 in the OMC1 rack
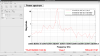
attachement2:peak of resonance measured from test ports in the Common path of CARM Common Mode Servo
attachement3:data analyzed with Digital system (data resource: ASC-OMC-REFL _QPDA1_RF17_l1_ERR_DQ)