CAL (Pcal general)dan.chen - 5:26 Saturday 25 January 2025 (32461)
Print this reportDigital multimator output check with a calibrated voltage reference
We checked outputs of the digital multimeter (ADCMT 7352A) we use for the WSK calibration at Toyama University.
A calibrated reference voltage generator (HIOKI SS7012) was used for this measurement.
Measurements for 0.1 V, 1.0 V, and 1.5 V showed no significant voltage drop.
VIS (General)takafumi.ushiba - 23:10 Friday 24 January 2025 (32460)
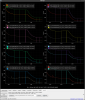
Print this reportNBDAMP filters for 1.2Hz yaw and 1.7 Hz longitudinal resonances
[Tanaka, Ushiba]
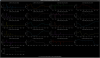
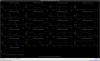
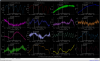
We designed 1.2Hz yaw resonance damping at NBDAMP_Y3 fiters of each Type-A suspensions. This filter feedback the TMY signals to BFY actuators.
Also, we designed 1.7 Hz longitudinal resonance damping filters at NBDAMP_L5 filters, except for ETMX. This filter feedback the TML signals to BFL actuators.
Both loops seems fine, so these filters are implemented into the guardians, except for ETMX, and engaged between ALIGNED state and LOCK_ACQUISITION state.
Note:
For ETMX, it might be necessary to watchdogs for LSC because ETMX is largely kicked when lockloss happens currently, which might be kick the BFY and trip the suspension. After confirming damping loops are fine when lockloss happens, 1.2Hz yaw damping control should be also implemented to ETMX.
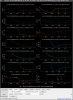
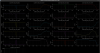
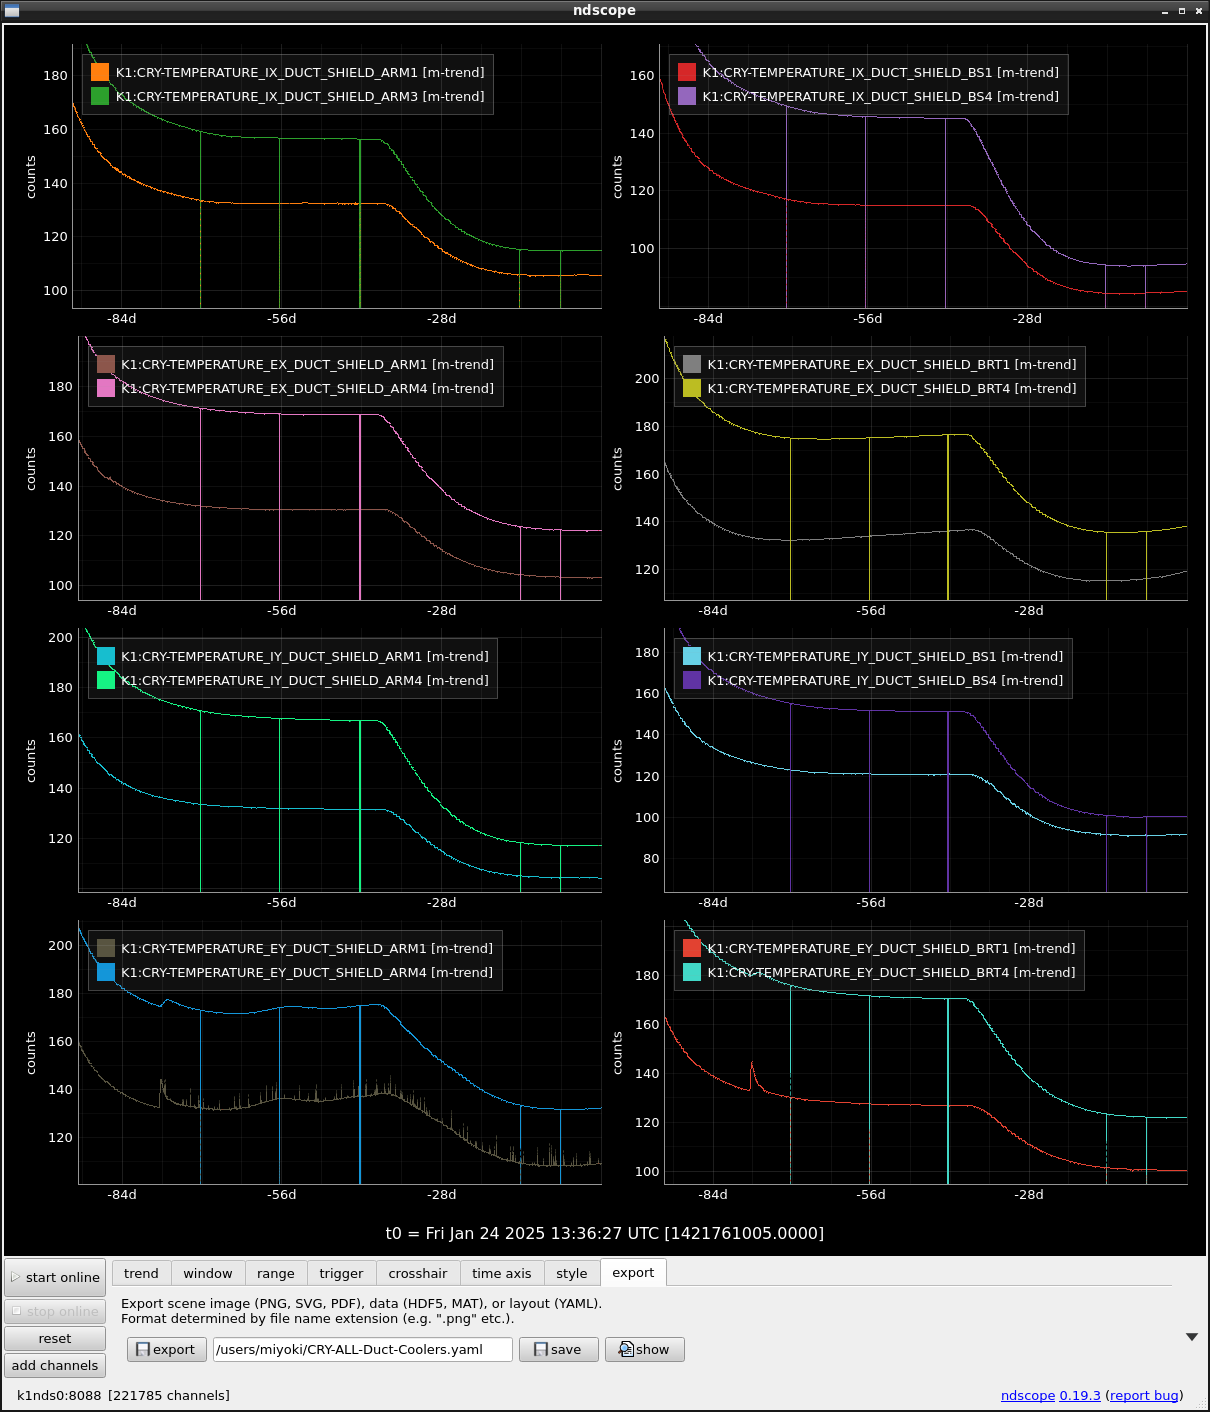
I added the cryocoolers for all duct shields. A slight concern is an increase of temperature at the EX-BRT side.
Images attached to this comment
MIF (General)takahiro.yamamoto - 16:45 Friday 24 January 2025 (32458)
Print this reportComment to Helper guardian for lockloss check (31045)
If it's only referring the Excitation check guardian, it's easy and it might be a good practice to touch guardian. Note that the reason why lockloss check code is prepared as guardian is all on-site people can improve it by themselves (If I'm only people to edit it, I want to refactor it as a non-guardian code for flexibility).
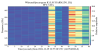
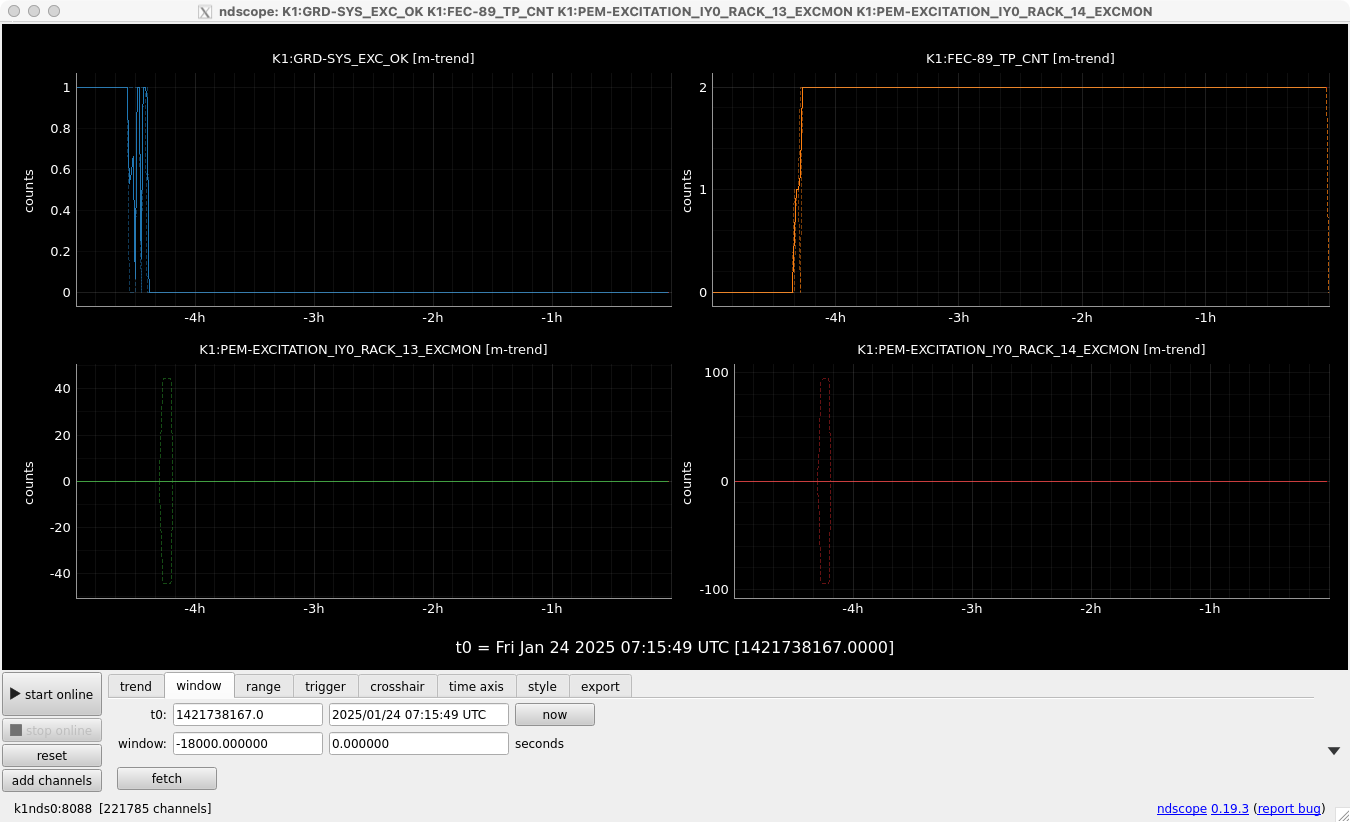
What we must seriously consider is that excitation channels are often left with un-closed even if an actual excitation is finished. Unfortunately it seemed happen today as shown in Fig.1. Though some excitations from suspensions seemed to be presence in this 4hrs., it's hard to separate actual excitation from wrong flagged data due to un-closed excitations. It's a matter of a manner of user codes and activities, some people had already reported many times (so it's no longer possible for us to improve it?).
From the view point of observation, we can just eliminate the all suspicious data. It becomes just a reduction of the duty factor by our fault. On the other hand, it had better to avoid a false labeling for lockloss study because workers become not to check them. For this sense, labeling with a low reliable way is worse than non-labeling. Automatic labeling is for reducing our work, not for hiding check items it's really needed. We should decide to adding EXC flag now with consideration whether the most people prefer to increase labelled events even if reliability is low or to label only reliable events.
Images attached to this comment
PEM (Center)takaaki.yokozawa - 14:27 Friday 24 January 2025 (32457)
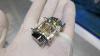
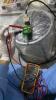
Print this reportTest of the speakers with new amplifier[YokozaWashimi]
I tried to check the KAGRA speaker with new amplifier system (KM750) From DAC to amplifier, the XLR connector was used. Sound injection from KAGRA DAC worked well, but the noisy sound was still there, so we need to investigate more about the GND treatment.
Images attached to this report
DetChar (General)shoichi.oshino - 14:15 Friday 24 January 2025 (32456)
Print this reportComment to Modified the configuration files of DET tools (32417)PF OpLevs were centered and started to be used to control Type-A suspensions, so this channel was added to the DET tools configuration file.
FCL (Air)shoichi.oshino - 13:37 Friday 24 January 2025 (32455)
Print this reportComment to memo for the SR2 Daikin Cooler Performance (32184)Since the test program seemed to work well, I applied this program to all ondotori data. The procedure is to change the symbolic link of the program and restart the corresponding process in the supervisor.
IOO (OMC)tatsuki.washimi - 12:57 Friday 24 January 2025 (32453)
Print this reportComment to Upgrade of the OMC DCPD driver (32419)
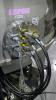
Today I changed the 5-9 Conversion cable from the soft one to a solid one made by AEL.
Before installing the new one, I measured the voltages for each pin from the 9th pin:
pin
Design
Measured
8
-15 V
-15.03V
3
+15 V
+14.96V
4
+9 V
+8.83V
5
0 V (ZSW off) +5 V (ZSW on)
0 V (ZSW off) +4.953 V (ZSW on)
After this test, I changed the Conversion cable to the new one.
Images attached to this comment
DGS (General)satoru.ikeda - 12:51 Friday 24 January 2025 (32454)
Print this reportUpdate model files
Request from Ushiba-san [K1IX1,K1IY1,K1EX1,K1EY1] model: k1vis{etmx,etmy,itmx,itmy}{nb,t} Input PF_OPLEV_{L,P,Y} to NBDAMP Output BF_NBDAMP_{L,T,V,R,P,Y} from NBDAMP and send to Tower Received by TowerModel and added by BF
VIS (PR3)tatsuki.washimi - 12:44 Friday 24 January 2025 (32452)
Print this reportComment to PR3 glitches due to sudden jump of IM H3 OSEM signals (32415)
[Washimi, R.Takahashi(remote)]
We checked the PR3 IM H3 OSEM.
Resistance and forward voltage were measured by the digital multimeter “Sanwa CD772”. Inductance was measured by the LCR meter “Lutron LCR-9183” at 1kHz.
IOO (OMC)takafumi.ushiba - 12:03 Friday 24 January 2025 (32451)
Print this reportComment to Upgrade of the OMC DCPD driver (32419)
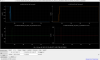
After changing the weak cable to the rigid connector, I measured OMC PD dark noise. Basically noise levels are smae as before but some peaks are larger. Also, I found that some breathing of the spectra between 40Hz and 120Hz when I measured the spectra several times.
Images attached to this comment
LAS (bKAGRA laser)osamu.miyakawa - 12:01 Friday 24 January 2025 (32450)
Print this reportComment to The caution message on chiller for laser (32375)
I checked the status of the water/air filters. The water filter was OK, but the air filter had some dust. I cleaned the surface of the air filter. The "FLtrS" message just counts the running time of filters and I reset the running time to zero. However, it was not possible to disable this "FLtrS" message even though I followed the manual. Probably it requires shutdown once or resetting all the setup. I just leave it this time.
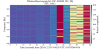
MIF (General)shinji.miyoki - 10:59 Friday 24 January 2025 (32449)
Print this reportComment to PRFPMI cannot be locked probably due to the GRY instbility (32384)
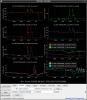
The temp in the PSL room in the last 6 days is listed in Fig.1
The temp seems to decrease by 0.01C without any intentional changes, and no PLL troubles are reported. We will keep monitoring. If the lower temp is favor, I will decrease the temp in the PSL room.
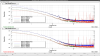
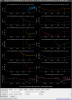
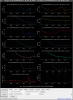
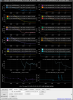
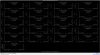
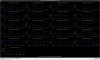
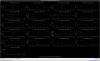
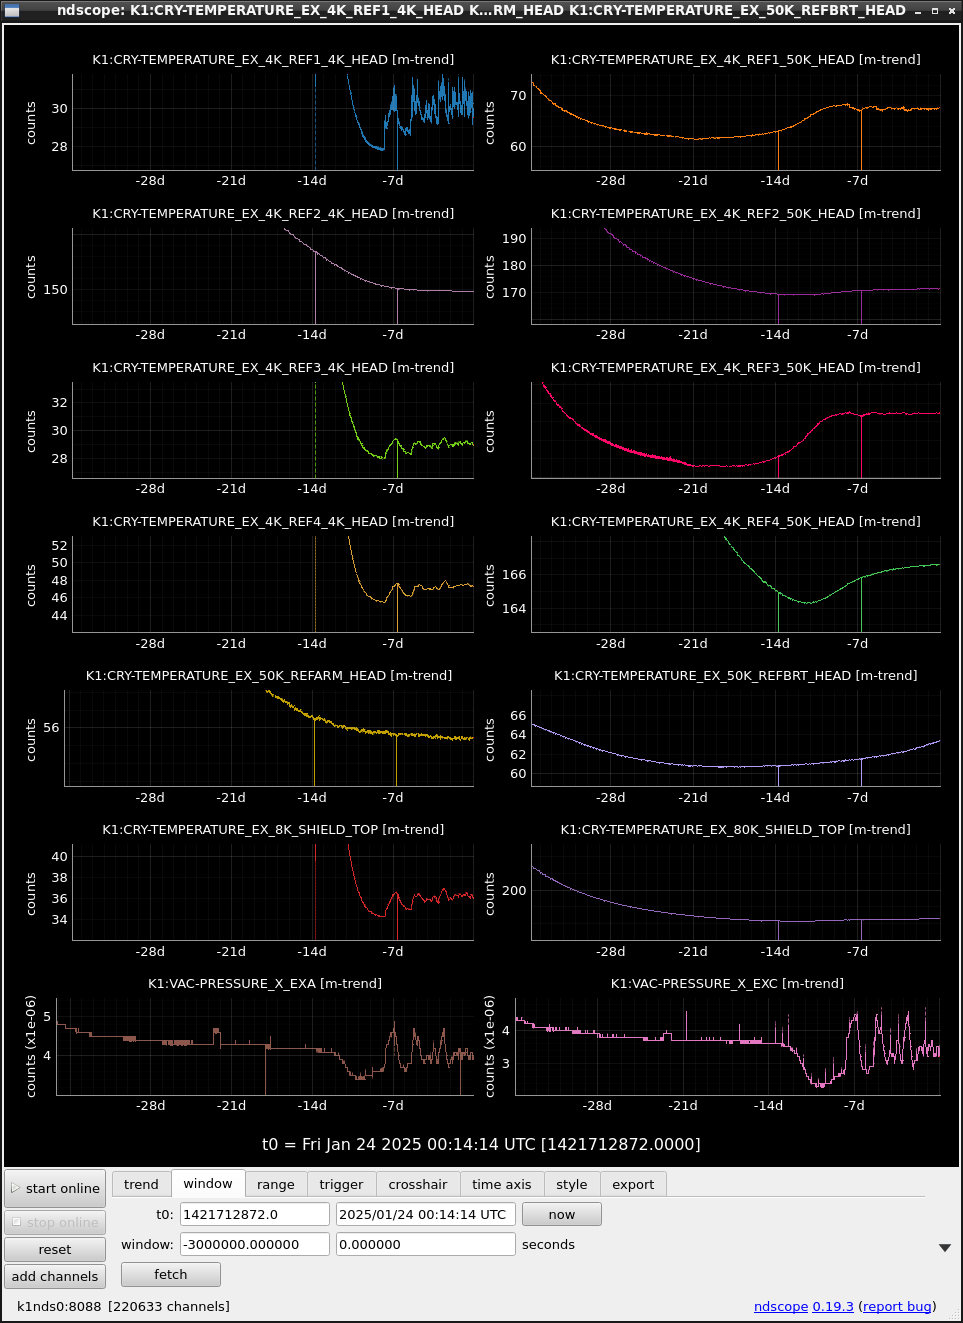
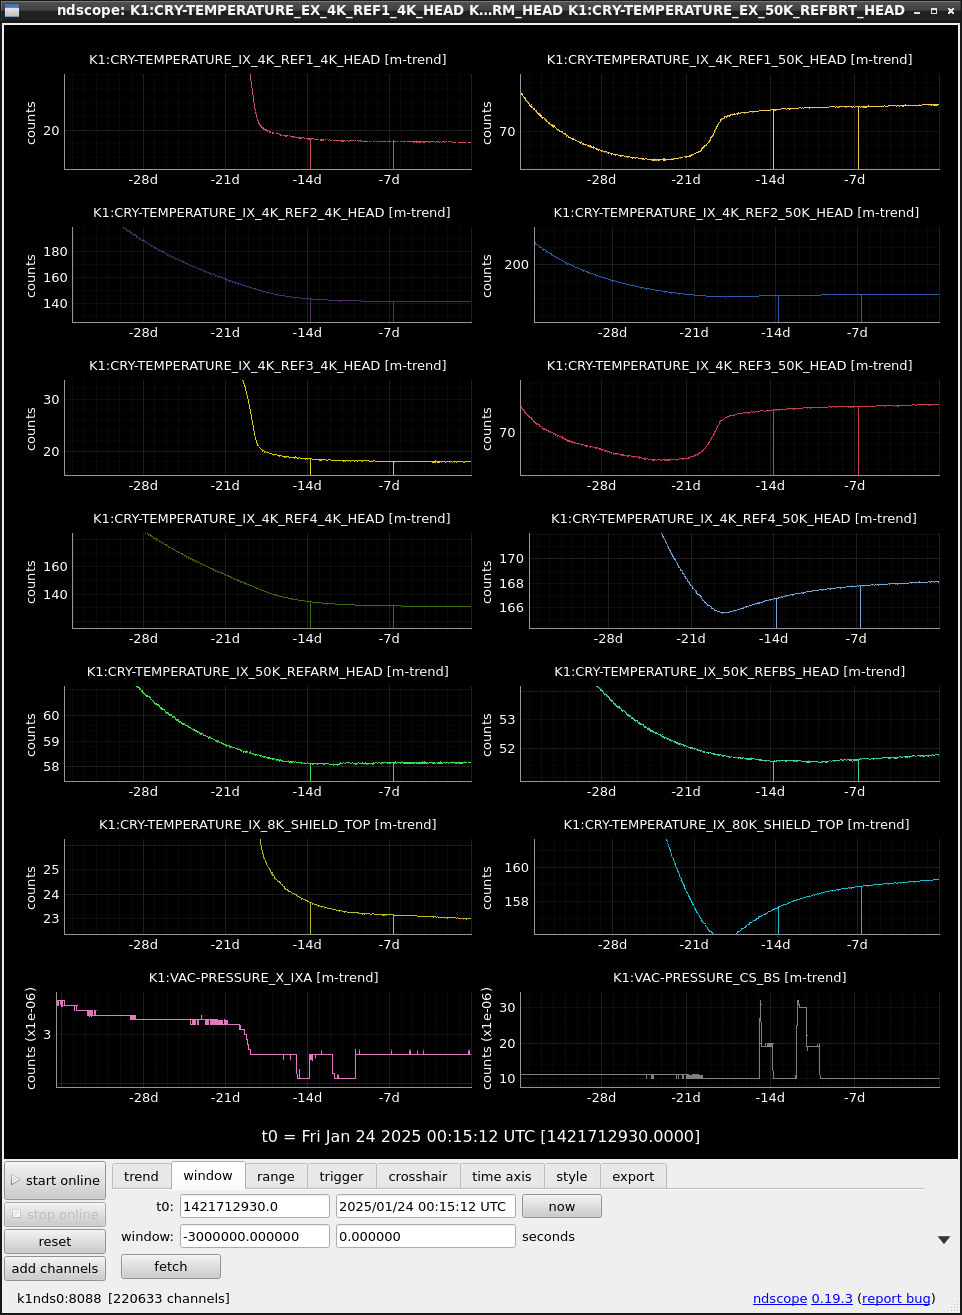
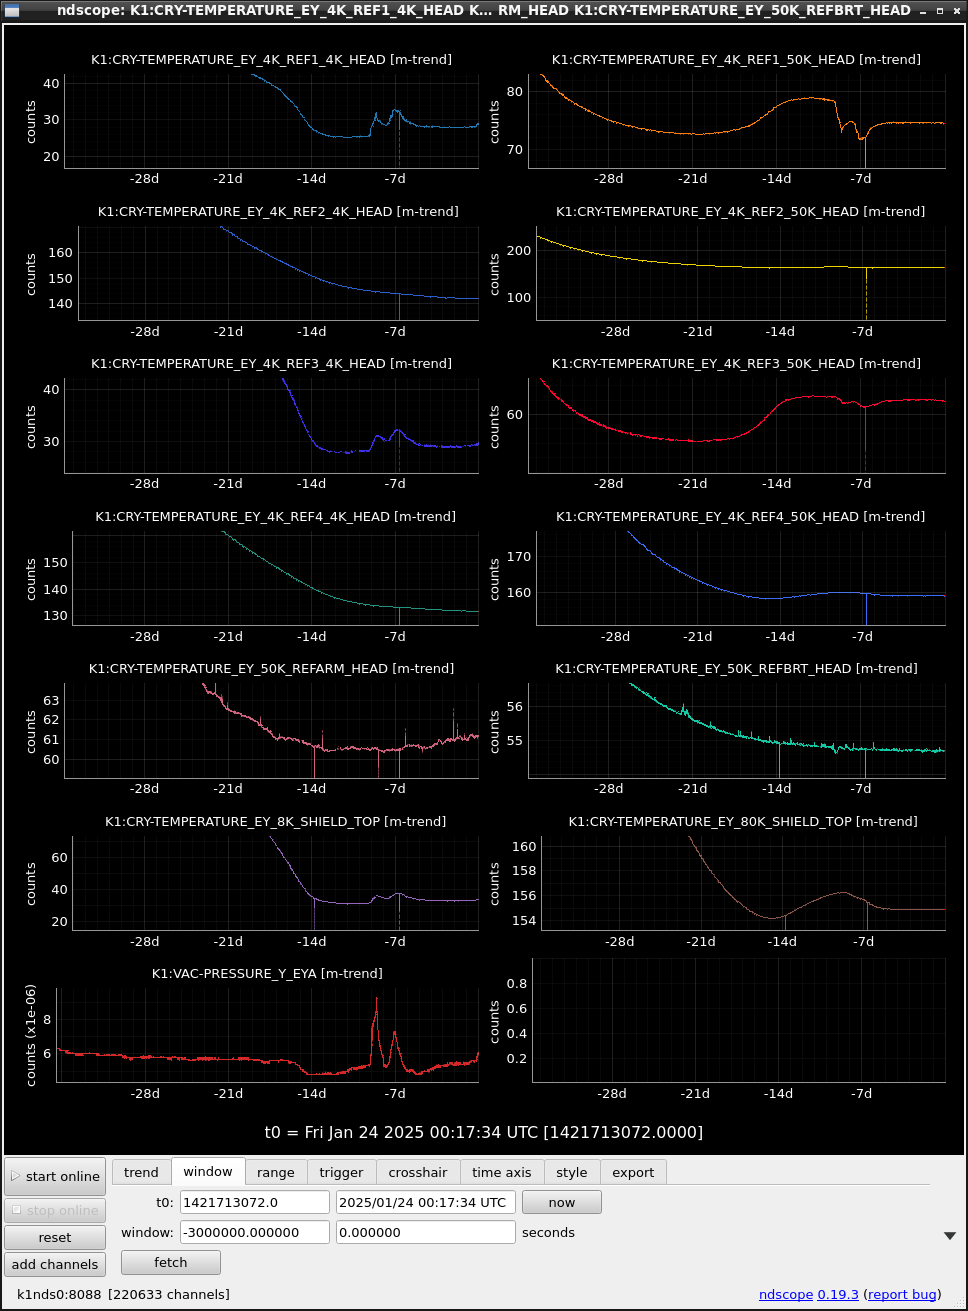
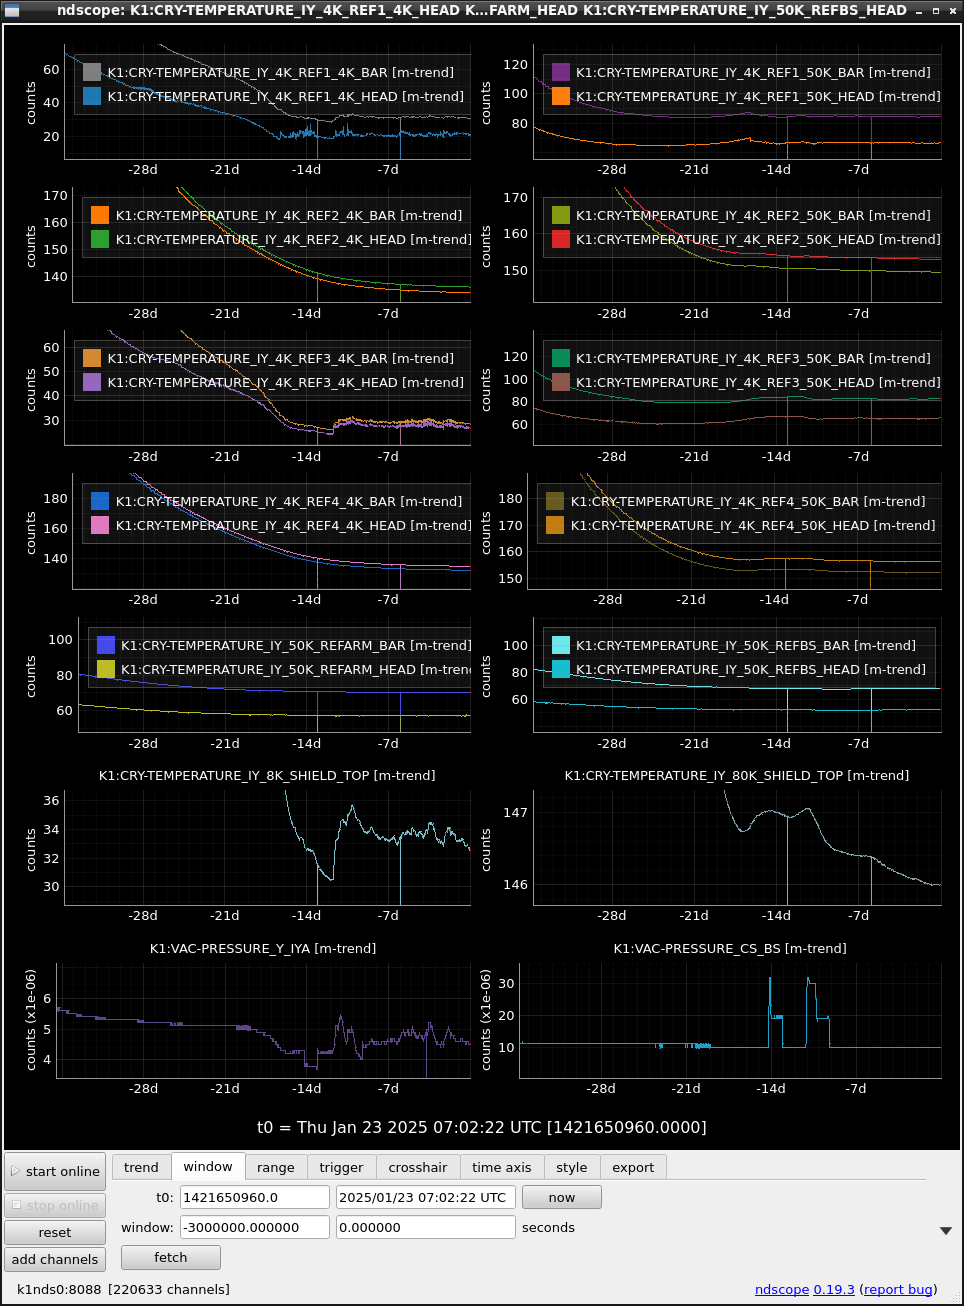
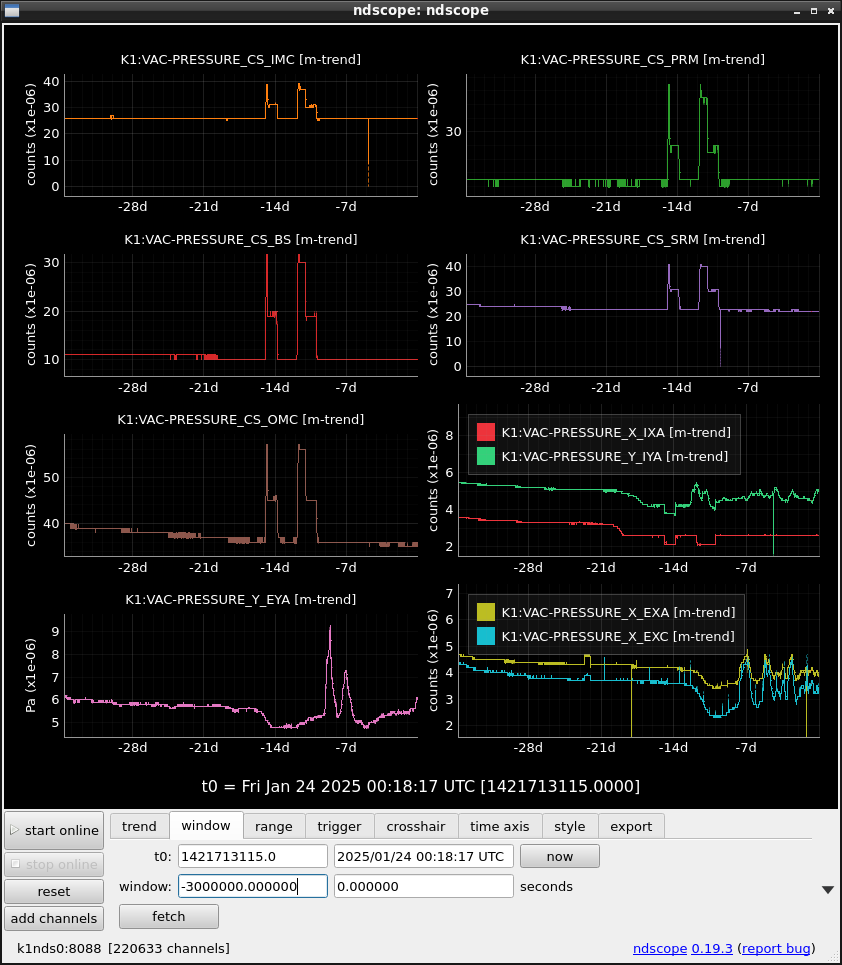
These are just memos for vacuum and cryocoolers' performance for ~ a month.
Fig1, 2, 3, 4 correspond to EX, IX, EY and IY. Fig.5 is vacuum levels.
EX and IY cryocoolers seem to show characteristic fluctuation around 20K~30K. IX performance is the best. EY seems to be stable after some fluctuations. Whether the fluctuation exists or not, the stable averaged temp around 30K at cryocoolers' heads and 8K shields is very important to avoid H2O release because of drastic temp enhancement as in the past case.
Images attached to this report
Comments to this report:
shinji.miyoki - 22:42 Friday 24 January 2025 (32459)
Print this report
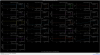
I added the cryocoolers for all duct shields. A slight concern is an increase of temperature at the EX-BRT side.
Images attached to this comment
MIF (General)takaaki.yokozawa - 9:20 Friday 24 January 2025 (32444)
Print this reportFinesse measurement Yarm 250124We didn't care the alignment so much in this measurement.
ATE : 2025/01/23 23:09 UTC ARM : Y TEMP ITM : 89.2 TEMP ETM : 88.4 NUM : 10 IFO REFL HWP : 168.0 PSL HWP : 30.0 IMC POWER : 7.2 VALUE : 1332.6 ERROR : 8.1
Measured data is stored to /users/Commissioning/data/Finesse/Yarm/20250123-230951
Summary of the Finesse (and temperature) https://gwdet.icrr.u-tokyo.ac.jp/~controls/trendMon/finesse.html
Images attached to this report
MIF (General)takaaki.yokozawa - 9:20 Friday 24 January 2025 (32443)
Print this reportFinesse measurement Xarm 250124I performed the FInesse measurement Xarm. Before this measurement, I tried to check the possible power of IMC output. We set the IMC_LSC_LOCKED for IO guardian IR_LOCKED for Xarm guardian HWP of the REFL table set to 168 deg. (HWP of the PSL was 13 deg.) As shown in Fig.1. we can increase the IMC output power to 7.1 W in 30 deg.
We didn't care the alignment so much in this measurement.
ATE : 2025/01/23 22:47 UTC ARM : X TEMP ITM : 89.1 TEMP ETM : 89.3 NUM : 10 IFO REFL HWP : 168.0 PSL HWP : 30.0 IMC POWER : 7.2 VALUE : 1456.1 ERROR : 10.3
Measured data is stored to /users/Commissioning/data/Finesse/Xarm/20250123-224708
Summary of the Finesse (and temperature) https://gwdet.icrr.u-tokyo.ac.jp/~controls/trendMon/finesse.html
Images attached to this report
VIS (IX)takafumi.ushiba - 8:54 Friday 24 January 2025 (32447)
Print this reportITMX control update
Same as ITMY (klog32441), I implemented feedback from TML OpLev signals to BFL actuators to damp the resonance around 1.7Hz. It should be moved to NBDAMP filters after the model update.
I also reduced the overall gain of MN_DAMP_L filters by a factor of 2 because the overall gain was increased maybe due to cooling. I haven't measure the OLTF, so it should be measured.
VIS (EY)takafumi.ushiba - 8:52 Friday 24 January 2025 (32446)
Print this reportETMY control update
Same as ITMY (klog32441), I implemented feedback from TML OpLev signals to BFL actuators to damp the resonance around 1.7Hz. It should be moved to NBDAMP filters after the model update.
I also tested NBDAMP of 1.2 and 2.1 Hz yaw resonances by using PF OpLev. There lops should also be moved to NBDAMP filter after the model update.
I took the TCam photos for four mirrors at 8:33 ~ 8:45 this morning, By judging the image analysis, we don't need to update the reference position of the mirror center.
CAL (Pcal general)dan.chen - 6:29 Friday 24 January 2025 (32442)
Print this reportComment to Pcal parameter evaluation (32429)
Using the data mentioned in the previous report, we determined the conversion factor ρ[V/W] for each integrating sphere. While the detailed reasons remain unclear, there is a slight shift observed on the day of the WSK incident. Furthermore, a comparison with the O4a data reveals a difference of approximately 1-2%. This discrepancy is likely attributed to changes in the WSK/GSK measurements (for further details, please refer to the report: klog #30199).
The results of ρ are attached to this report. Note that the mean values are not particularly meaningful, and the range of ±0.5% can be referred to instead. Additionally, a comparison between the O4a values and the latest results is summarized below:
ρ [V/W]
O4a
Latest
Diff (%)
Pcal-X ρRxPD
-0.67704
-0.66582
1.7
Pcal-X ρTxPD1
-1.9055
-1.8966
0.5
Pcal-X ρTxPD2
-2.6273
-2.5761
2.0
Next step is to estimate the uncertainty and fix how to "average" the data as explained on the previous report.
Images attached to this comment
VIS (IY)kenta.tanaka - 23:44 Thursday 23 January 2025 (32441)
Print this reportITMY local damping control fine tuning
I tried to damp the 1.66 Hz peak and tuned the ITMY damping control in the LEN direction. Fig. 1 shows the TM oplev spectra after tuning and the engagement of 1.66 Hz damping control. the spectra of PIT oplev from 1 Hz to 4 Hz seems to be improved slightly.
I will report the detail tomorrow.
Images attached to this report
MIF (General)kenta.tanaka - 23:39 Thursday 23 January 2025 (32440)
Print this reportPRFPMI lock failure due to DSOFT YAW?
Ushiba, Tanaka
We found that PRFPMI could not reach PRFPMI_RF_LOCKED and DSOFT YAW seems to start to oscilate largely after the engagement at this moment (fig.1). We need more investigation.
Images attached to this report
MIF (General)hirotaka.yuzurihara - 17:49 Thursday 23 January 2025 (32439)
Print this reportComment to lockloss investigation: 2024/12/21~12/30 (32409)
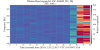
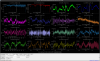
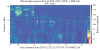
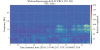
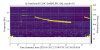
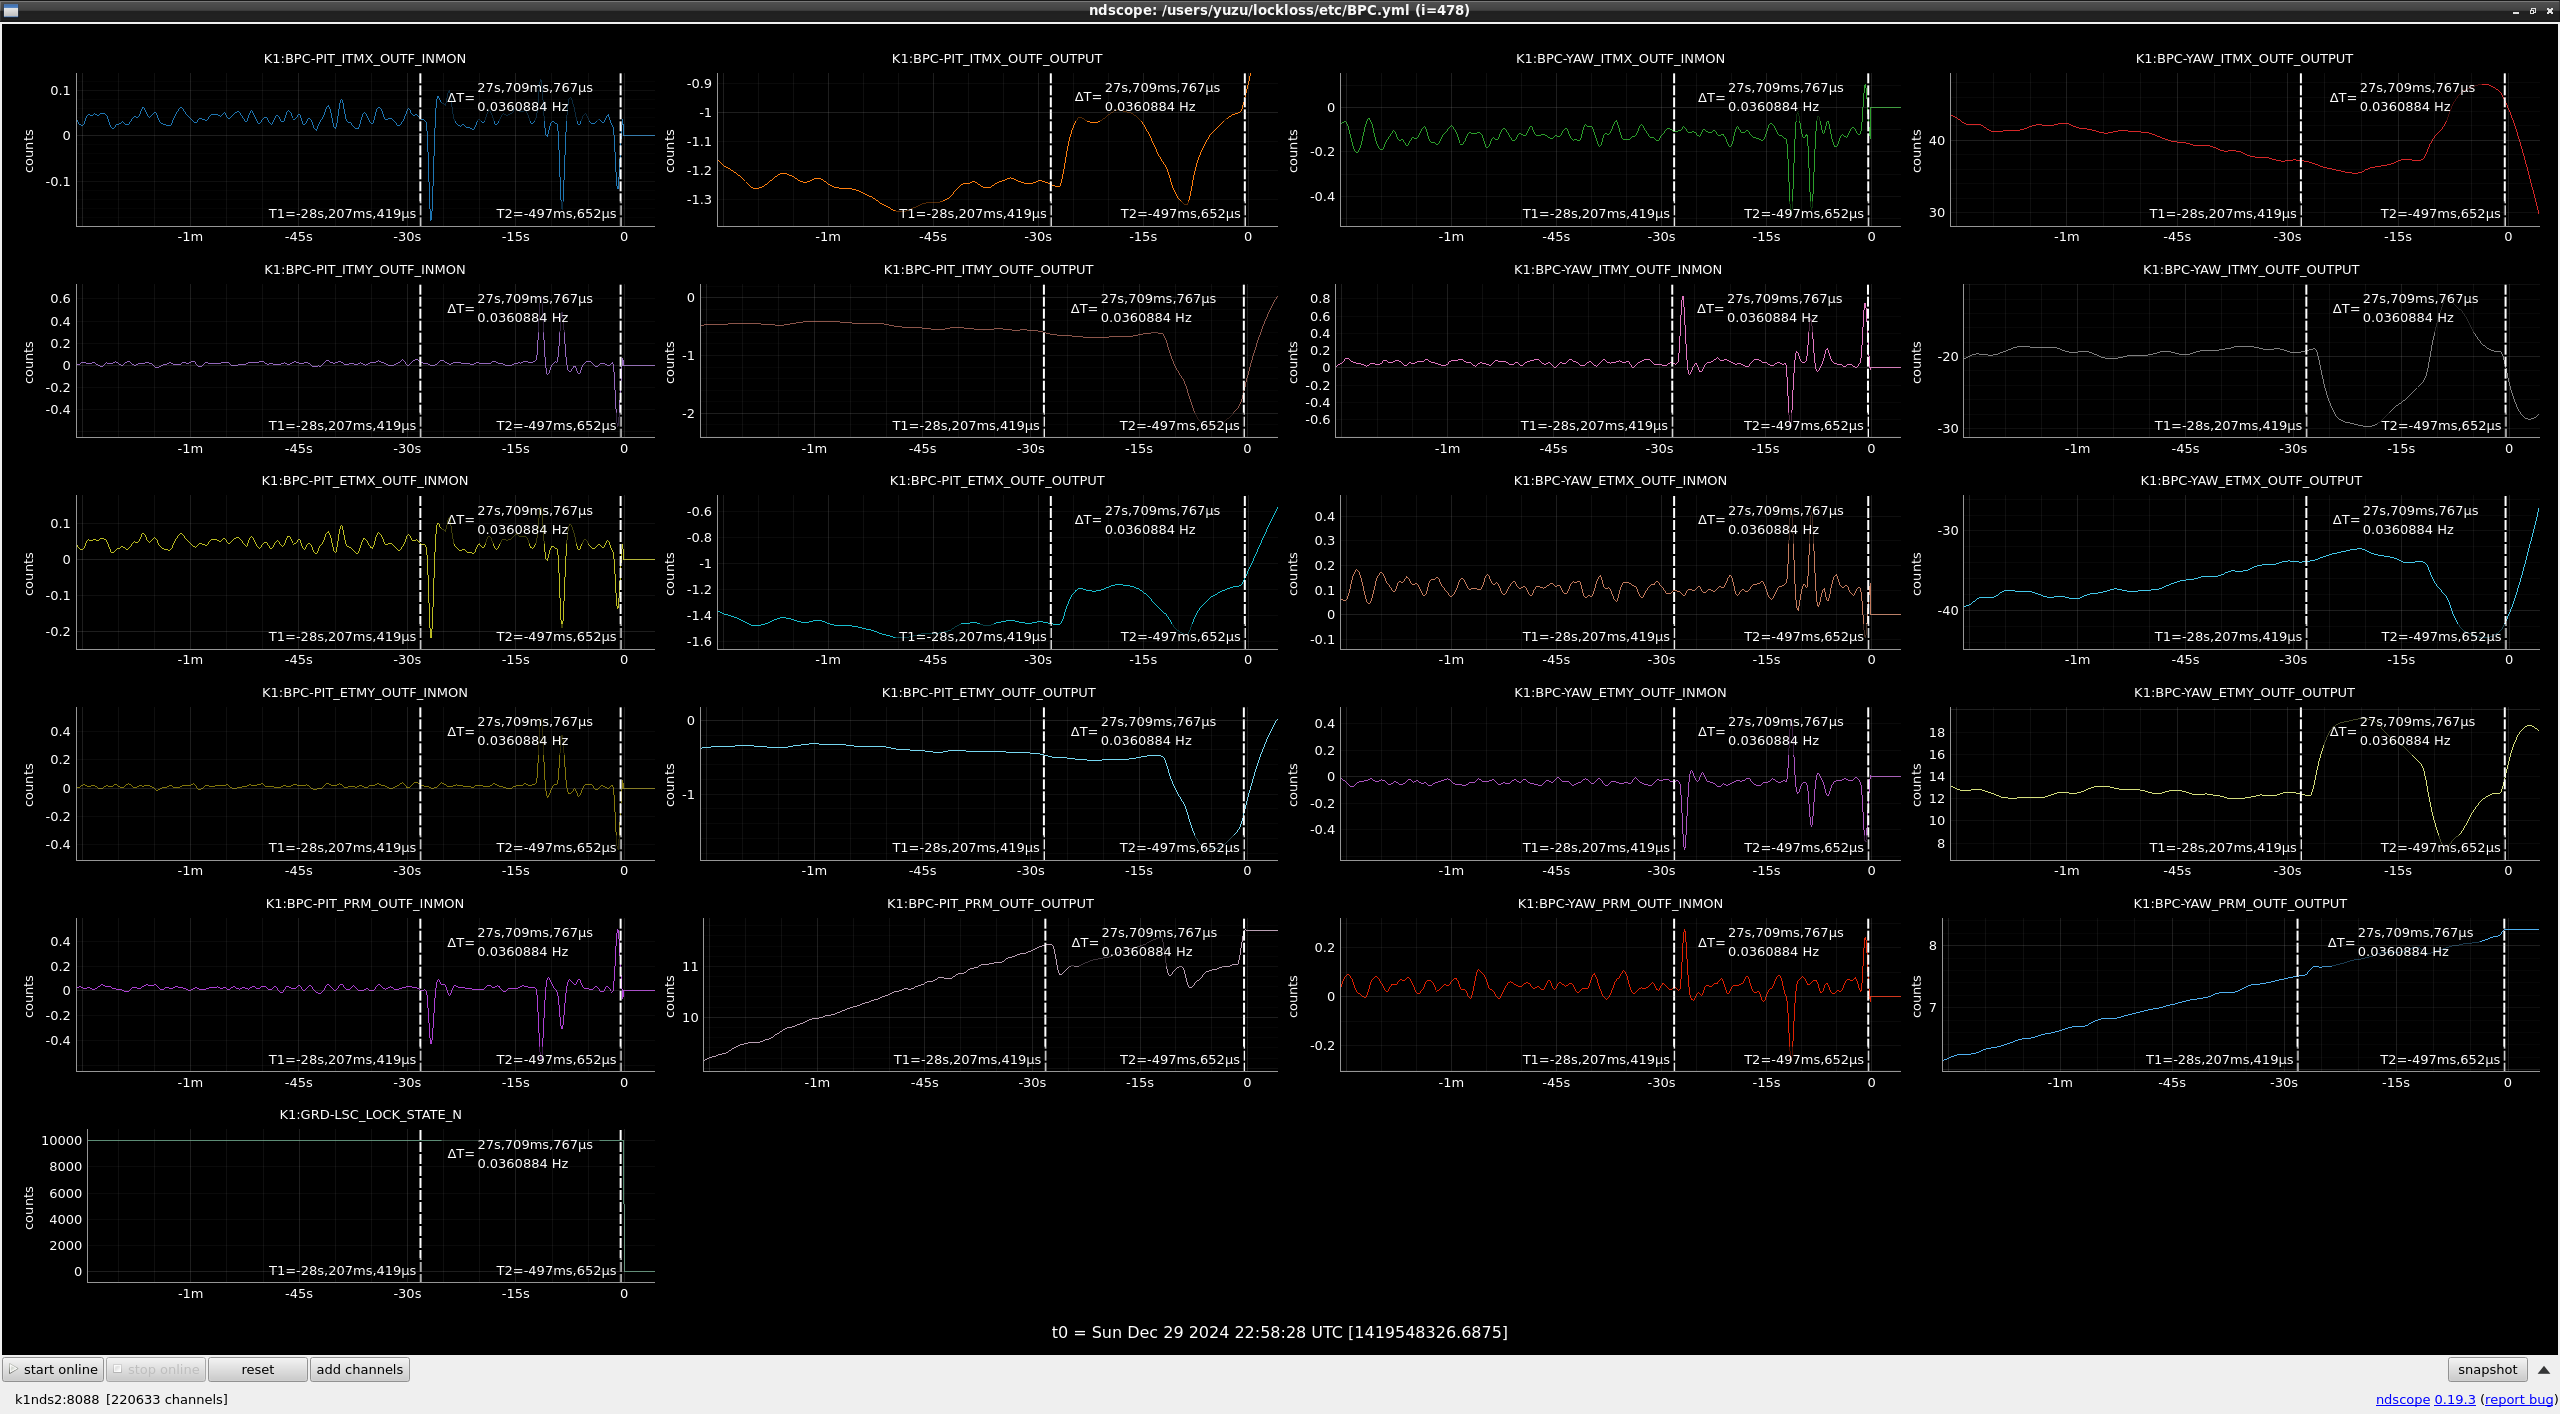
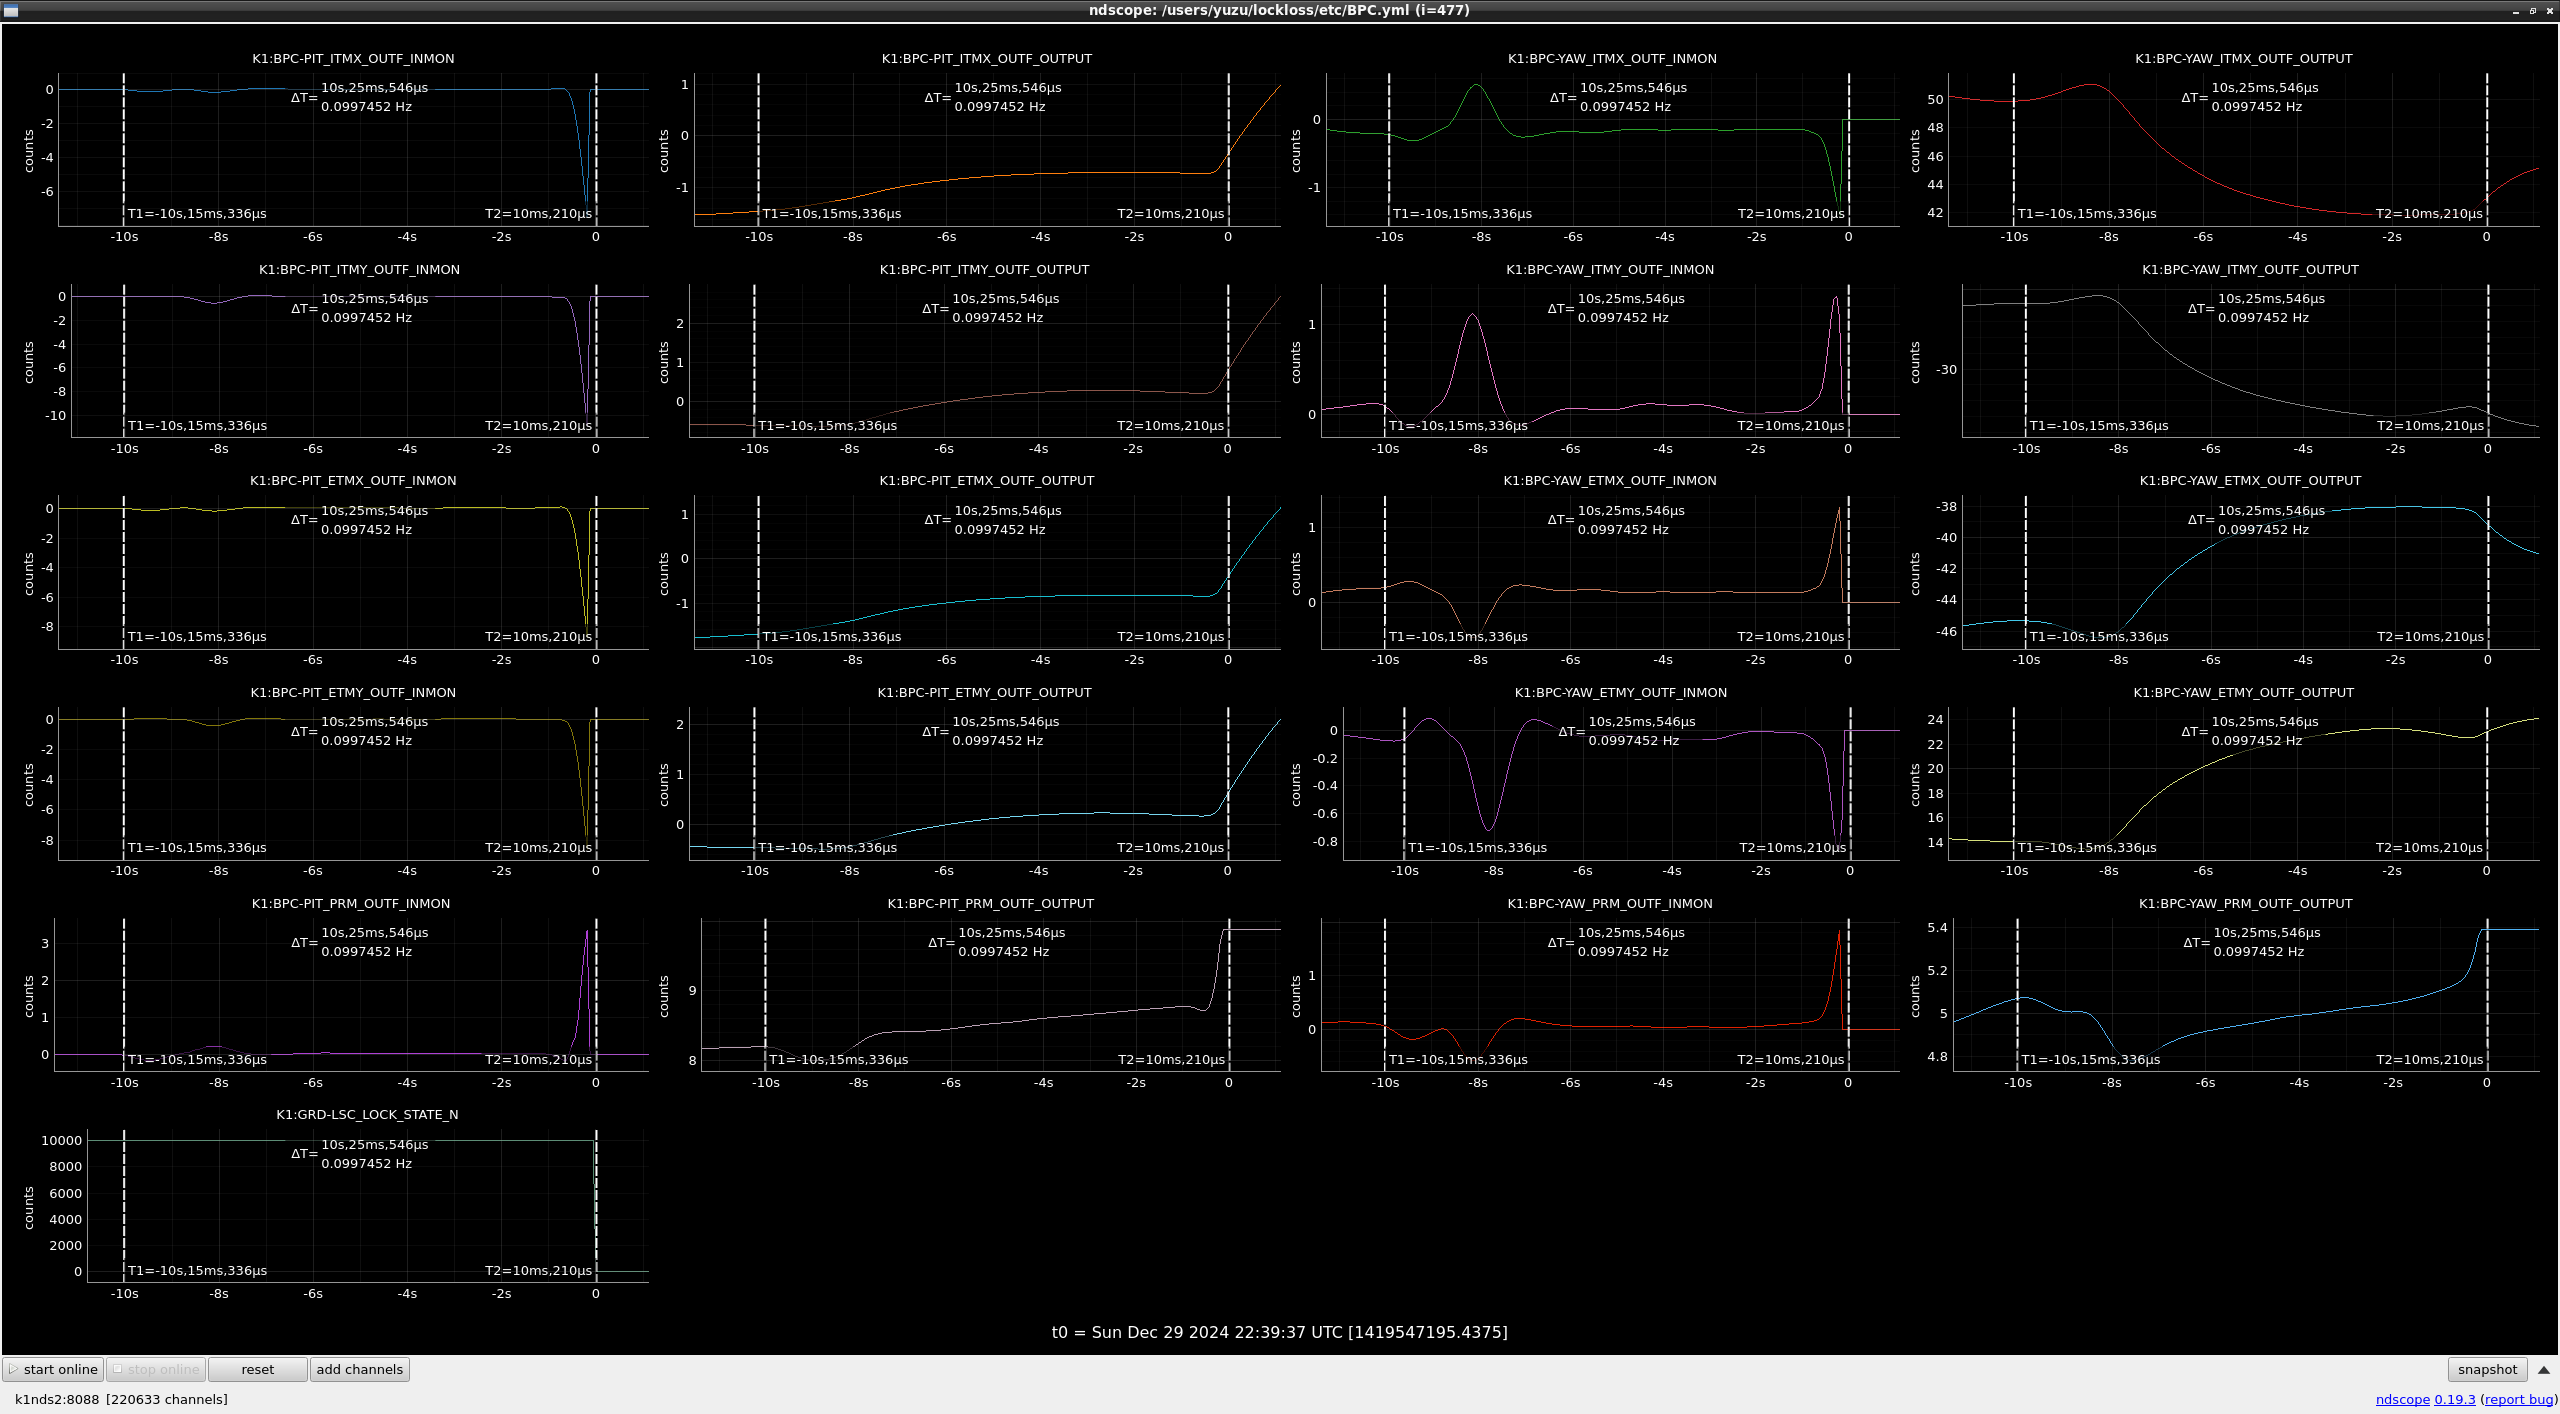
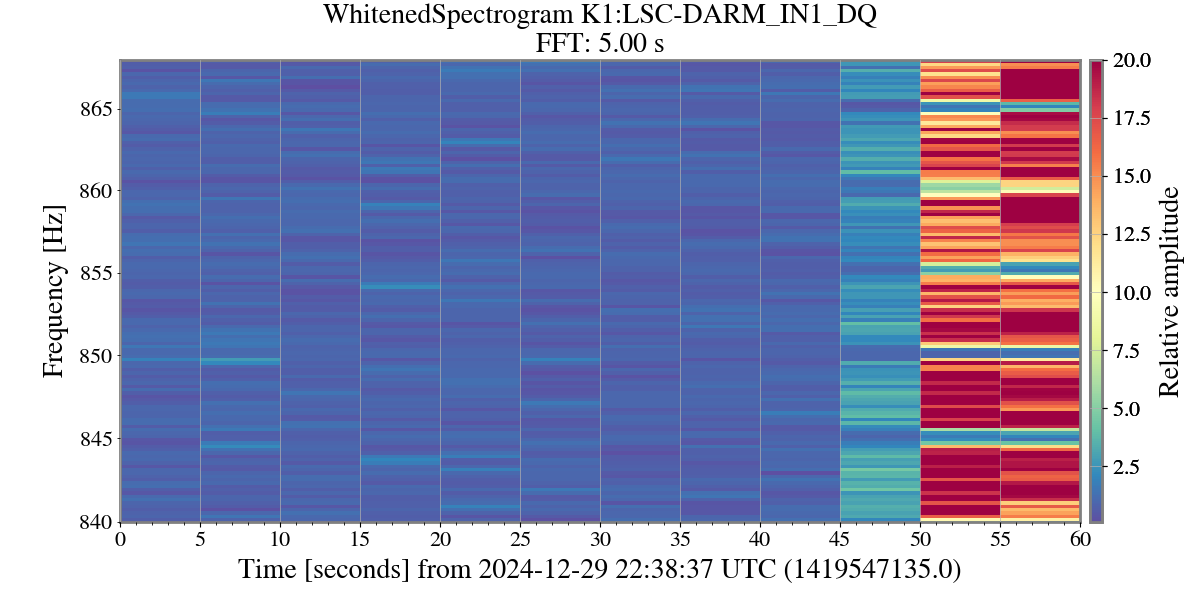
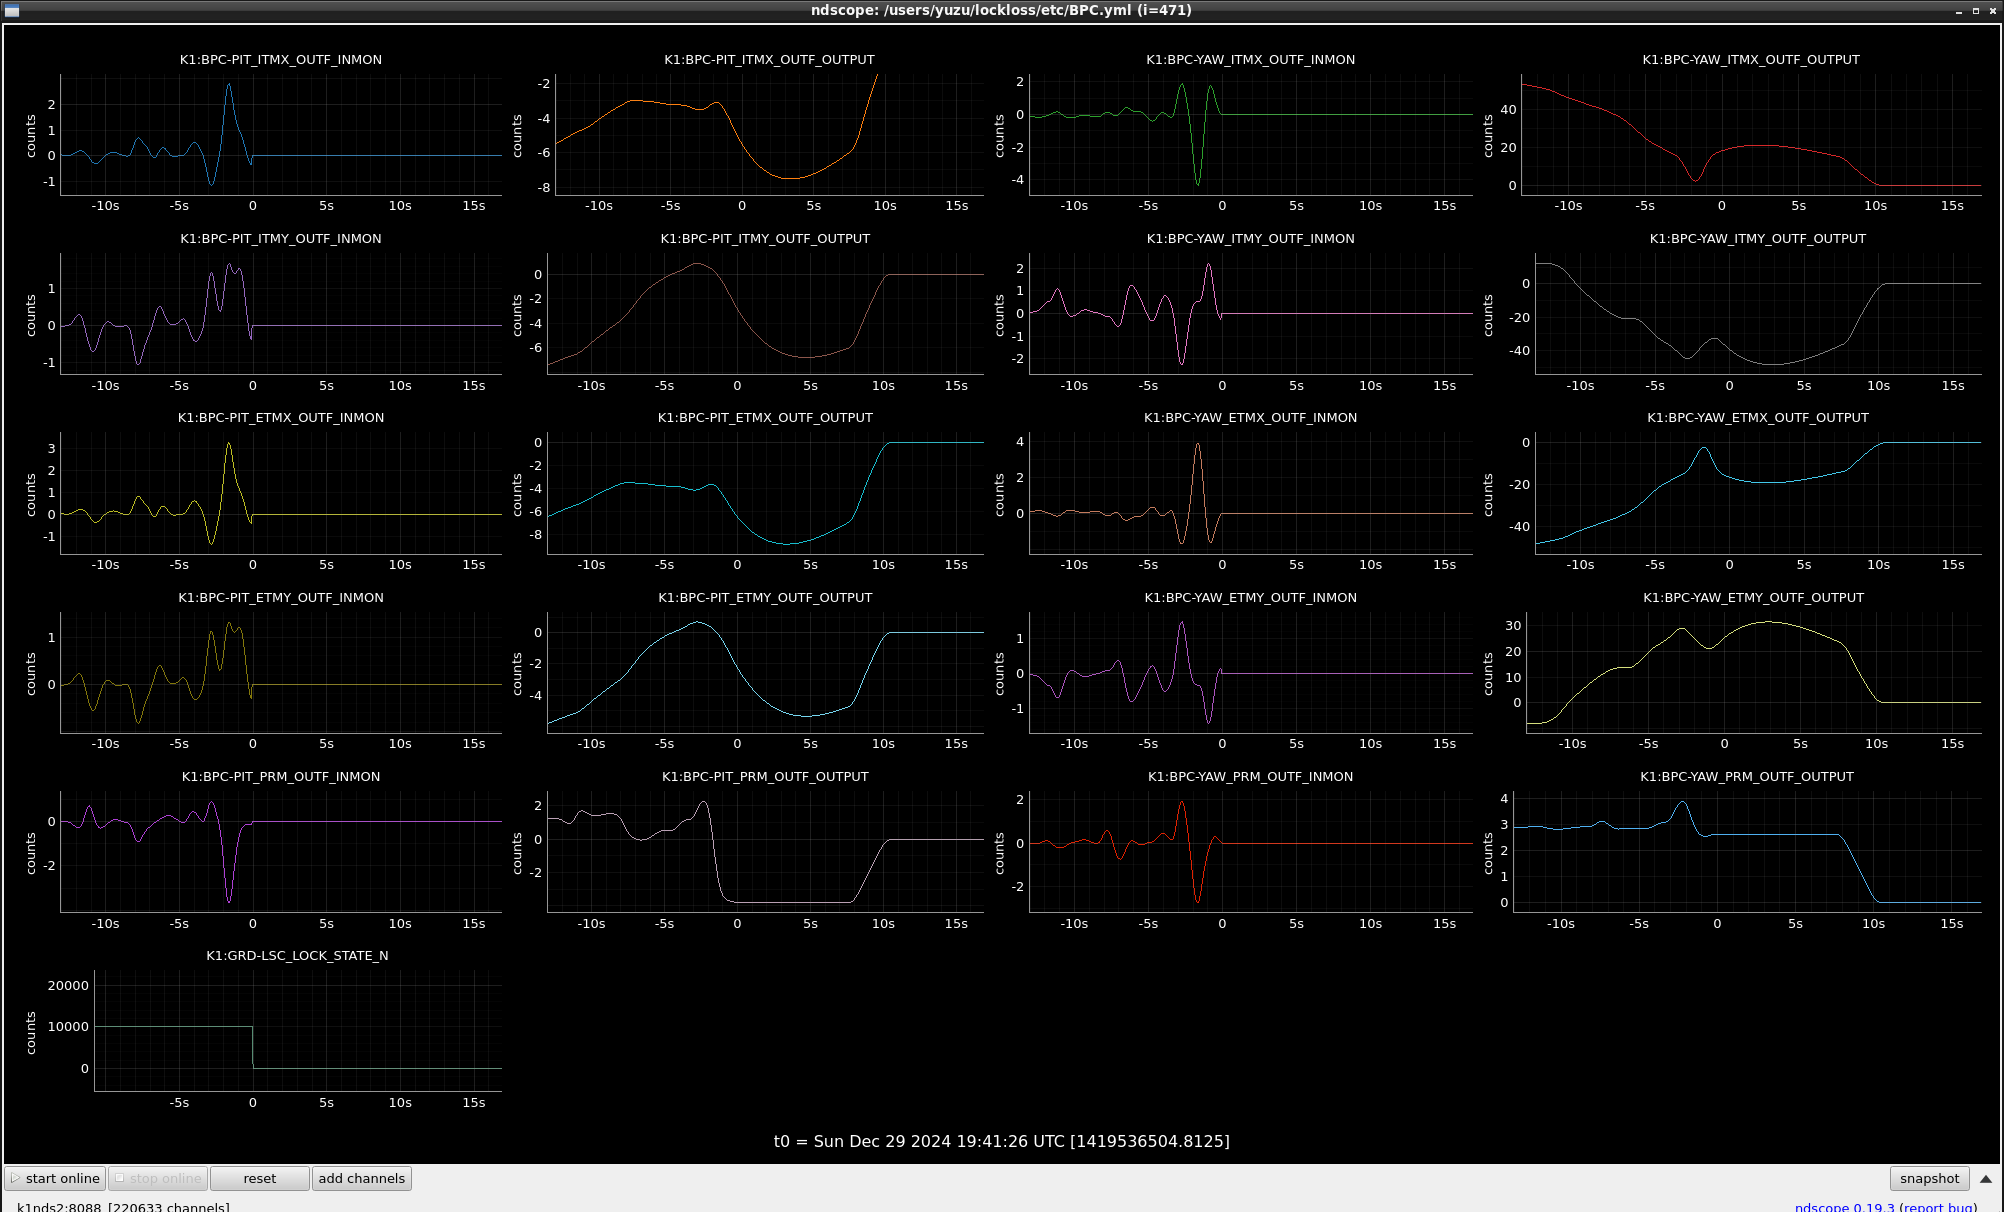
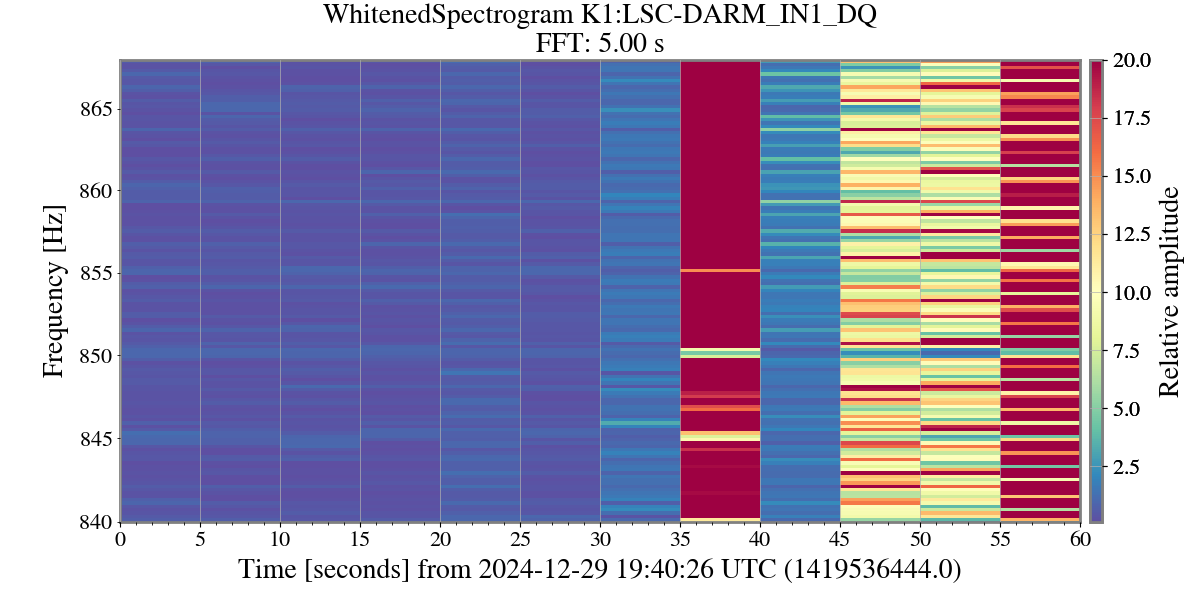
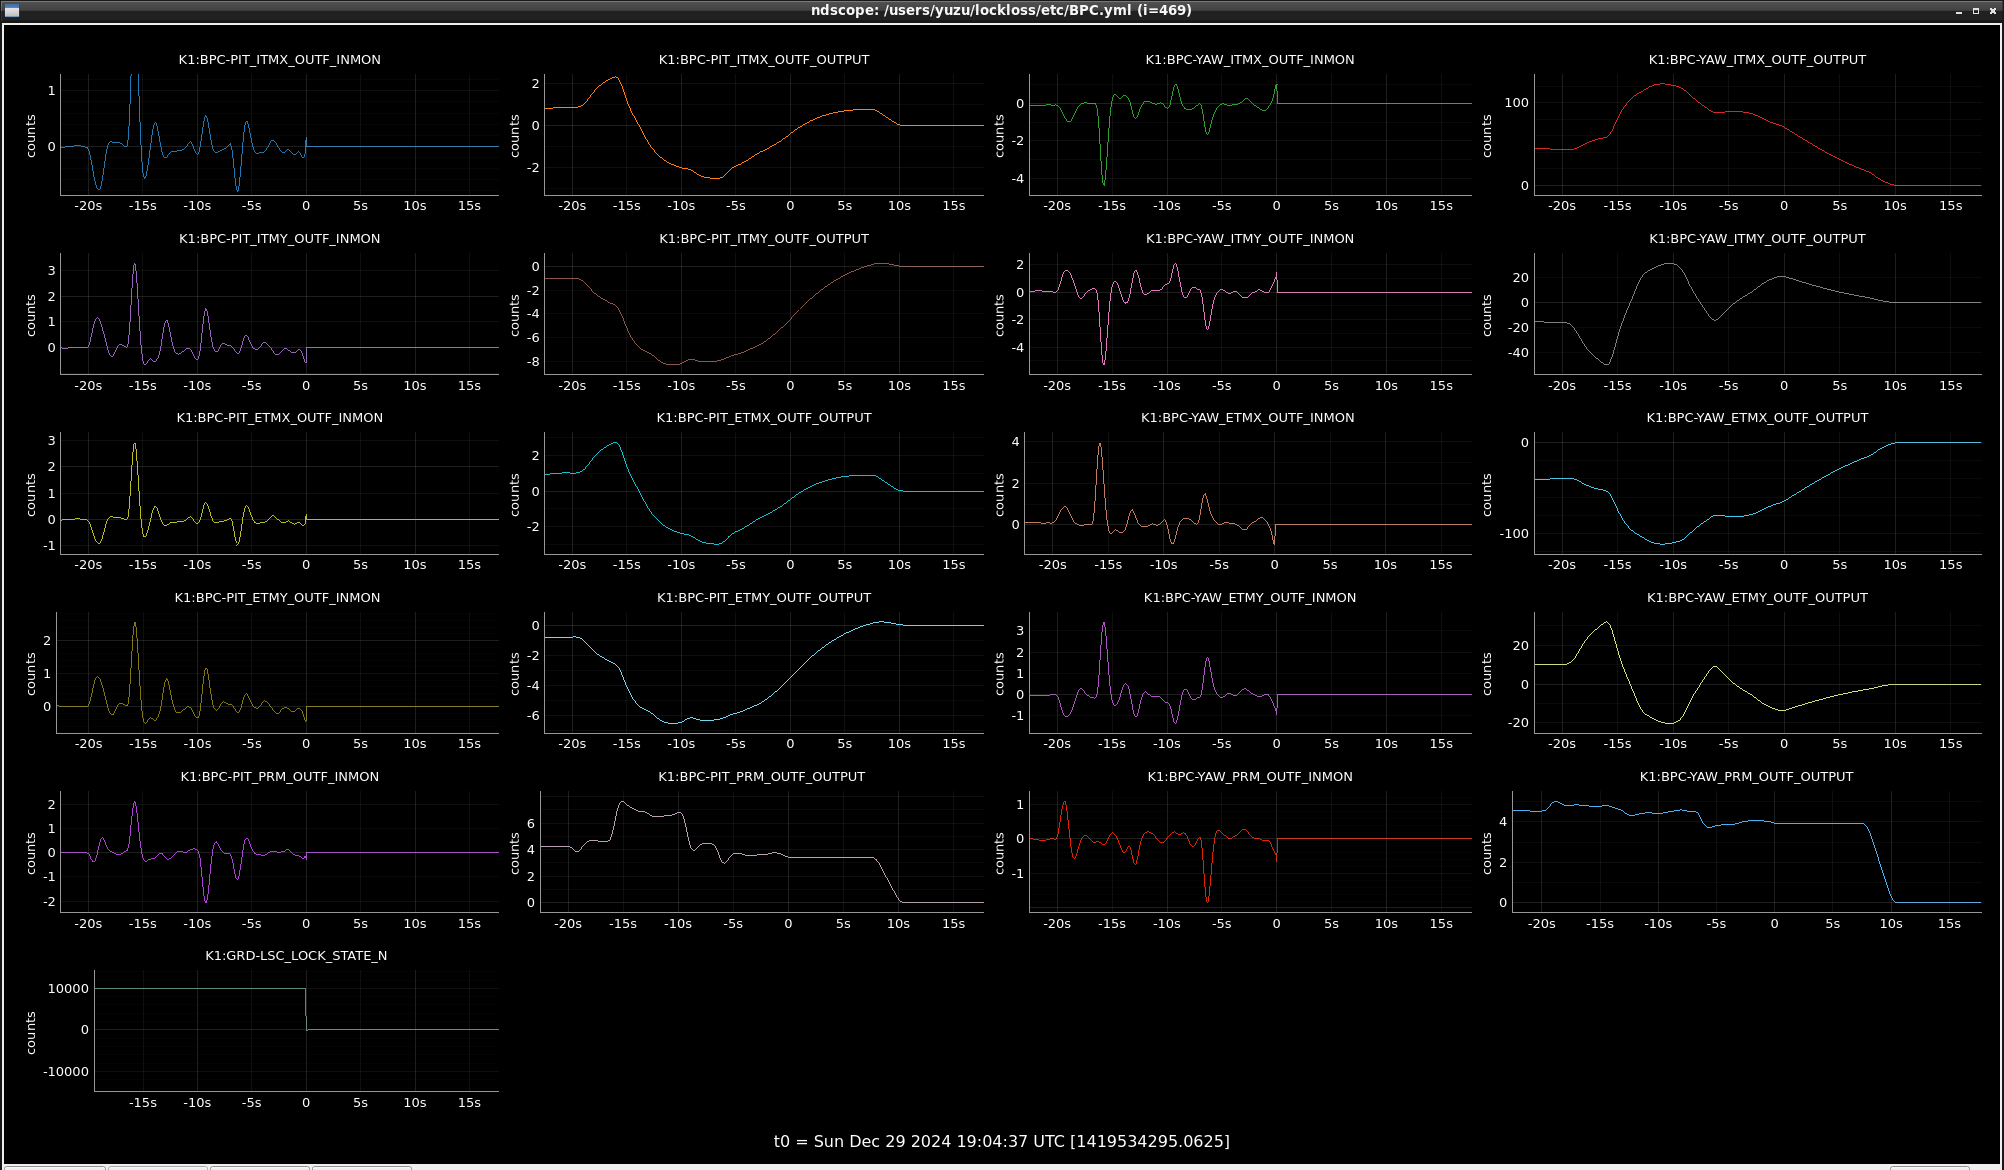
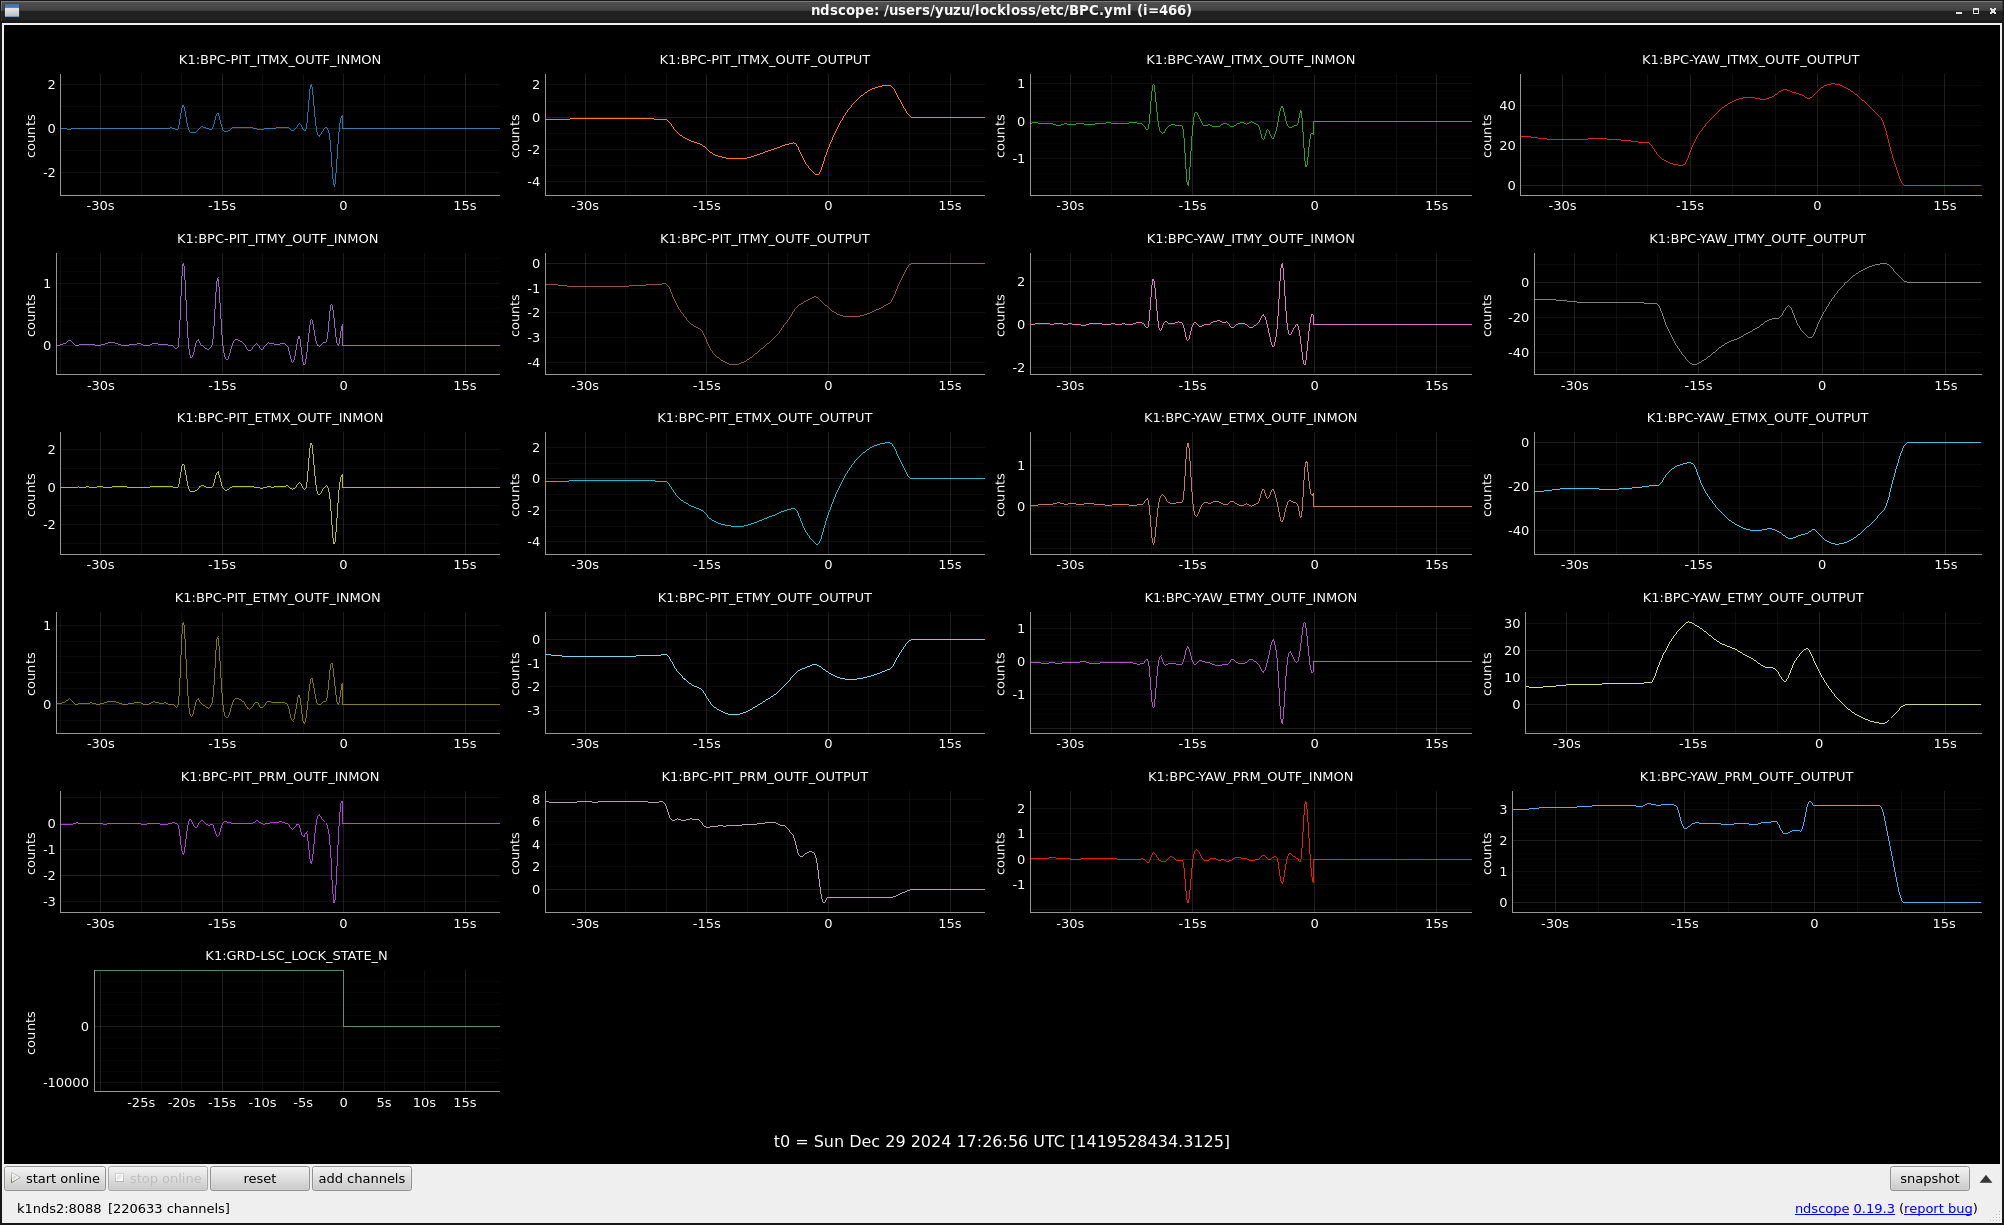
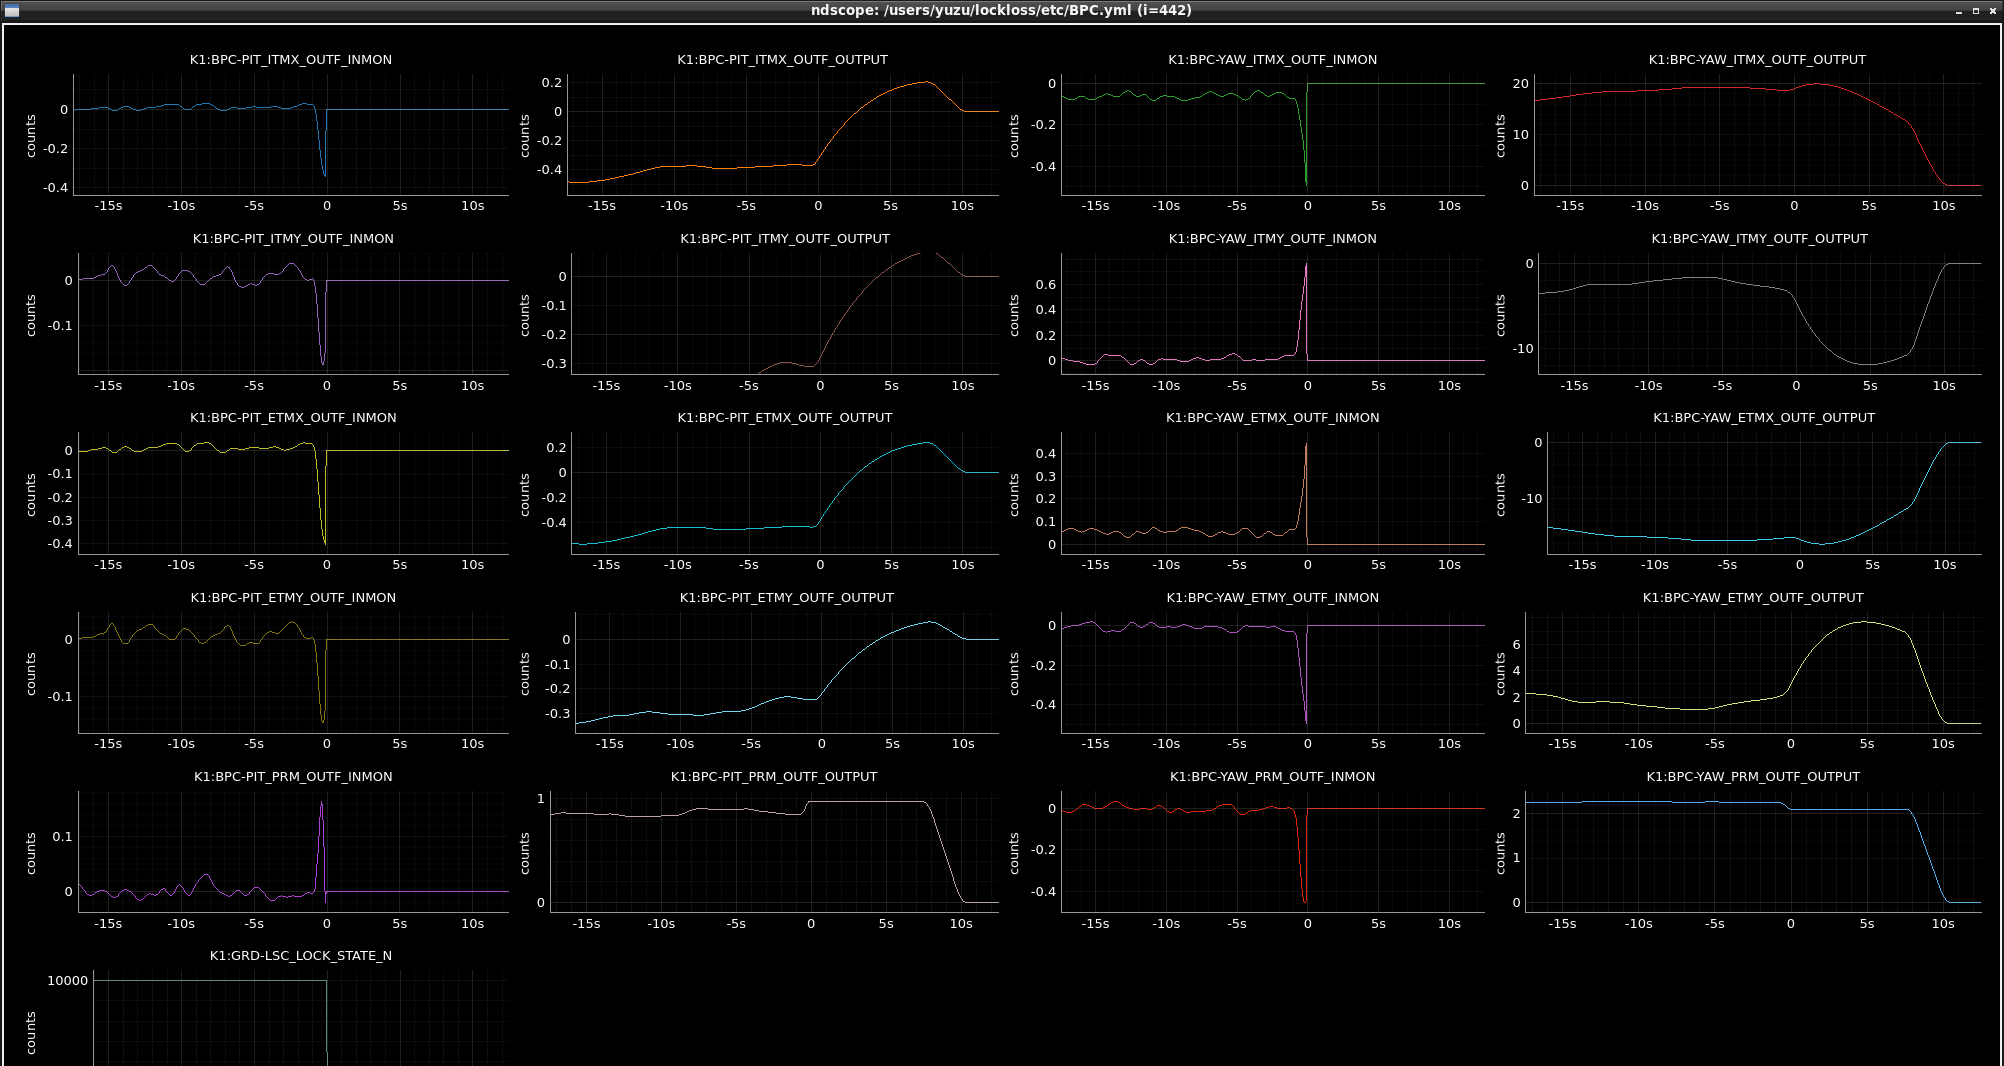
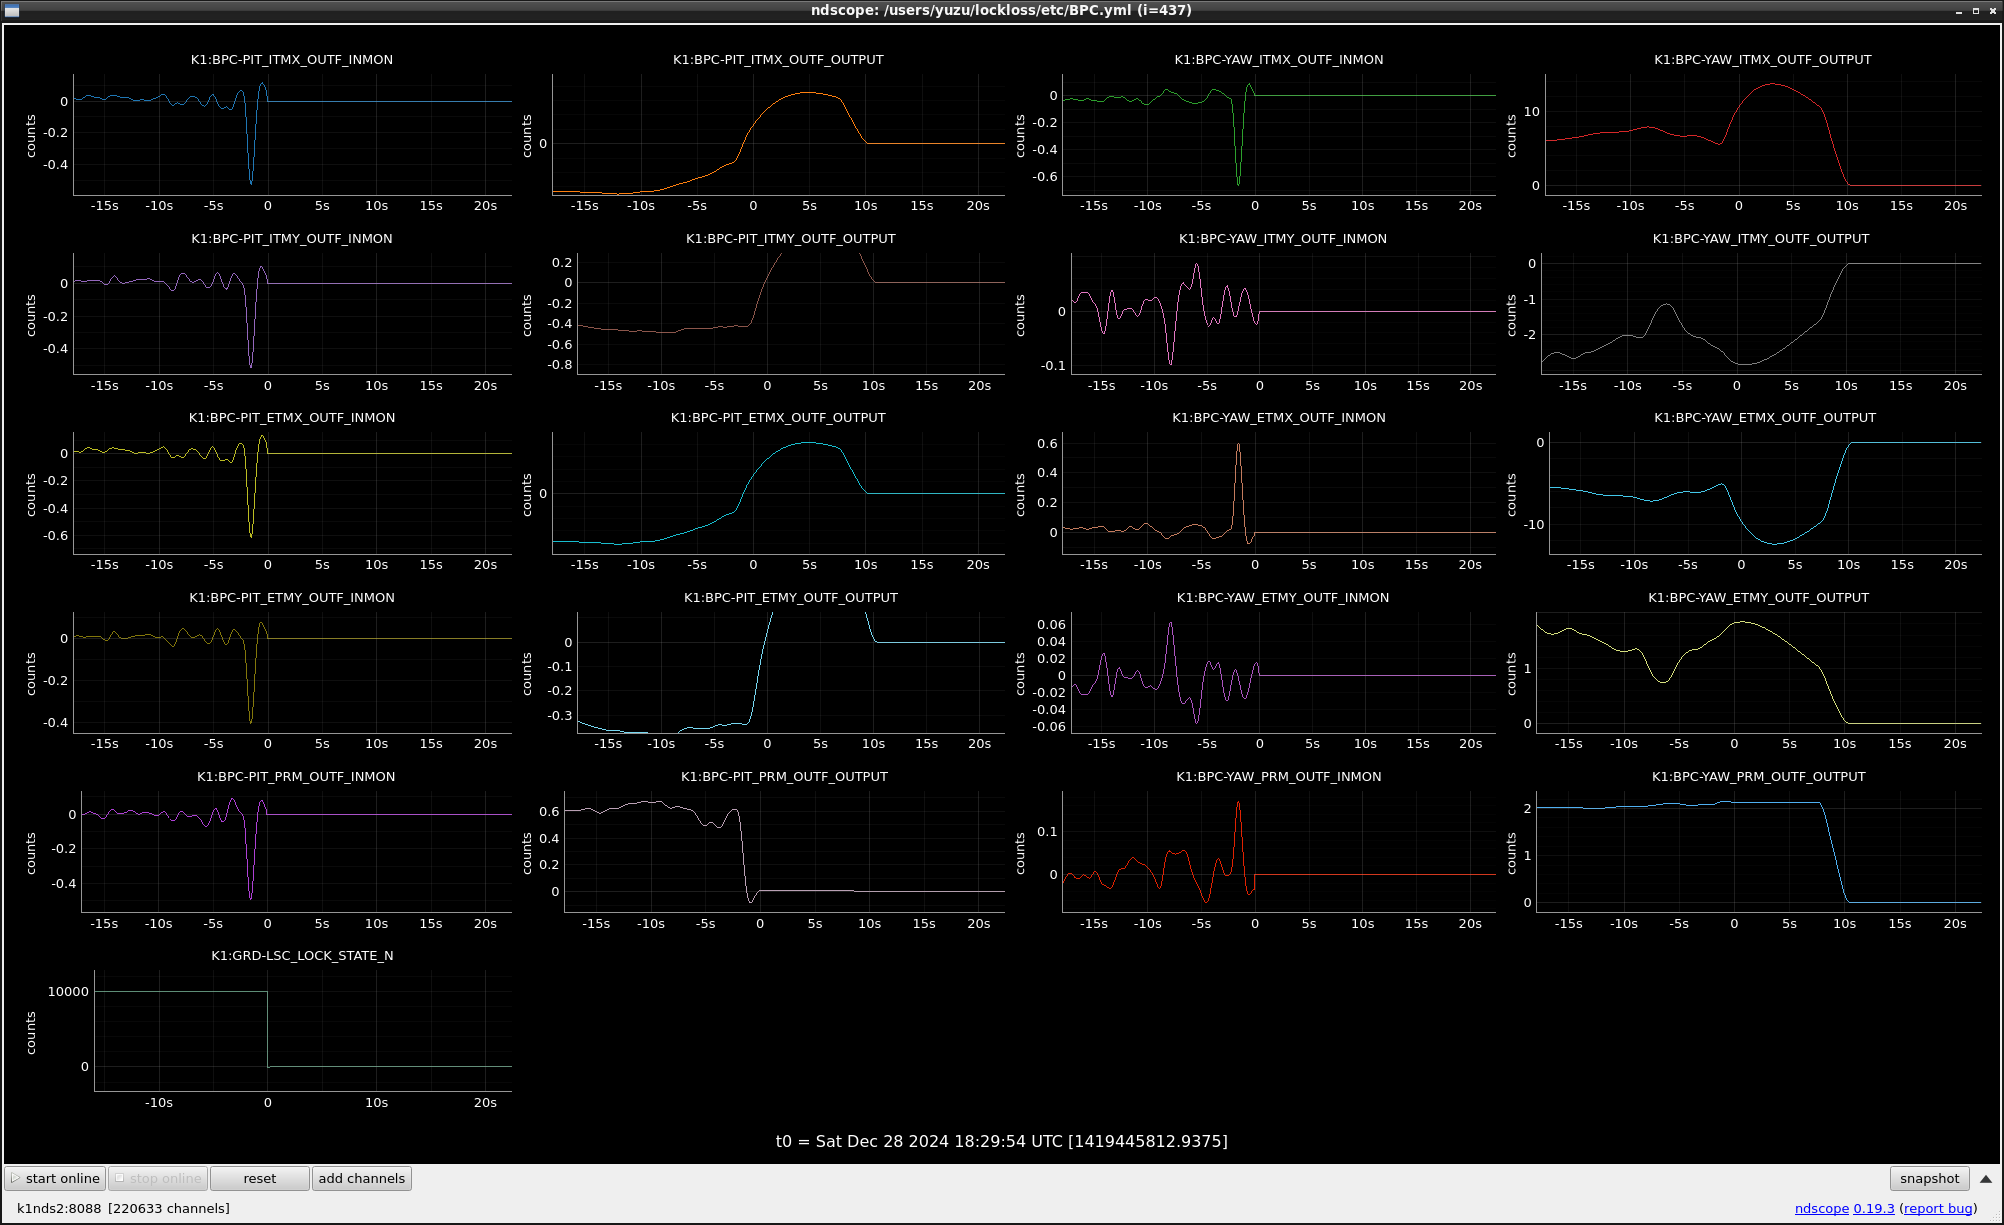
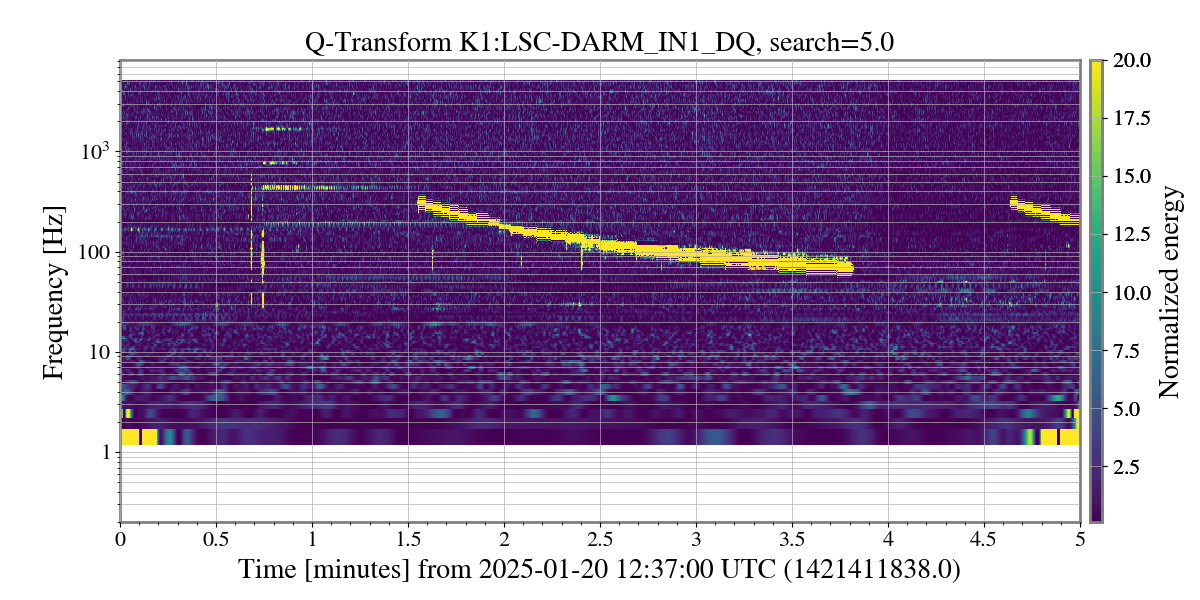
Sometimes, we observed the transient behavior in the error and feedback signal of BPC for ITMX/ETMX/ITMY/ETMY at the same time. The error signal is computed from the K1:LSC-DARM_IN1_DQ by demodulation of 865Hz for ITMX and ETMX, 845 Hz for ITMY and ETMY, and 870 Hz. If some additional noise was induced in K1:LSC-DARM_IN1_DQ, it’s possible to mimic the shift of the beam spot and the feedback signal will be sent to the suspension and makes the drift to somewhere, even though the actual beam spot was not moved. That's the scenario we are considering.
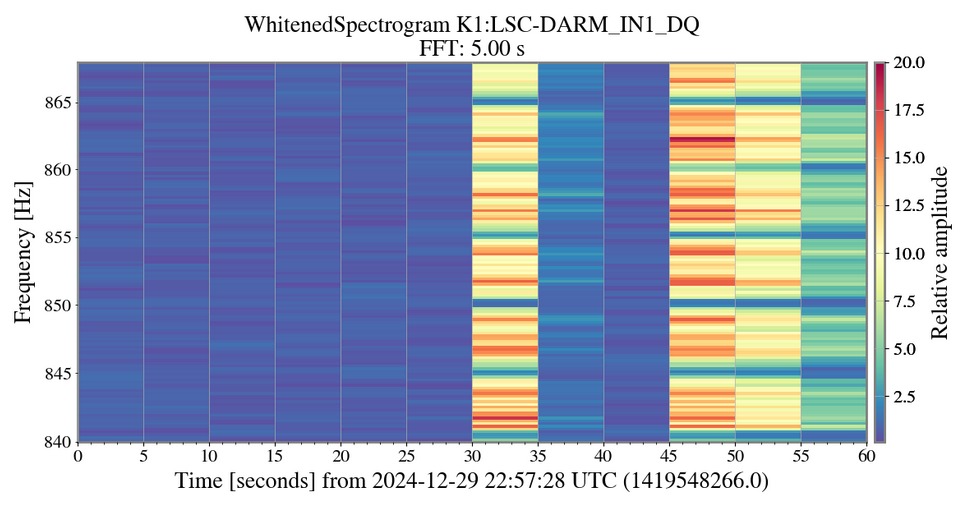
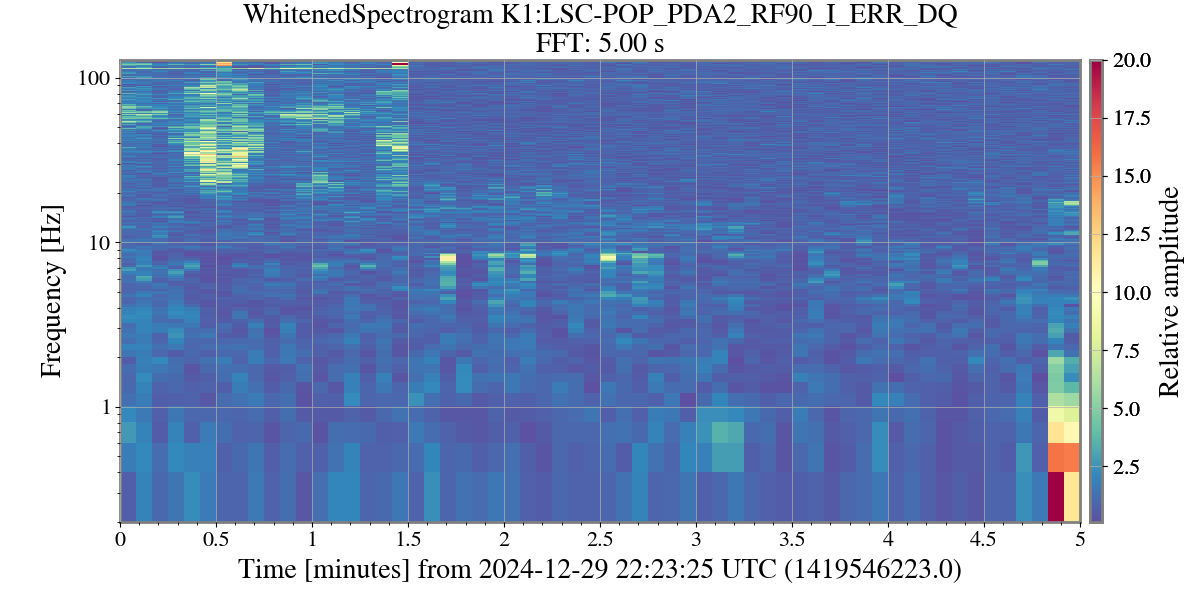
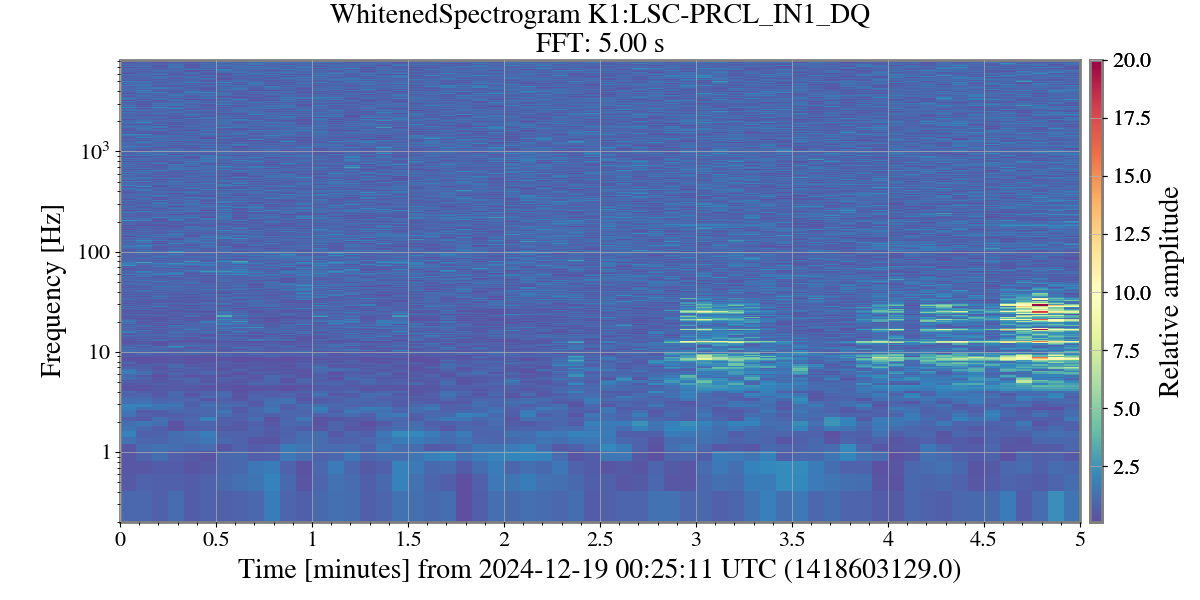
The timeseries of error and feedback signal for the BPC are attached. You can see the transient behabior before the lockloss. The whitened spectrogram is also attached. Before the locklos, the noise level seems to be increased due to some reason. Based on the chat with Ushiba-san, the amount of feedback signal to ITMX/ETMX/ITMY/ETMY looks small to move the mirror drastically and make the lockloss. On ther other hand, the feedback to PRM is in the unit of urad. It's pottential to move the mirror a lot and make the lockloss.
2024-12-29 22:58:28 UTC (Fig): Whitened Spectrogram around the BPC frequency (Fig)
2024-12-29 22:39:37 UTC (Fig): Whitened Spectrogram around the BPC frequency (Fig)
2024-12-29 19:41:26 UTC (Fig): Whitened Spectrogram around the BPC frequency (Fig)
Check the behavior of POP90 before the lockloss and check if the POP90 decreased by PRM feedback or not.
Check the spectrum of all frequency range of K1:LSC-DARM_IN1_DQ by changing the time
Check more lockloss time about whether this phenomena was happening or not
Images attached to this comment
MIF (General)hirotaka.yuzurihara - 17:00 Thursday 23 January 2025 (32431)
Print this reportComment to lockloss investigation: 2024/12/21~12/30 (32409)
This is a continuous work.
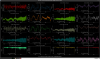
Excess at f<=10 Hz in PRCL and MICH
We checked the lockloss at the time we observed the excess power in PRCL and MICH channels at f<10Hz. After the investigation, this phenomena happened only three times. The situation of each losk is different each other.
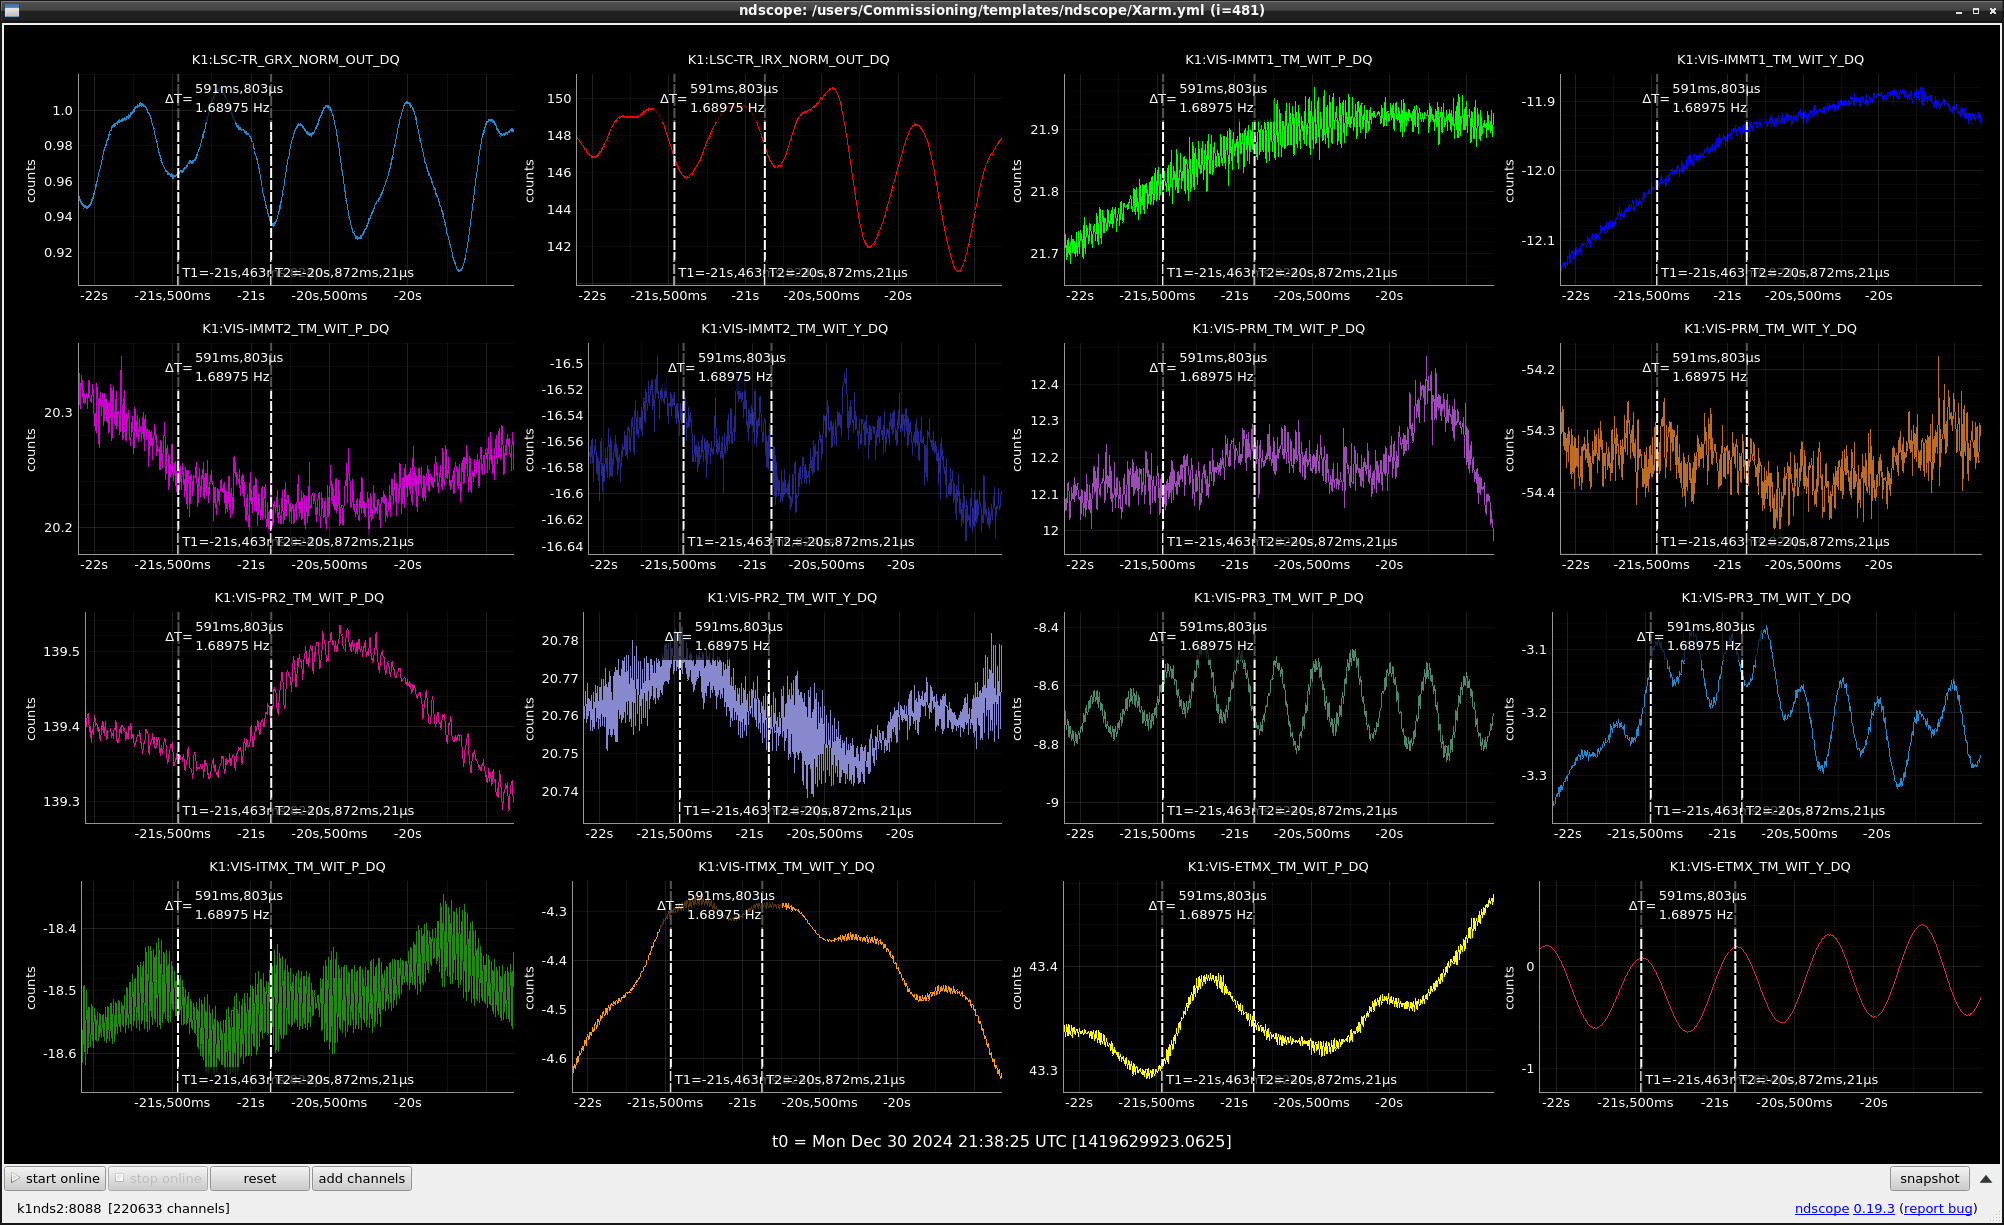
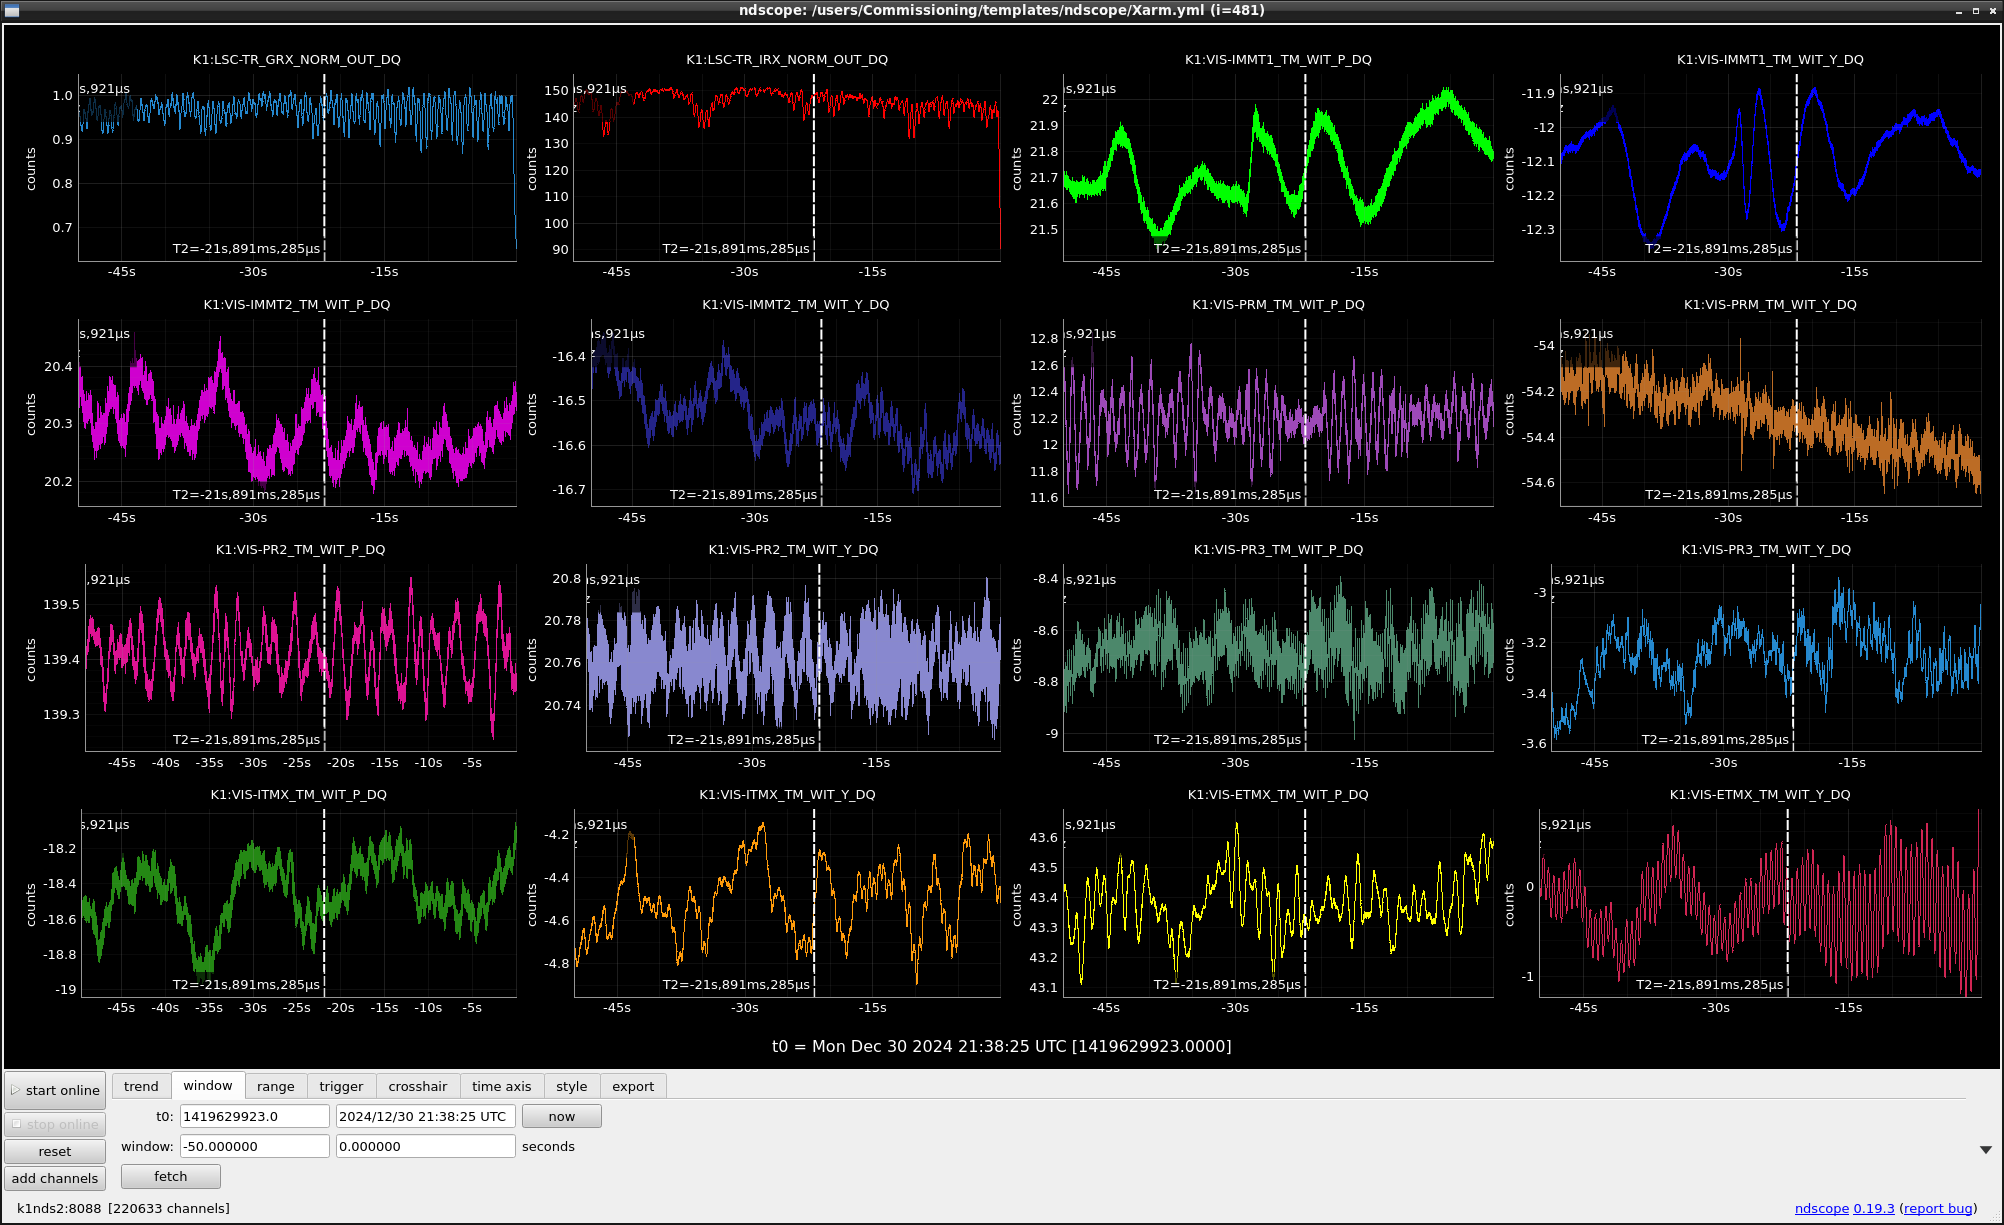
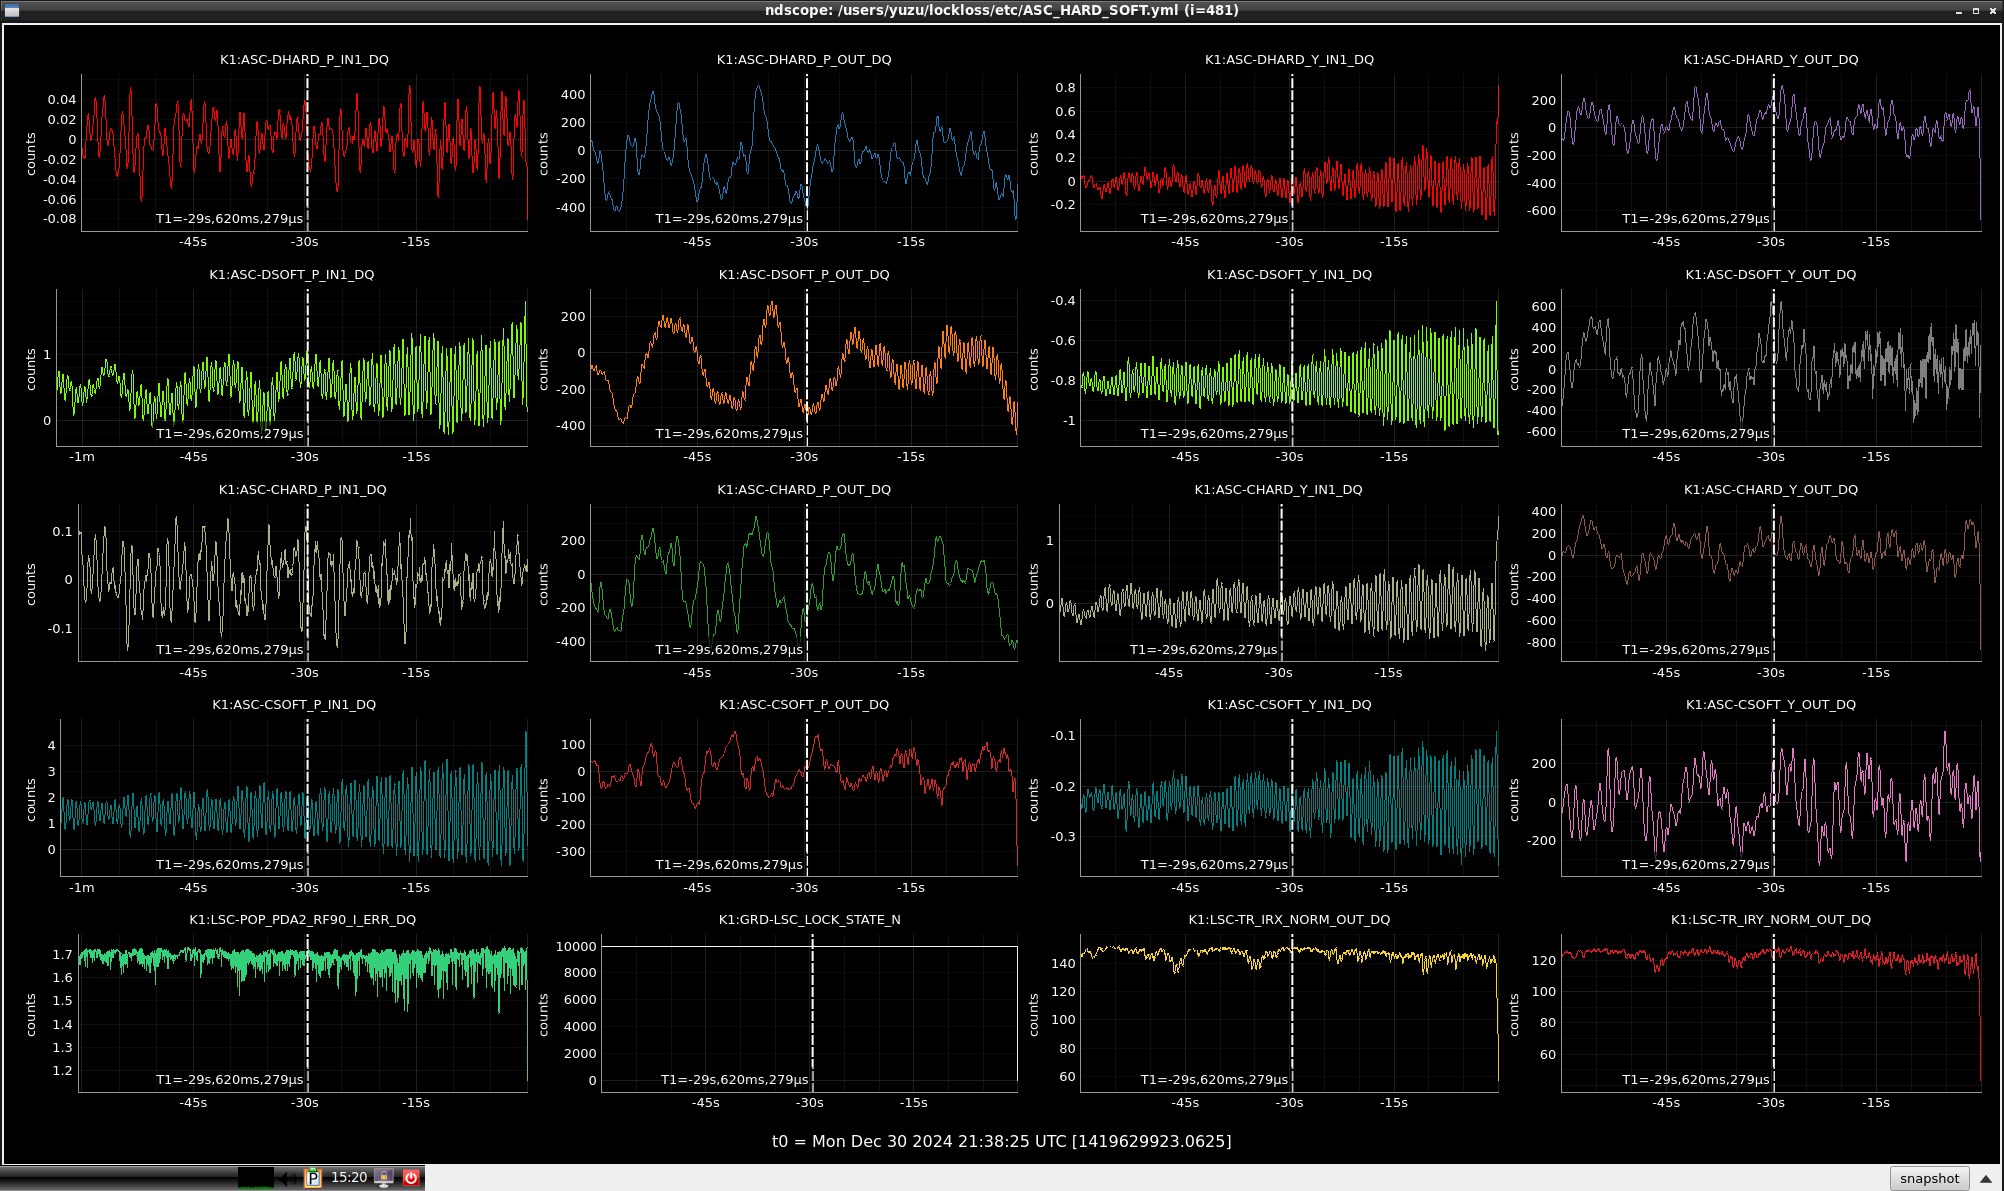
2024-12-30 21:38:25 UTC
ETMX yaw was oscillating with ~1.7Hz. (Fig) But this is not critical for locklos. At 21 s before the lockloss, the amplitude of the ETMX yaw started to increase. (Fig) At the same time, the ASC controls started to oscilation. This will be the cause of the lockloss. (Fig)
For other two times, we are still not sure the clear lockloss cause.
MIF (General)hirotaka.yuzurihara - 16:36 Thursday 23 January 2025 (32437)
Print this reportComment to Helper guardian for lockloss check (31045)
Thank you for updating the SYS_LOCKLOSS guardian.
It is possible to add the label indicating if someone was adding the excitation signal? In the lockloss of 2025-01-19 02:47:58 UTC, the commissioners were working on the measurement of the transfer function by using the excitation. Ushiba-san commented that when the excitation is happening, any situations are possible. If you add such label, we can ignore the lockloss under the excitation, during the lockloss investigation.


