(Miyakawa,Saito)
Abstract:
To examine the high-frequency behavior of the PZT efficiency, we fitted a model to the measurement results and used the model to plot the PZT efficiency behavior. Resonances were confirmed above 80 kHz.
Detail:
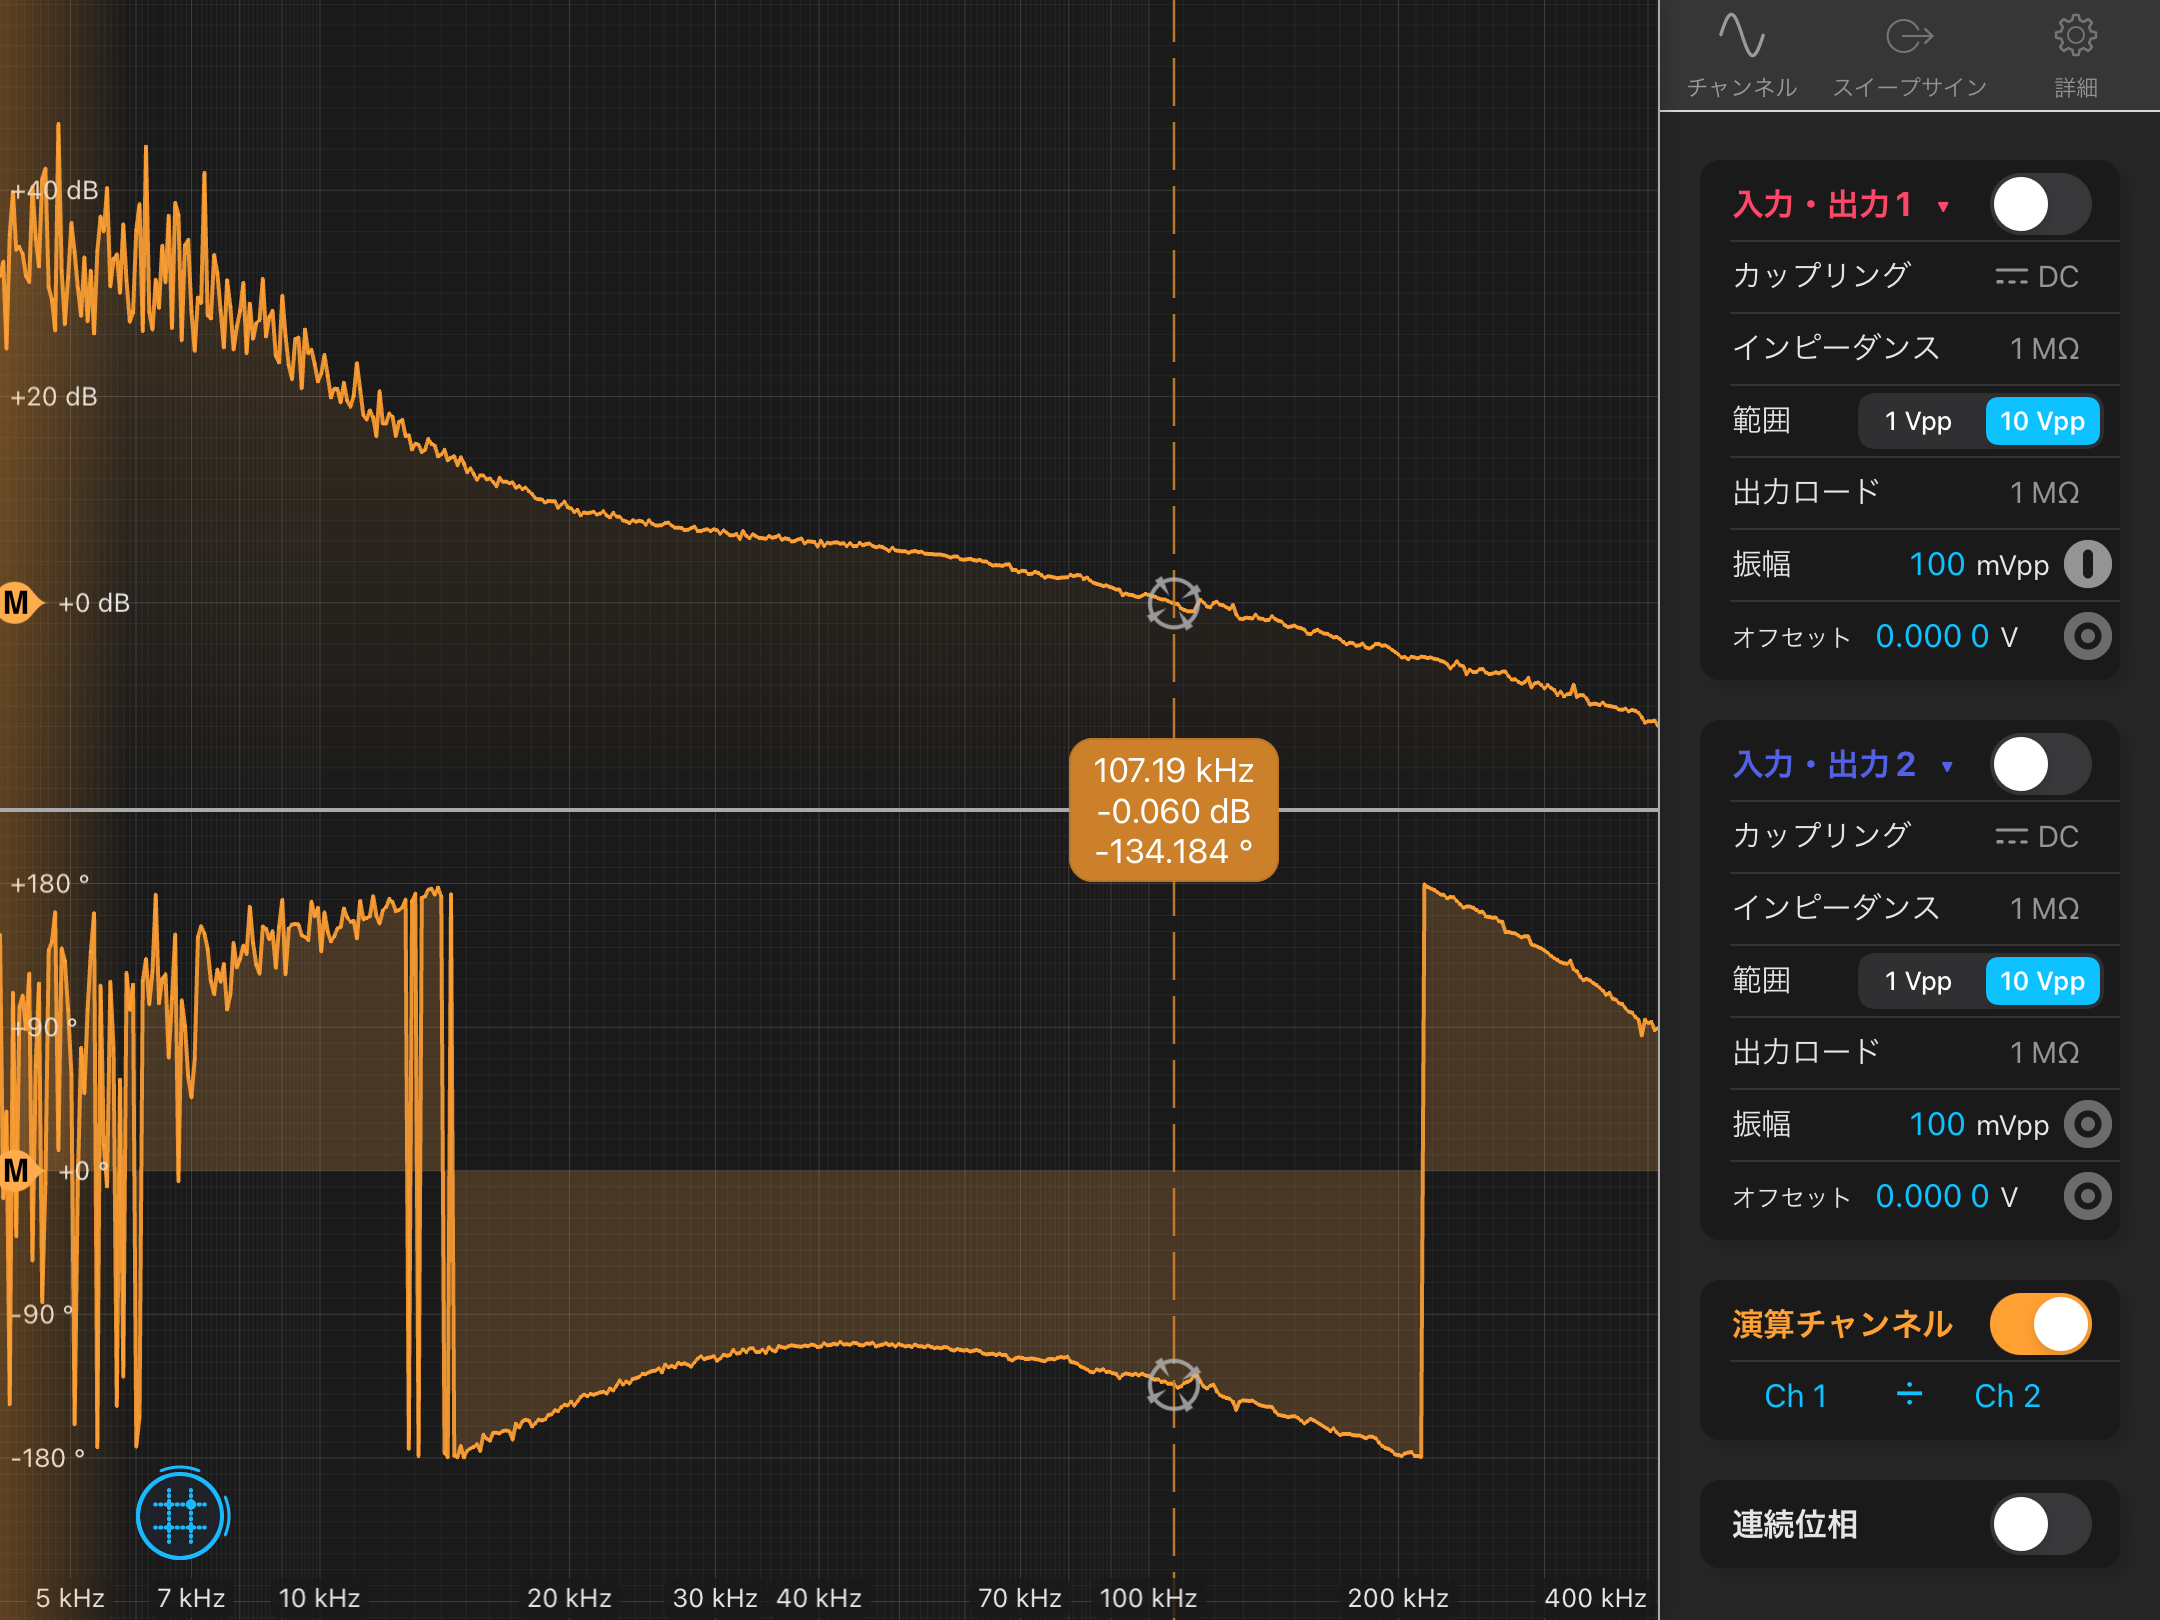
First, we measured the IMC OLTF using test1 and test2 of the IMC servo common path [G_p+G_e](Fig.1). Here, G_p is the transfer function of the PZT loop, and G_e is the transfer function of the EOM loop. The UGF was approximately 110 kHz.
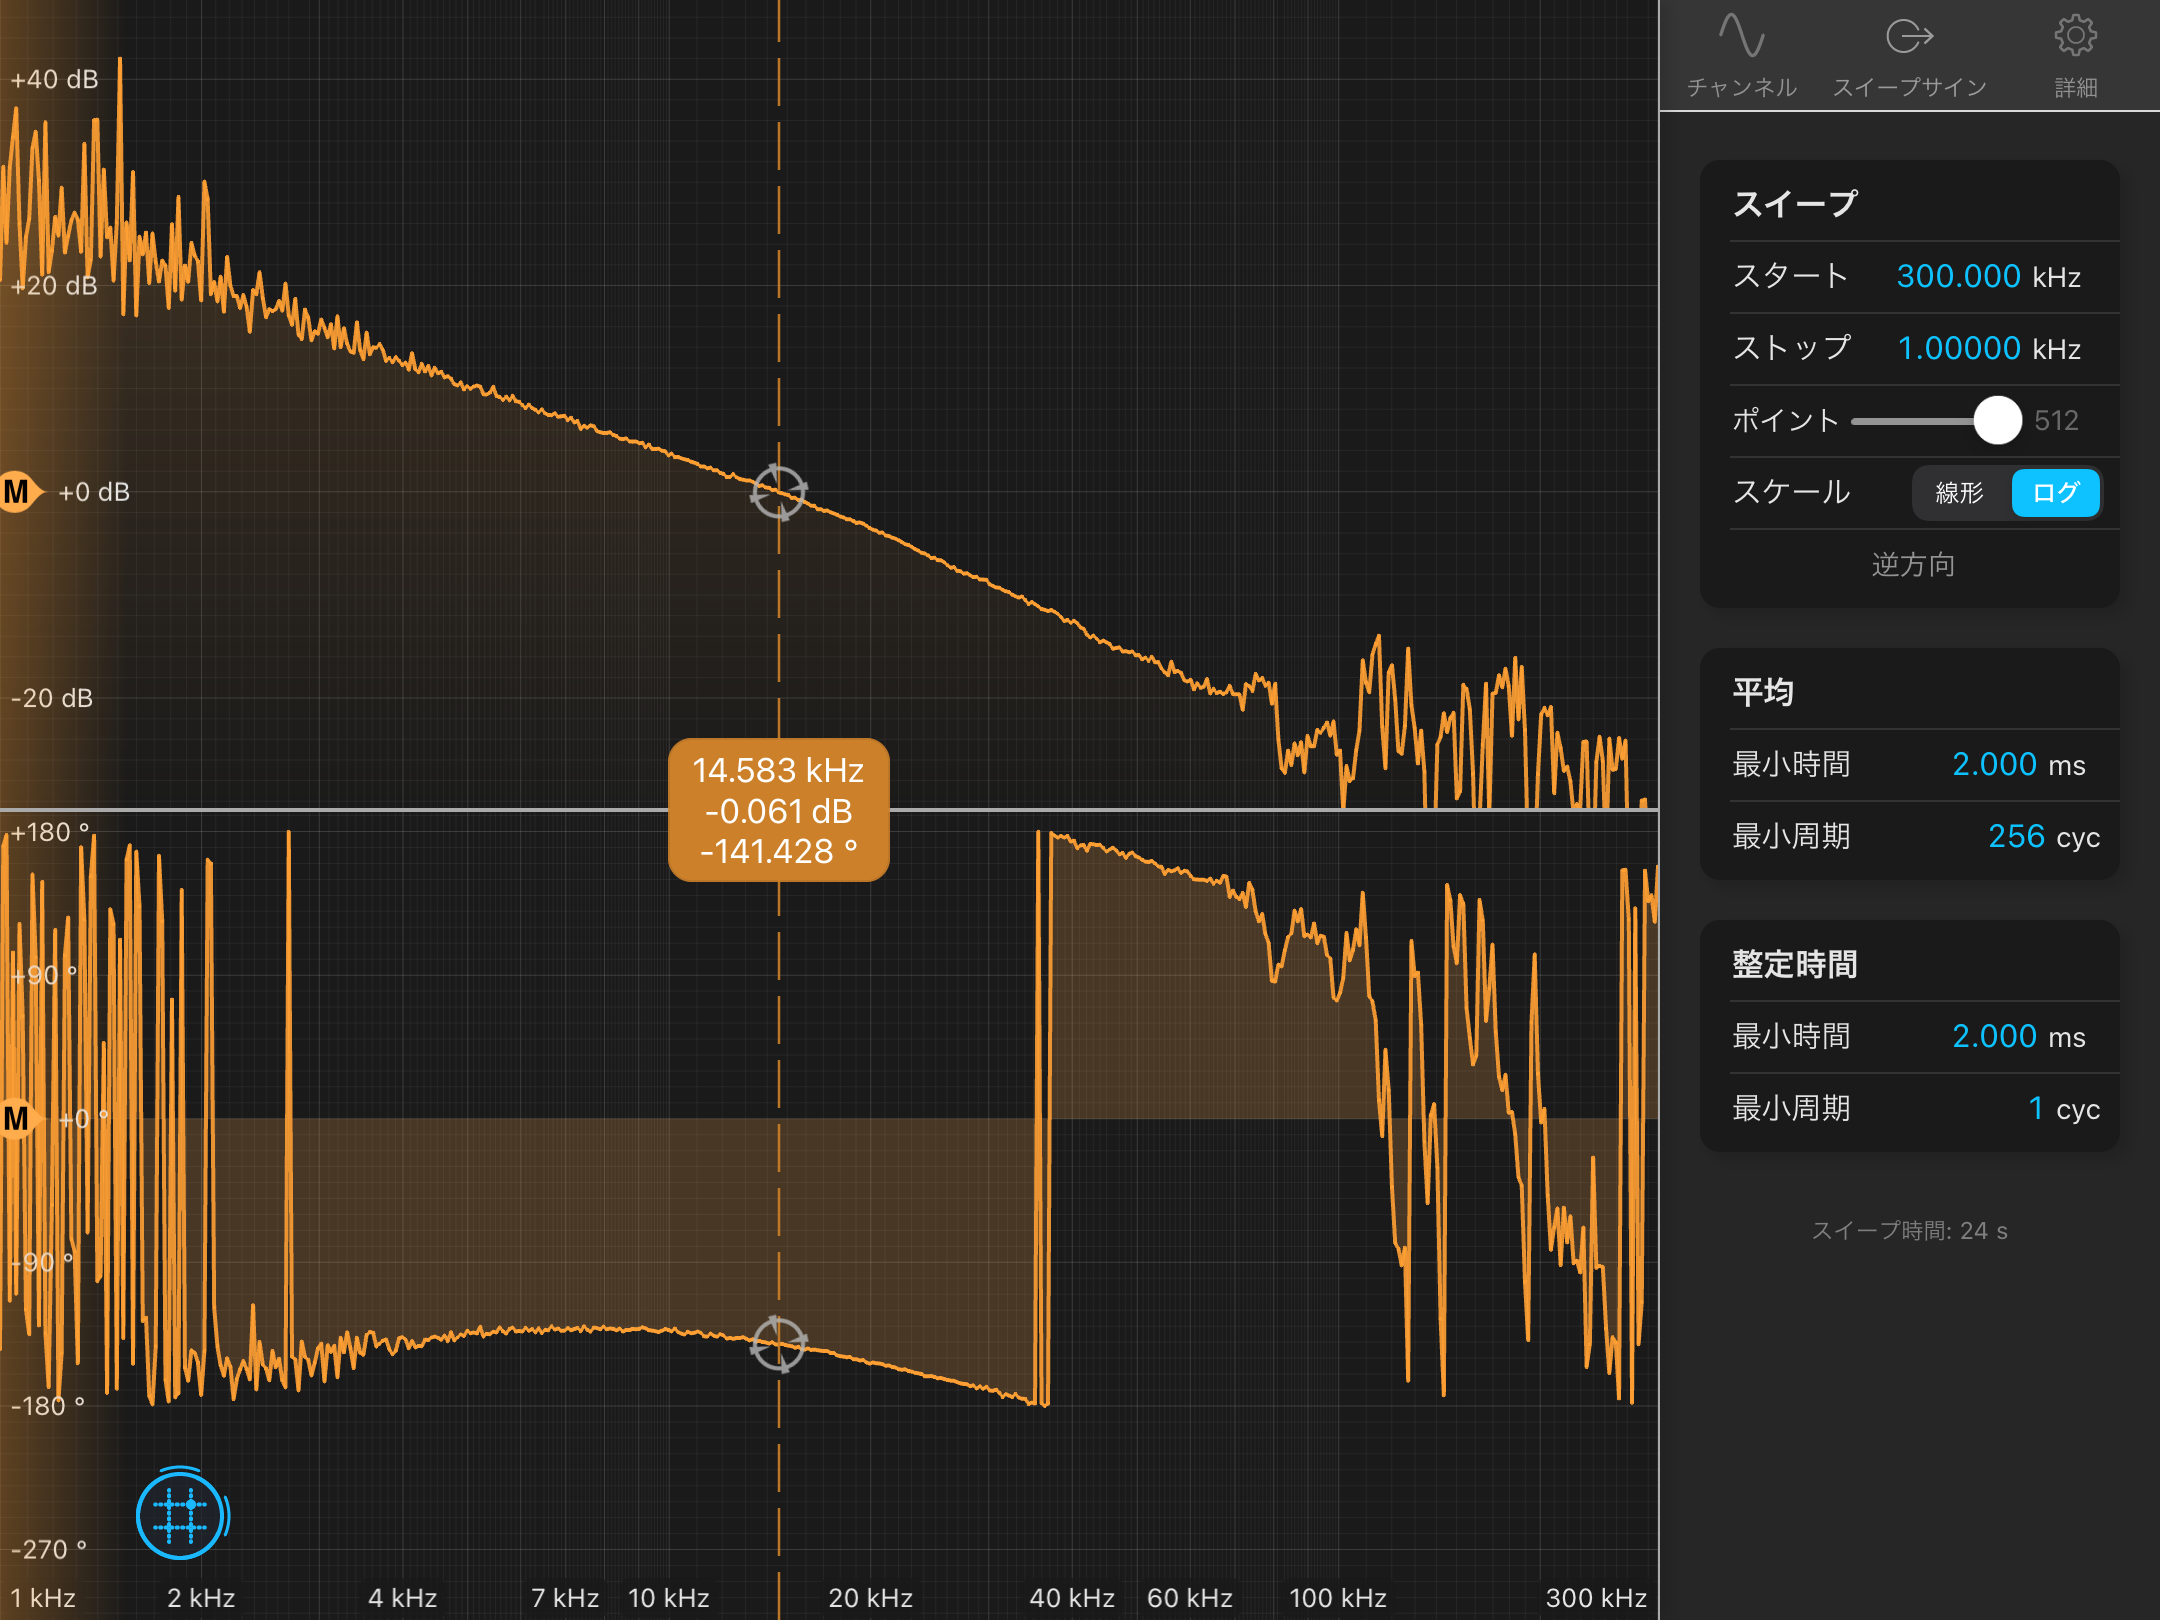
Next, we measured the transfer function of the PZT loop suppressed by the EOM loop (COF) using test1 and test2 of the IMC servo slow path [G_p/(1+G_e)](Fig.2). The UGF was approximately 14 kHz. This UGF is the crossover frequency.
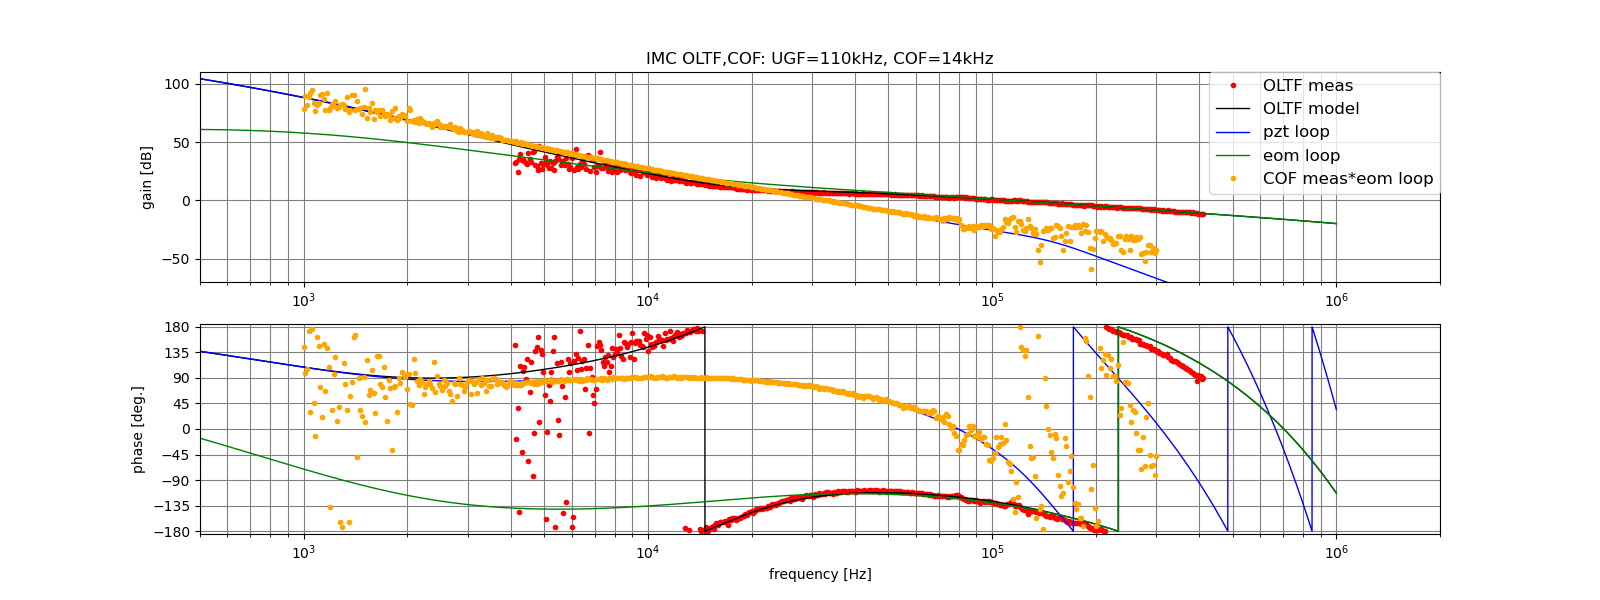
Then, using Yamamoto-san’s model(klog:29752), we created comparison plots between the measured data and the model(Fig.3). The blue line represents the PZT loop model, the green line represents the EOM loop model, the black line represents the sum of all loops, the red dots are the OLTF measurement results, and the orange dots are the COF measurement results multiplied by the EOM loop model. When the EOM loop gain is sufficiently large (G_e≫1), the orange dots represent the PZT loop.
Several parameters were changed to fit these measurements. The changes are as follows:
PZT efficiency: 4.5 MHz/V → 1.54 MHz/V (latest measurement result(klog:35884))
EOM efficiency: 0.34 rad/V → 0.12 rad/V (decreased to reflect the decrease in PZT efficiency)
CMS input gain: 1.0 → 3.0 (increased to reflect the decrease in overall gain)
In addition, although it is not included in Yamamoto-san’s model, we added 30 kHz low-pass filter in the PZT loop(klog:35340) to the PZT loop model. Furthermore, to correct the phase difference between the PZT loop model and the orange dots, we added a time delay of 2.3 μs to the PZT loop model. With these changes, the model could be fitted to the measurement results.
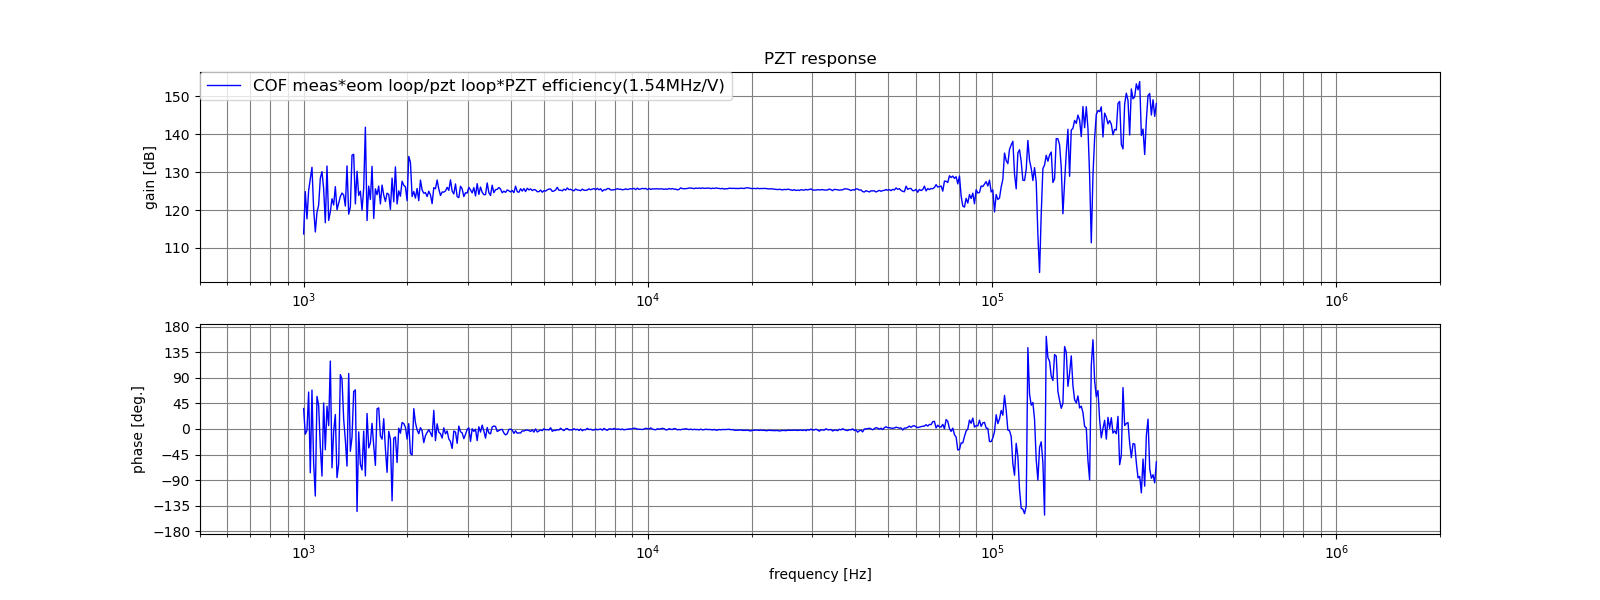
Finally, we plotted the PZT response(Fig.4). This was obtained by multiplying the COF measurement results by the EOM loop model, dividing by the PZT loop model, and then multiplying by the PZT efficiency, allowing us to observe the behavior of the PZT. Resonances can be confirmed above 80 kHz.


This is an additional measurement of the laser PZT frequency response, obtained by monitoring the error signal of the locked PMC while injecting an excitation signal to the laser PZT by Moku:Lab.
The figure shows two transfer function measurements. The darker reference line was measured with the excitation amplitude of 2mV, and the bright line was measured with 20mV.
Below a few kHz, that is the UGF of the PMC loop, the TF is suppressed by the control since it was measured at the error point, so the data is available only above several kHz. The flat area between 4kHz and 40kHz corresponds to the former measurement in klog:35884 as 1.54 MHz/V.
One clear resonance can be seen just below 100kHz, but a very complex structure can be seen above 100kHz. First, I suspected that it might be noise, so I compared the different excitation amplitudes. Noise was improved at low frequency with the large excitation, but the structure at high frequency looks the same, so this structure does not come from noise.
This shape is very similar to the previous measurement using IMC, as in this original thread klog:35917. Measurement using PMC as a monitor is a kind of very direct measurement of PZT response using an optical cavity as a monitor. So, this structure above 100kHz is unlikely to originate from measurement noise.
