Reports 1-1 of 1 Clear search Modify search
IOO (IMC)
takahiro.yamamoto - 3:13 Wednesday 05 June 2024 (29752) Print this report
Modeling IMC Open loop transfer function

Abstract

As the preparation of the paramter updates on the front-end calibration of IMC, I started to check the MC parameters in klog#29194.
Model function with latest parameters seems to match with the latest measurements same extent as the past estimation in klog#16718
Mismatch between the model and measured TF is 1-2dB around the cross over frequency of PZT and EOM.
This mismatch might be explained by more precise investigation such as a change of the optical gain in time for each measurement.
 

Details

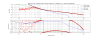
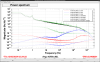
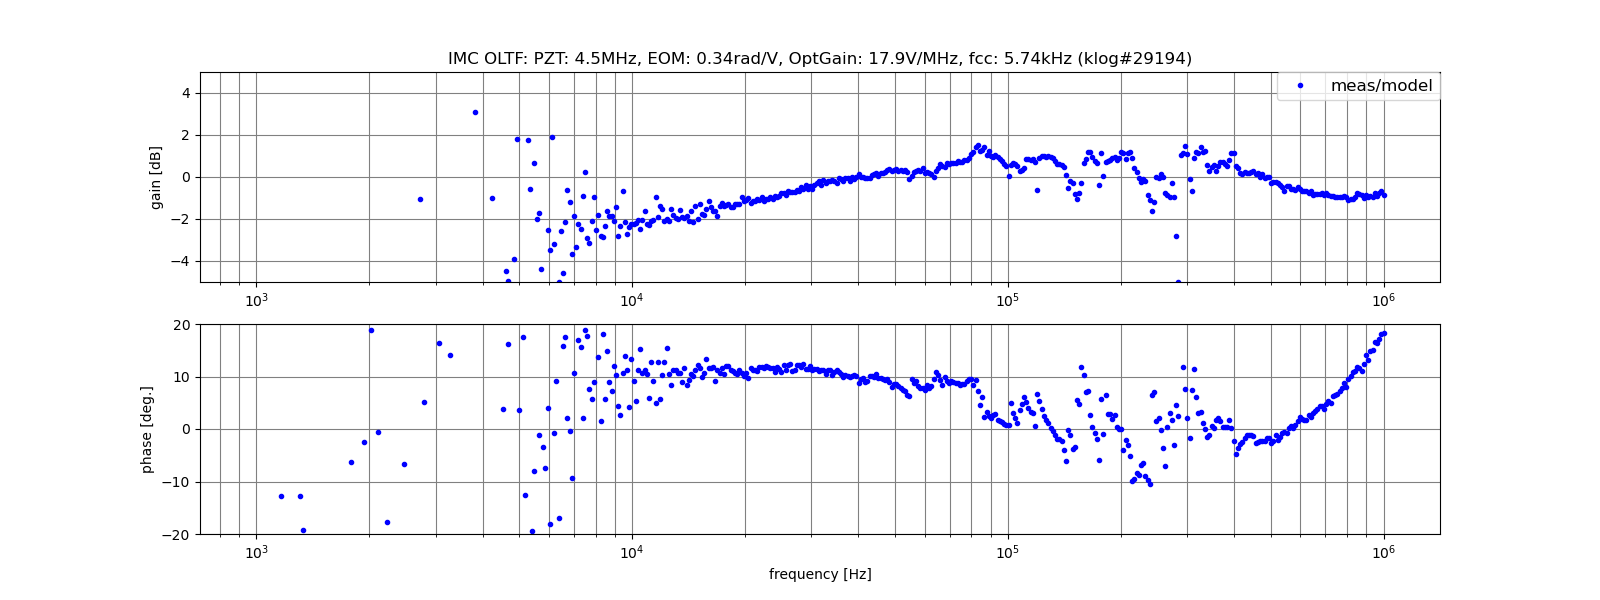
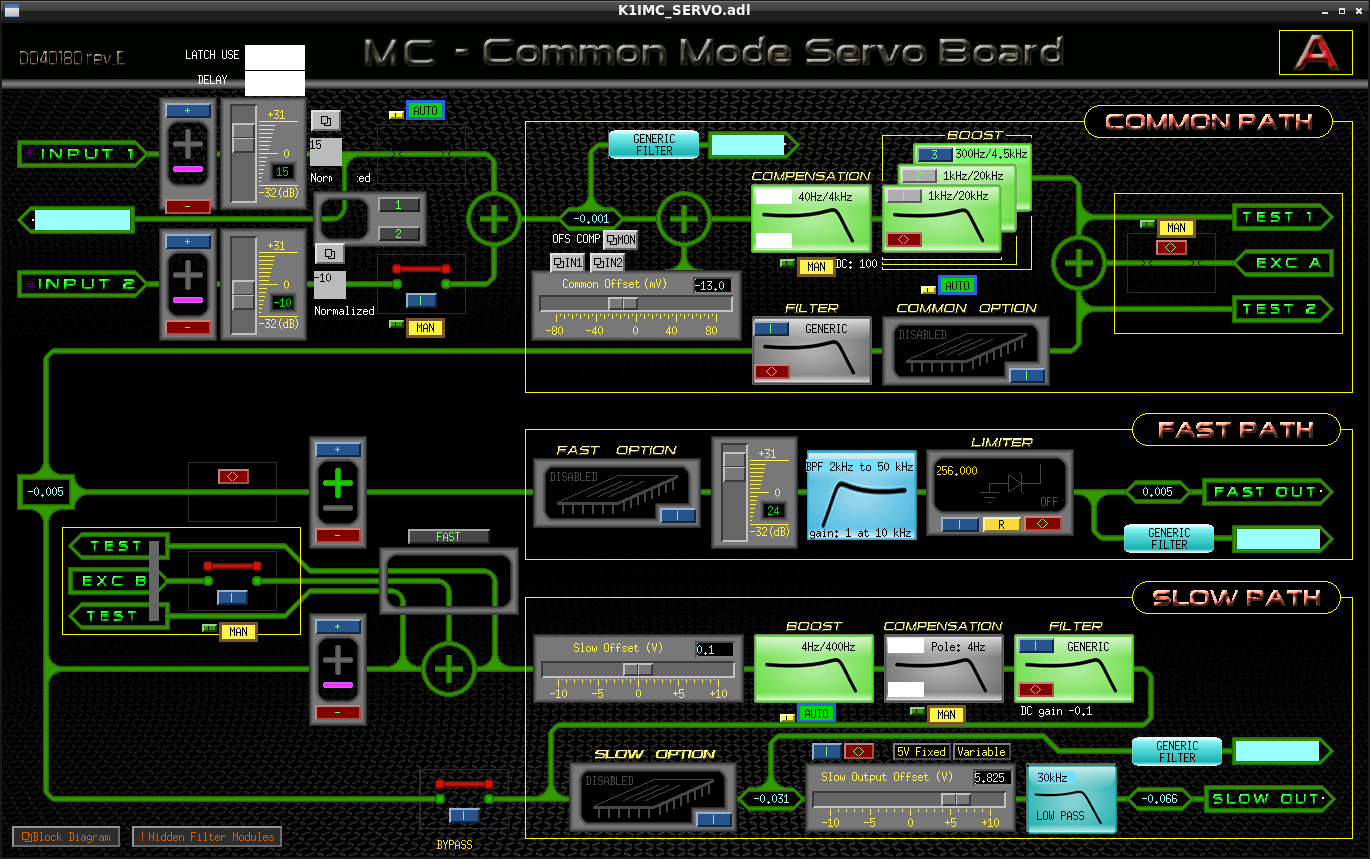
In order to confirm that OLTF model with the latest estimation of actuator efficiencies in klog#29194 can explain the latest OLTF measured in klog#29073, I made a comparison plot (Fig.1) of measured and model transfer functions. Used parameters (see also klog#29194) are as follows.
- PZT: 4.5MHz
- EOM: 0.34rad/V
- Optical gain: 17.9V/MHz
- Cavity pole: 5.74kHz

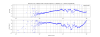
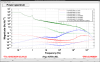
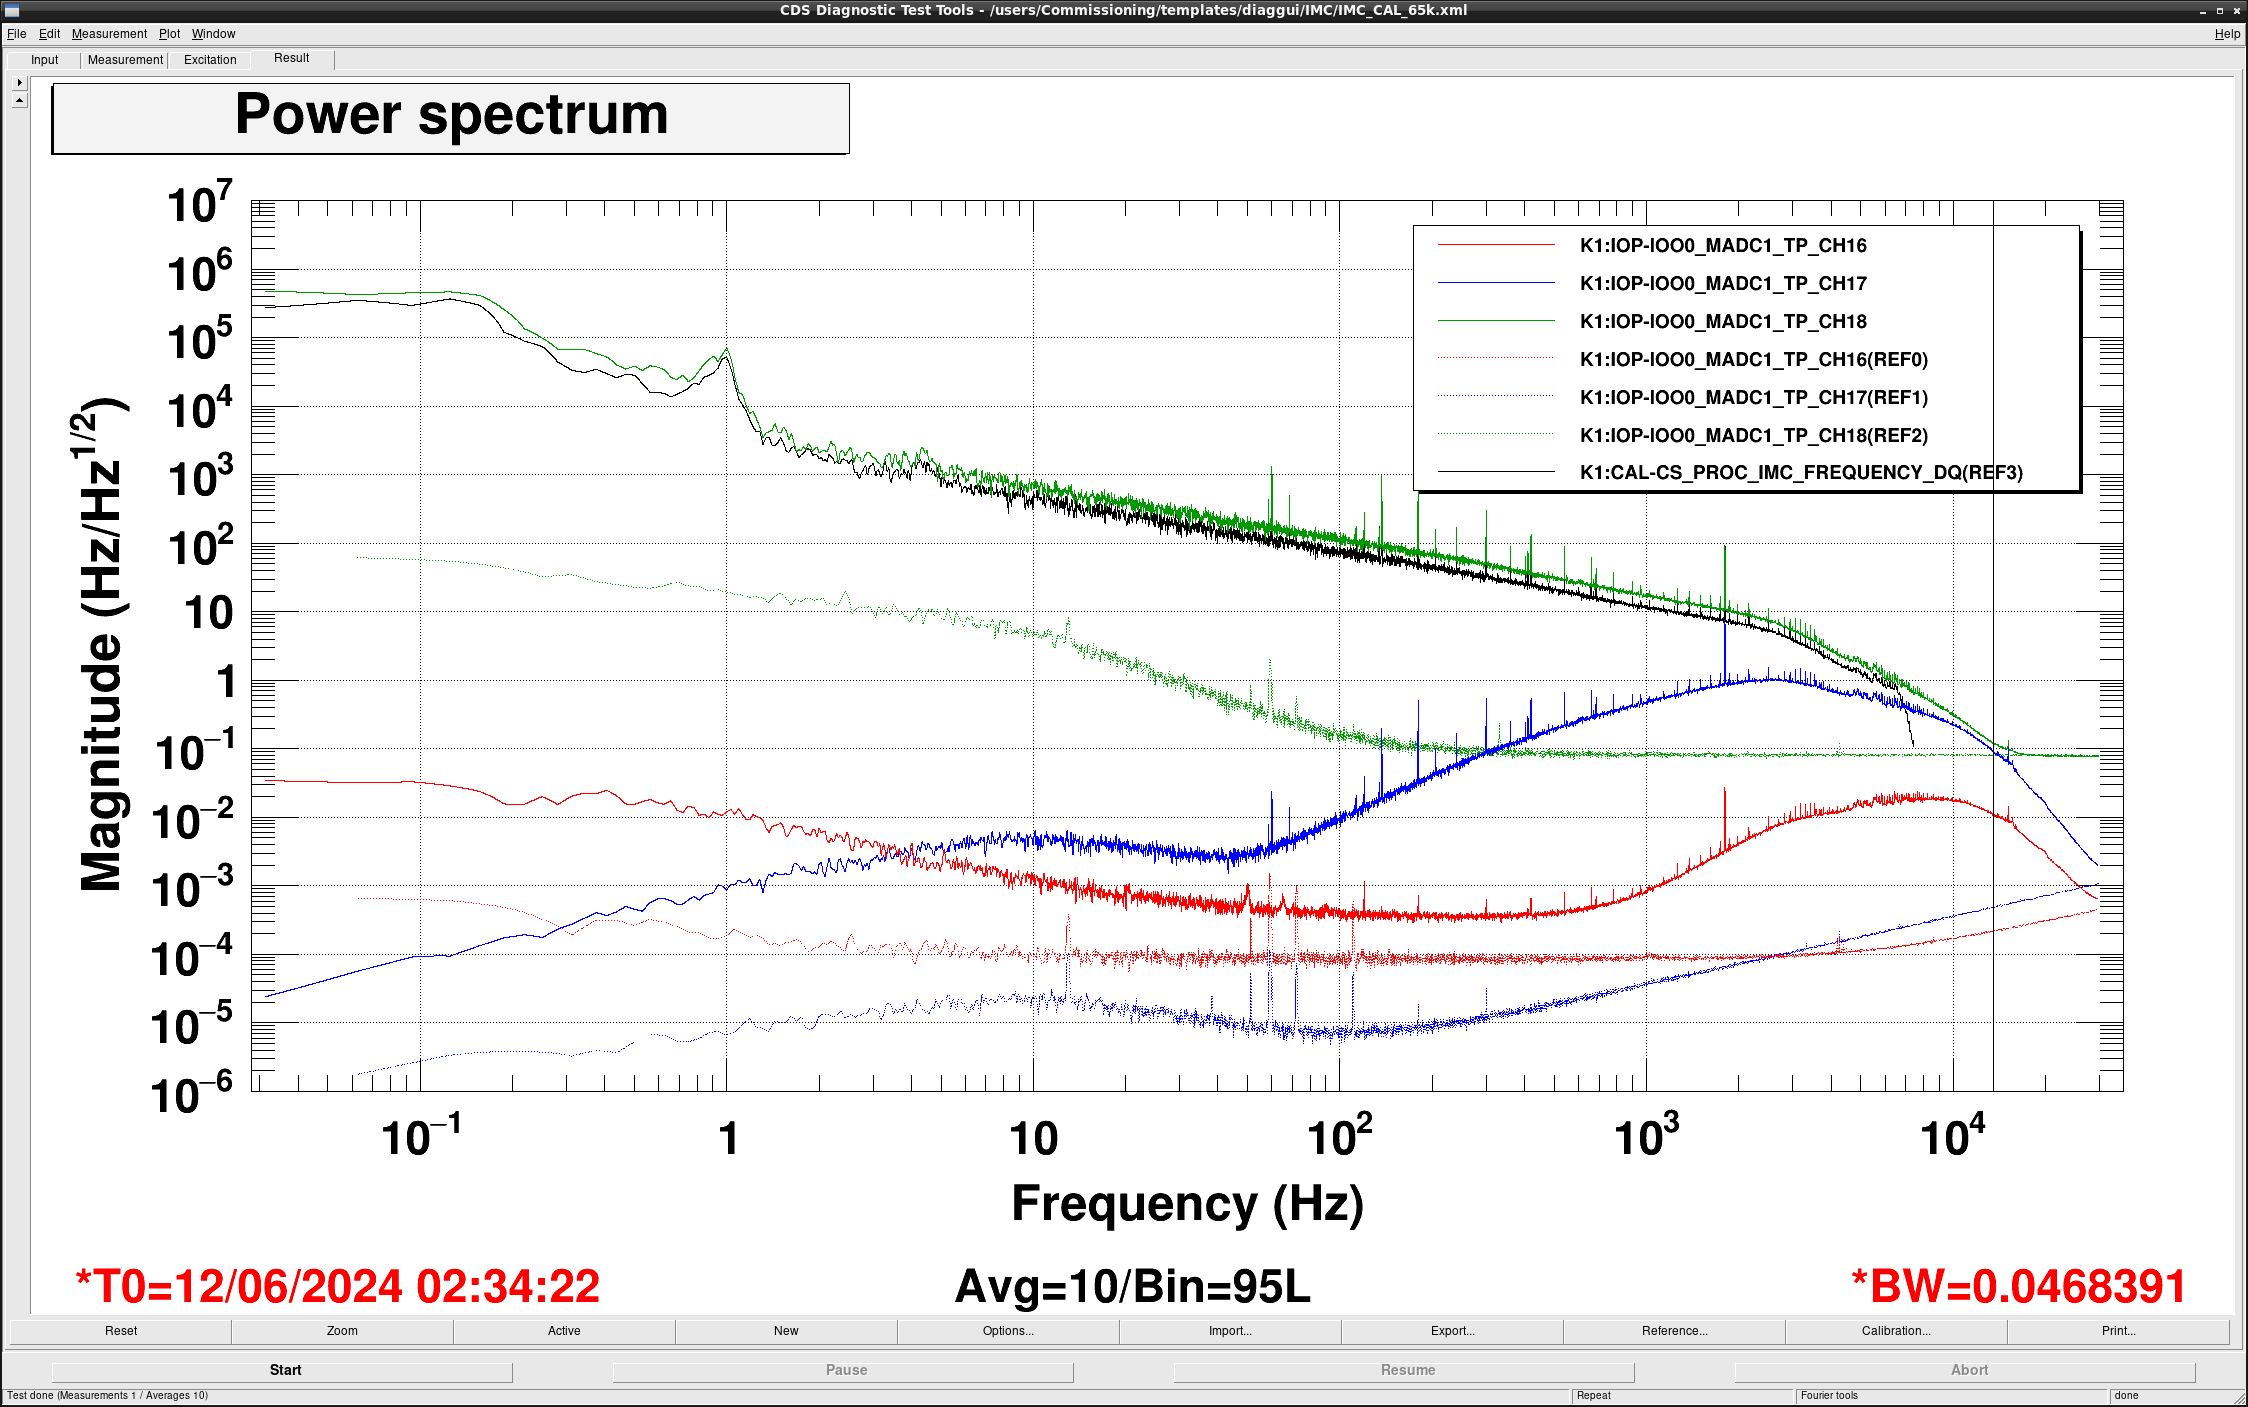
Because there is no measurement about resonant frequency and Q-value of PZT, I assumed them as f=150kHz and Q=1.3 which are the eye-fit. Catalog spec of resonant frequency is ~100kHz and PZT loop gain around 100kHz is ~10 times less than the EOM loop gain. So even if eye-fit is not so correct, this effect should be less than ~10%. According to the residual plot of measurements and model (see Fig.2), there is ~2dB mismatch around the cross over frequency. Because residual value depends on the frequency, mismatch seems to come from the bias of the actuator efficiency ratio of PZT and EOM not an overall gain.

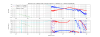
Other measurements in klog#29073, and klog#29194 which represent ratio of local loop gains are also modelized and shown in Fig.3. Mismatch on blue and cyan curves above 100kHz seems to come from ignorant about PZT resonance. One on red and pink curves around 30-40kHz seems to come from the bias of the actuator efficiency ratio same as OLTF plot. Mismatch on green curves in phase which has existed also in the past estimation in klog#16718 probably comes from ignorant about thermal pole.

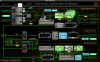
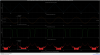
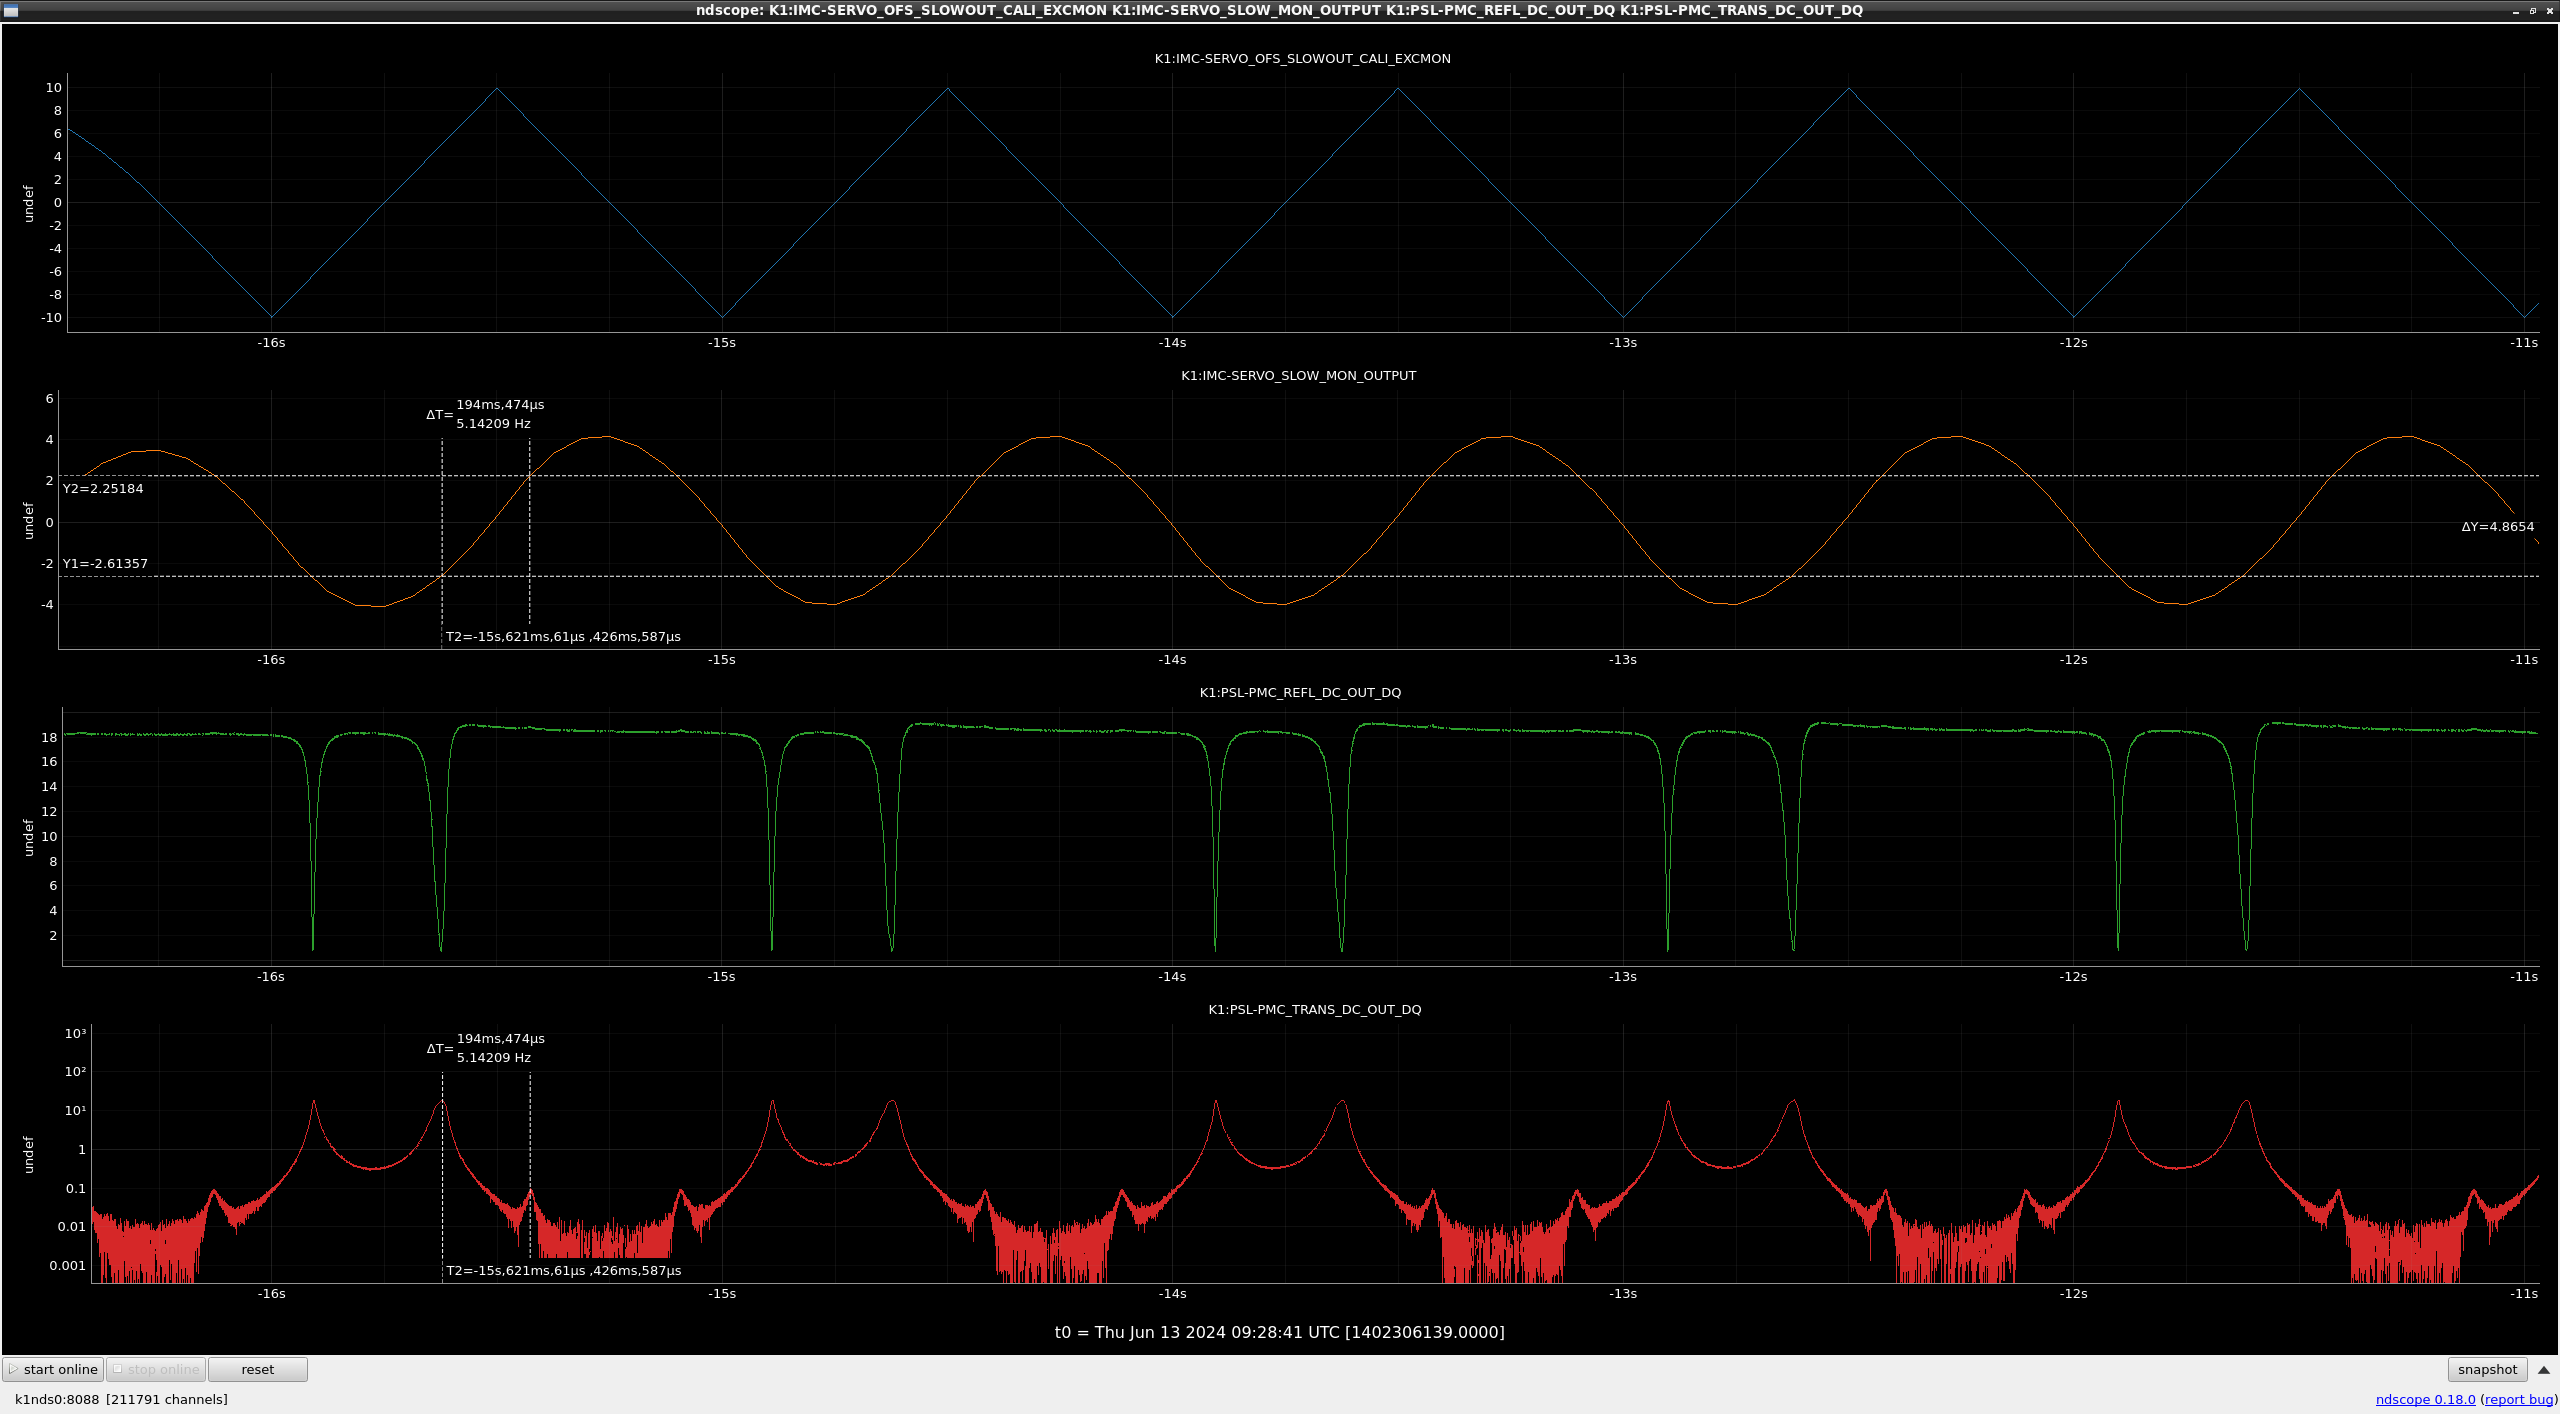
For the calibration on the digital system (below 8kHz), PZT gain (i.e. bias on the ratio of PZT and EOM gains) is an important factor. A possible cause of such a bias is a change in optical gain between measurements. So I checked some EPICS channels at the time of measuring OLTF (Fig.4) and of measuring BFs in Fig.3 (Fig.5). We can see the IN1 gain is 1dB different between two screenshots. IN1 gain is decided during the lock acquisition to keep open loop gain in my remember and it should depends on the alignment situation before starting lock acquisition. On the other hand, current IMC lock finally reaches same alignment (same optical gain) by ASC. This fact mean that final open loop gain (after calming down ASC control) may be different as the difference of IN1 gain. Though I'm not sure that measurement time for all TF measurement are recorded (especially for measurement by Moku-lab), I'll try to check the gain situation for each measurements.

Images attached to this report
Comments to this report:
takahiro.yamamoto - 2:10 Thursday 06 June 2024 (29768) Print this report

Abstract

I noticed that there was no impact on the estimation of actuator efficiency ratio of PZT and EOM by the difference on the optical gain between two measurements in klog#29194.
And also, though difference of optical gain when OLTF was measured (klog#29073) and when optical response was measured (klog#29154) made mismatch of OLTF model,
the difference of input power was small enough on these two measurements.
So I cannot find a reasonable reason of 1-2dB mismatch of OLTF model now...

Details

I checked the input laser power to IMC and IN1 gain of IMC common mode servo at the time of each measurements. Recent measurements (klog#29154, klog#29073, etc.) were done by using OUT2 as the reference of the error signal. So optical gain in these measurements contains IN1 gain of IMC common mode servo and 20dB attenuator at the IN1 port. This fact means that difference in optical gain between two measurements can be estimated as a product of pure optical response not including circuit response and IN1 gain at the time of each measurement (20dB attenuator should be stable in time). Assume that the pure optical response is proportional to the input laser power of the IMC.

Input laser power and IN1 gain at the time of measuring TF1 and TF2, 3 in klog#29194 are as follows.
Input powerIN1 gain
TF11.582W14dB
TF2&31.326W15dB
In these two measurements, optical gain is different as ~6%. But I noticed soon that these two measurements are not affected by the optical gain because open loop gain around measured frequency band (~10Hz) is large enough and 1+G can be regarded as G. So the ratio of TF2 and TF1 is
TF2 / TF1 = [ A_temp * C_imc(t=t_2) / (1 + G_imc(t=t_2)) ] / [ A_mce * C_imc(t=t_1) / (1 + G_imc(t=t_1)) ]
~ [ A_temp * C_imc(t=t_2) / G_imc(t=t_2) ] / [ A_mce * C_imc(t=t_1) / G_imc(t=t_1) ]
= [ A_temp / (F * A_total(t=t_2)) ] / [ A_mce / (F * A_total(t=t_1)) ]
= A_temp / A_mce

where I assume time variation of actuator efficiencies are smaller enough than one of optical gain.

Next, I checked the input laser power and the IN1 gain at the time of measuring OLTF (klog#29073) and optical response (klog#29154) as an another possibility. Results are as follows.
Input powerIN1 gain
OLTF1.433W15dB
Opt. response1.431W15dB
Estimated difference in the optical gain between two measurements is only ~0.2%. This difference is also insufficient to explain the mismatch in the OLTF model as 1-2dB.
takahiro.yamamoto - 13:39 Thursday 13 June 2024 (29863) Print this report

Abstract

Before updating the MC calibration on the front-end model, I made a calibrated spectra with 65kHz test points.
Difference from the current front-end calibration comes from difference in the actuator efficiency of PZT (3.0MHz/V on front-end 4.5MHz/V on offline).
(As we already knew,) we need to know the absolute value of PZT efficiency accurately, which varies largely in each measurement.
 

Details

I couldn't conclude that we can trust values in latest measurements (klog#29194) and update the front-end calibration in the posts of this thread, I made a calibrated spectra and compared with the front-end calibration. Because calibrated spectra with DAQ-ed error and feedback signals in 16kHz cannot show around the cross over frequency of PZT and EOM loop (~15kHz), I used 65kHz test points instead of {MIXER,FAST,SLOW}_DAQ_OUT_DQ.

Figure 1 shows the calibrated spectra by using the error signal (red curve), feedback signal to EOM (blue curve), feedback signal to PZT (green curve) and the front-end calibrated signal (black curve). Dashed lines represent an ADC noise level equivalent to the frequency noise. Though a strict comparison should be done with the black curve and a sum of the red, blue, and green curves, almost all frequency (0.1Hz - 15kHz) can be represented only by PZT feedback. On the other hand, PZT feedback signal is limited by the ADC noise above ~15kHz. So it's difficult to check around the cross over frequency of PZT and EOM loops even when we used 65kHz test points. Because some circuits (AA, Universal whitening filters etc.) have poles around 10kHz, seeing such high frequency region requires a modification of circuit design such as the beacon system.

In figure 2, I applied a factor of 1.5 to the calibrated spectra by the front-end calibration on diaggui to compare with calibrate PZT feedback signal and front-end calibration. In front-end calibration, PZT actuator efficiency is set as 3.0MHz/V (klog#13012). On the other hand, latest measurement is 4.5MHz/V (klog#29194. So a factor of 1.5 comes from the ratio of these two measurements. Though we can compare only below 8kHz because front-end calibration is done in 16kHz sampling, black and green curve match well. So applying latest and accurate PZT efficiency is an only remaining issue for the update of front-end calibration.

Past measurements are as follows and they have inconsistency as a factor of 3-4 in maximum. We need a measurement way that has a consistency and reproducibility. According to the discussion with Ushiba-kun, using FSR or sideband of PMC with PZT excitation may be better than past measurements.
- 1.48MHz/V klog#2853
- 3.0MHz/V klog#13012
- 5.56MHz/V klog#16678
- 4.5MHz/V klog#29194

-----
Memo
Error signal (MADC1_TP_CH16)
gain = 1 / optical_gain[V/MHz] / whitening_gain[V/V] / generic_filter[V/V] /single2diff [V/V] / ADC[ct/V]
- optical_gain = 17.9V/MHz (klog#29194)
- whitening_gain = 21dB V/V
- generic_filter = 101V/V
- single2diff = 2.0V/V
- ADC = 1638.4ct/V

pole:
- cavity_pole = 5.74kHz (klog#29193)


EOM feedback (MADC1_TP_CH17)
gain = eom_gain[rad/V] * phase2freq / single2diff[V/V] / ADC[ct/V]
- eom_gain = 0.34rad/V (klog#29194)
- phase2freq = 2*pi
- single2diff = 2.0V/V
- ADC = 1638.4ct/V

pole:
- anti-generic_filter = 10Hz, 10Hz

zero:
- anti-generic_filter = 100Hz, 100Hz
- phase to frequency = 0Hz


PZT feedback (MADC1_TP_CH18)
gain = eom_gain[rad/V] / single2diff[V/V] / ADC[ct/V]
- pzt_gain = 4.5MHz/V (klog#29194)
- single2diff = 2.0V/V
- ADC = 1638.4ct/V

pole:
- anti-generic_filter = 10Hz, 10Hz

zero:
- anti-generic_filter = 100Hz, 100Hz

Images attached to this comment
takahiro.yamamoto - 2:43 Friday 14 June 2024 (29898) Print this report

[Ushiba, Kenta, YamaT]
 

Abstract

We estimated actuator efficiency of NPRO PZT by using PMC sideband.
Estimated value is 3.018 +/- 0.037MHz/V which is consistent with 3MHz/V (klog#13012).
It may be better to check that the resonance of sideband which we think so is surely sideband not TEM10 or other higher order modes.
 

Details

Actuator efficiency of NPRO PZT was estimated from the relationship between PMC resonance and applied voltage to PZT by injecting a triangular wave from the slow offset of IMC CMS in the unlock state of PMC.

The actual injection port was K1:IMC-SERVO_OFS_SLOWOUT_CALI_EXC, from which a 1Hz triangular wave with an amplitude of 10V@DAC was injected (see also the top panel of Fig.1). The 2nd top panel of Fig.1 shows the actual applied voltage to PZT, with the amplitude and waveform is different from the excitation channel on digital system due to the resistive voltage divider (R173, R177) and RC low-pass (R173, C269, C270) at the offset port. This measurement does not assume that excitation is done at constant velocity, so the dulling of the waveform is not a problem.

Bottom two panels of Fig.1 show the REFL and TRANS PD readout. Note that the vertical axis of the TRANS PD plot is logarithmic due to the visibility of sideband resonances. We estimated the actuator efficiency of PZT by using the applied voltage to PZT at the time of the carrier and sideband resonance on the PD readout.

Detected carrier and sideband resonance are shown in the top panel of Fig.2. Though PD signal is DAQ-ed as 16kHz sampling, there is no fast channel at the downstream of the output offset port of CMS. So applied voltage to PZT at the timing of resonances was estimated by the interpolated signal of K1:IMC-SERVO_SLOW_MON_OUTPUT which was only DAQ-ed channels with 16Hz sampling at the downstream of the offset port. The averaged voltage difference at the time of adjacent carrier and sideband resonances was 4.970 +/- 0.061V. Using the PMC sideband frequency of 15 MHz, the PZT efficiency is derived to be 3.018+/-0.037MHz/V. This value is consistent with 3MHz/V in klog#13012. (Strictly speaking, the value in klog#13012 is 4.2*10^(17/20)=2.973... and it doesn't match by 1-sigma. On the other hand, considering the fact that only statistical errors were taken into account in our estimation and errors of the past measurement are unknown, it is probably okey to assume that two estimations are consistent each other.)

Kenta advised that we might want to make sure that sideband resonances we think are not higher-order mode resonances. We don't actually do such checks, so we should keep that in mind. It would be possible to see the the higher modes by shifting the PMC alignment and making the same measurement with the higher modes more likely to appear. But that would mean touching the picomotor at the input path of PMC. If we will do, we should discuss somewhere.

Images attached to this comment
takahiro.yamamoto - 19:23 Saturday 15 June 2024 (29923) Print this report
The analysis script used in the previous post in this thread is put in /users/Commissioning/scripts/NPRO_PZT_calibration/ (see also README in same directory).

I'm not sure same measurement will be done in the future, this script probably helps future calibration of IMC/CARM.
If the injection waveform including frequency, amplitude, etc. is changed, we may need to rewrite some parameters for the peak detection.
But it should work robustly with same injection parameters in README (10Vpp, 1Hz, triangle from K1:IMC-SERVO_OFS_SLOWOUT_CALI_EXC).
Search Help
×

Warning

×