Reports 1-1 of 1 Clear search Modify search
MIF (General)
shinji.miyoki - 7:24 Wednesday 30 April 2025 (33601) Print this report
Blasting of Tunnel construction unlocked IFO

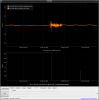
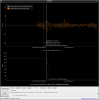
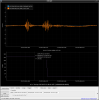
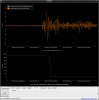
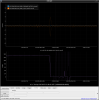
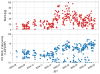
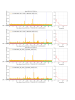
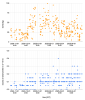
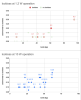
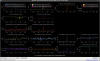
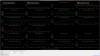
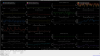
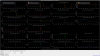
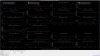
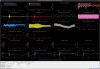
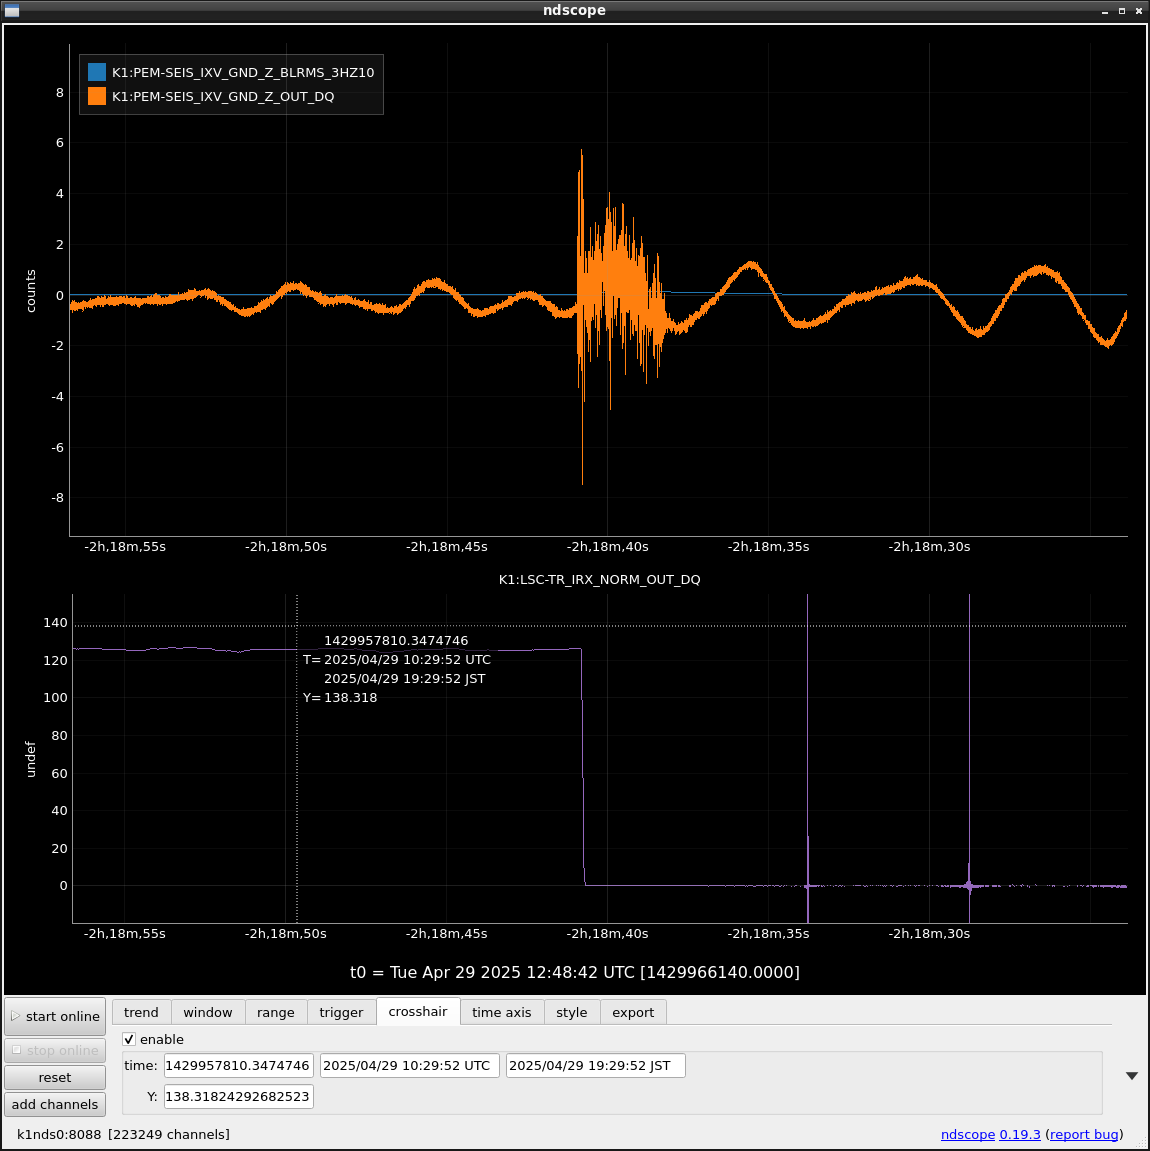
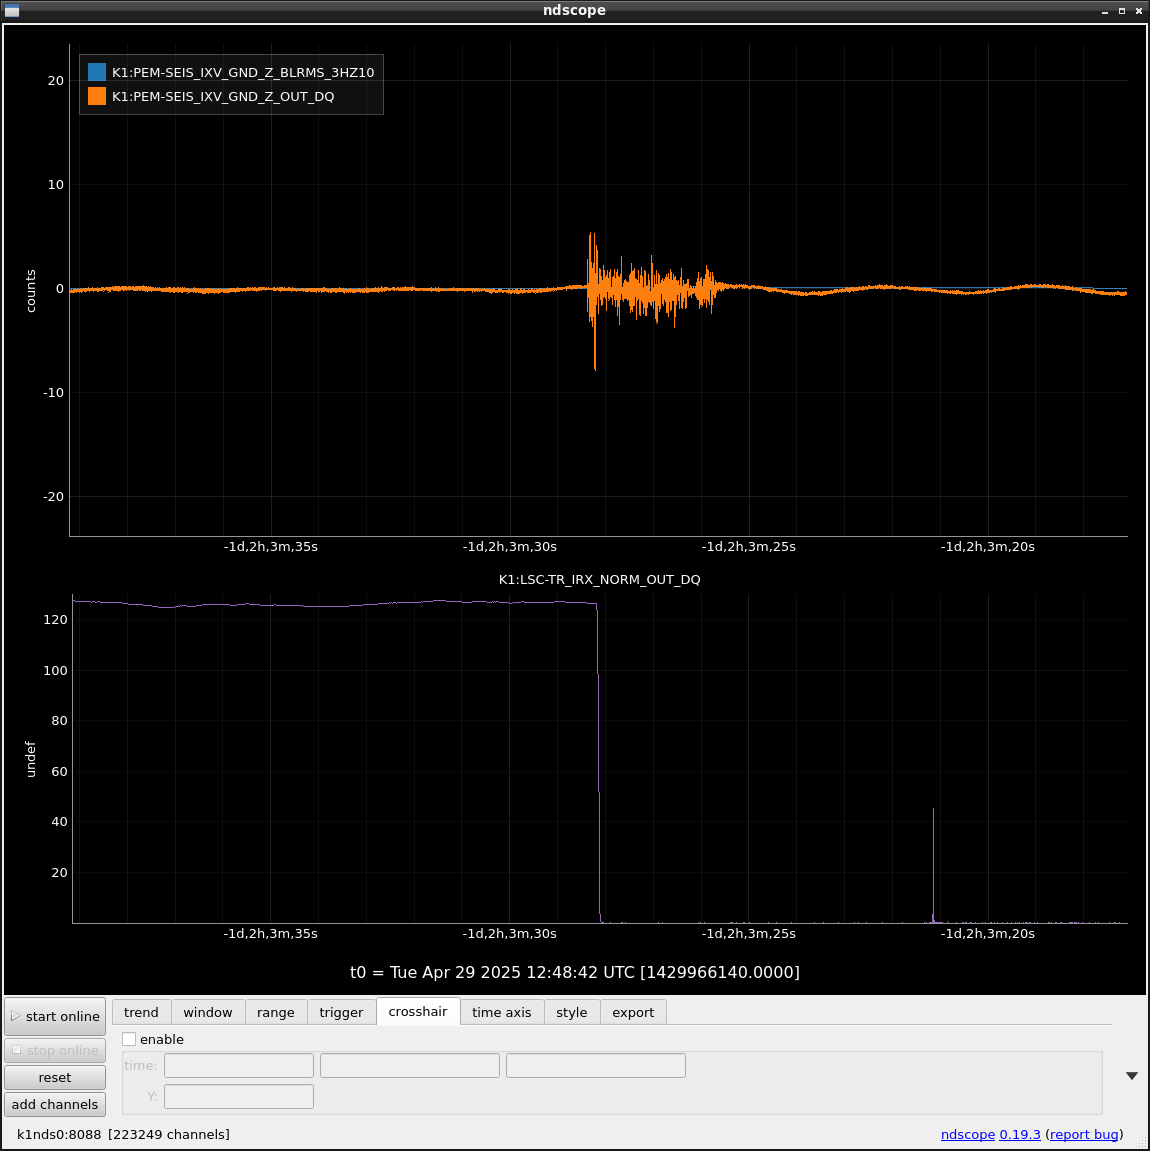
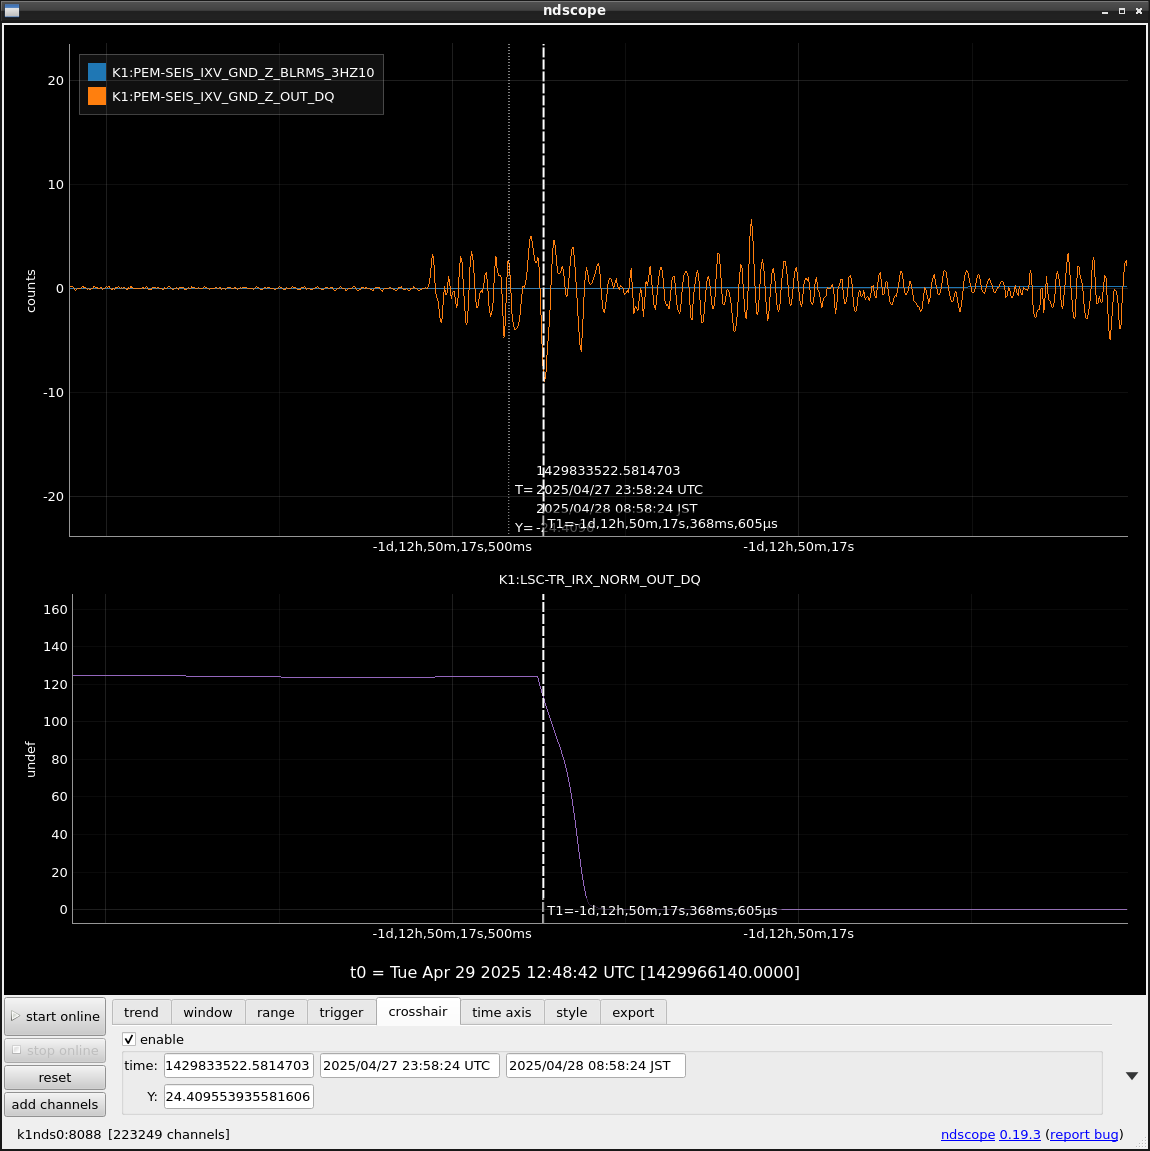
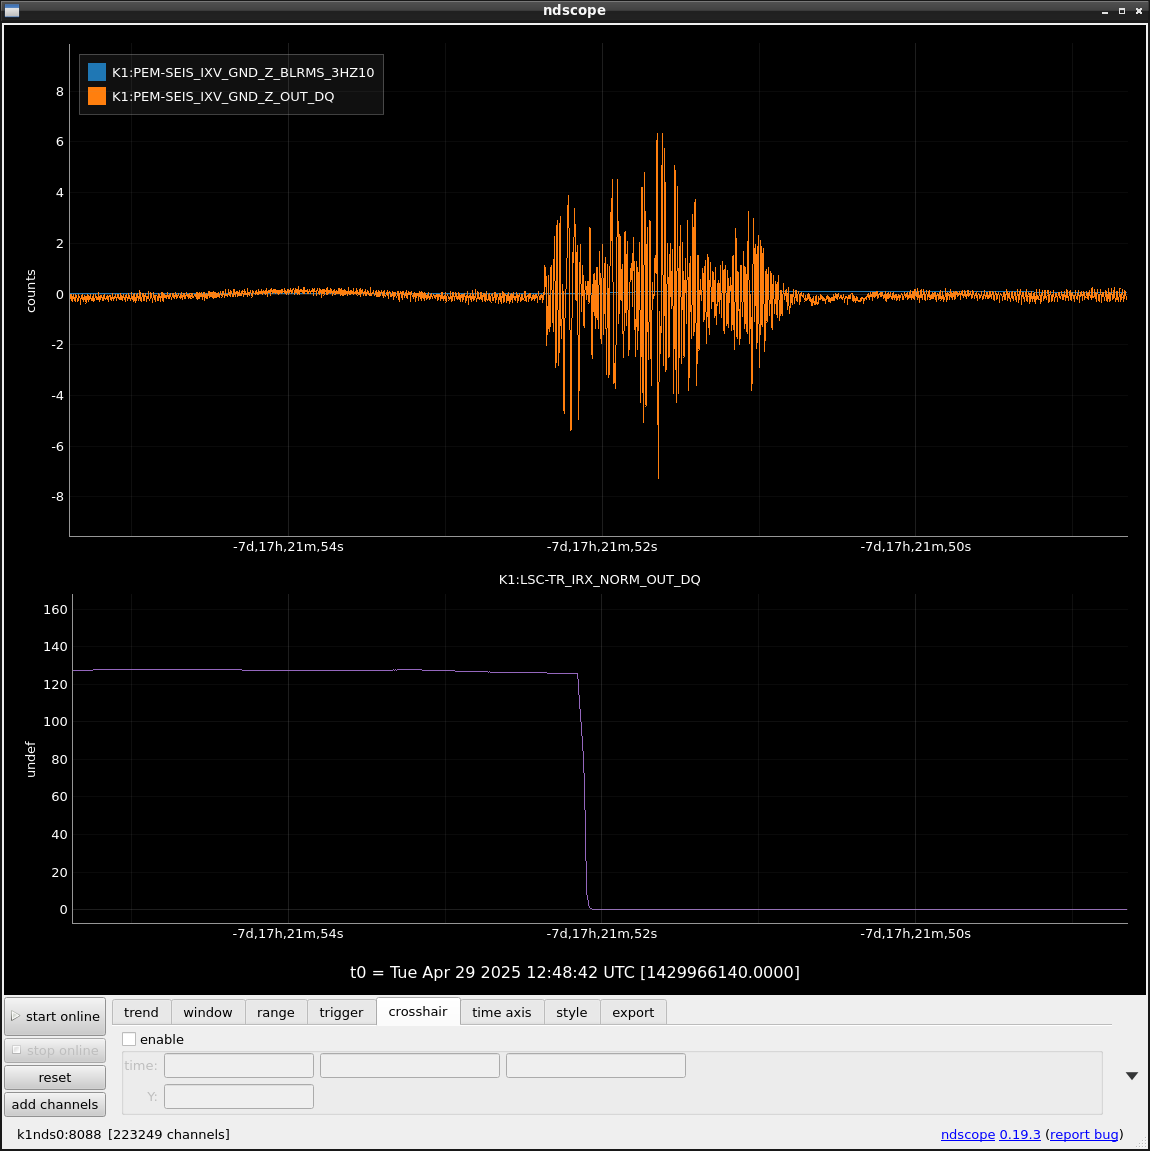
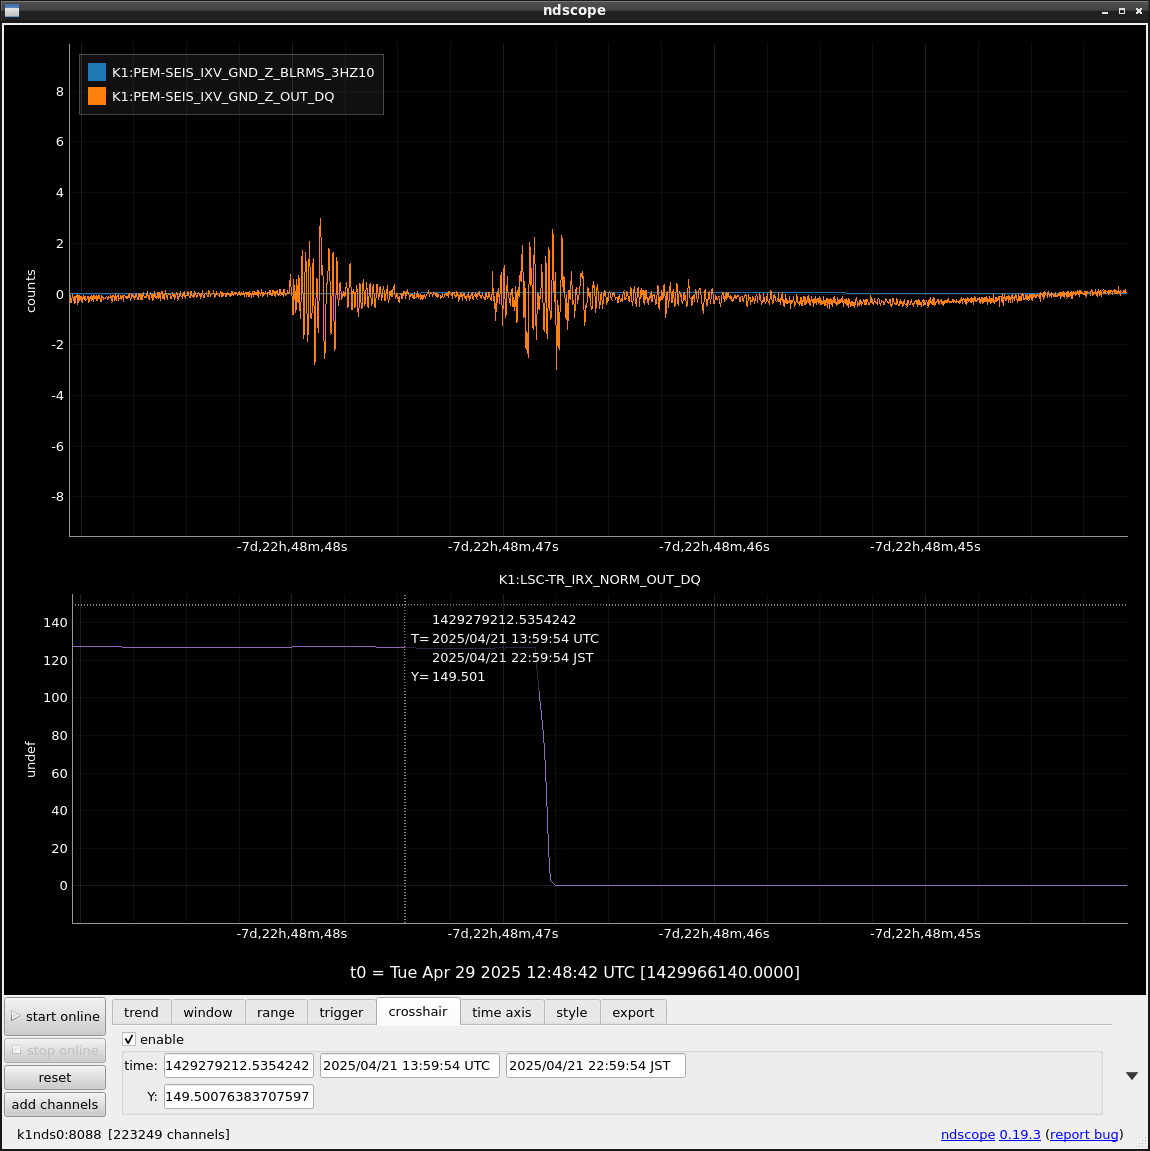
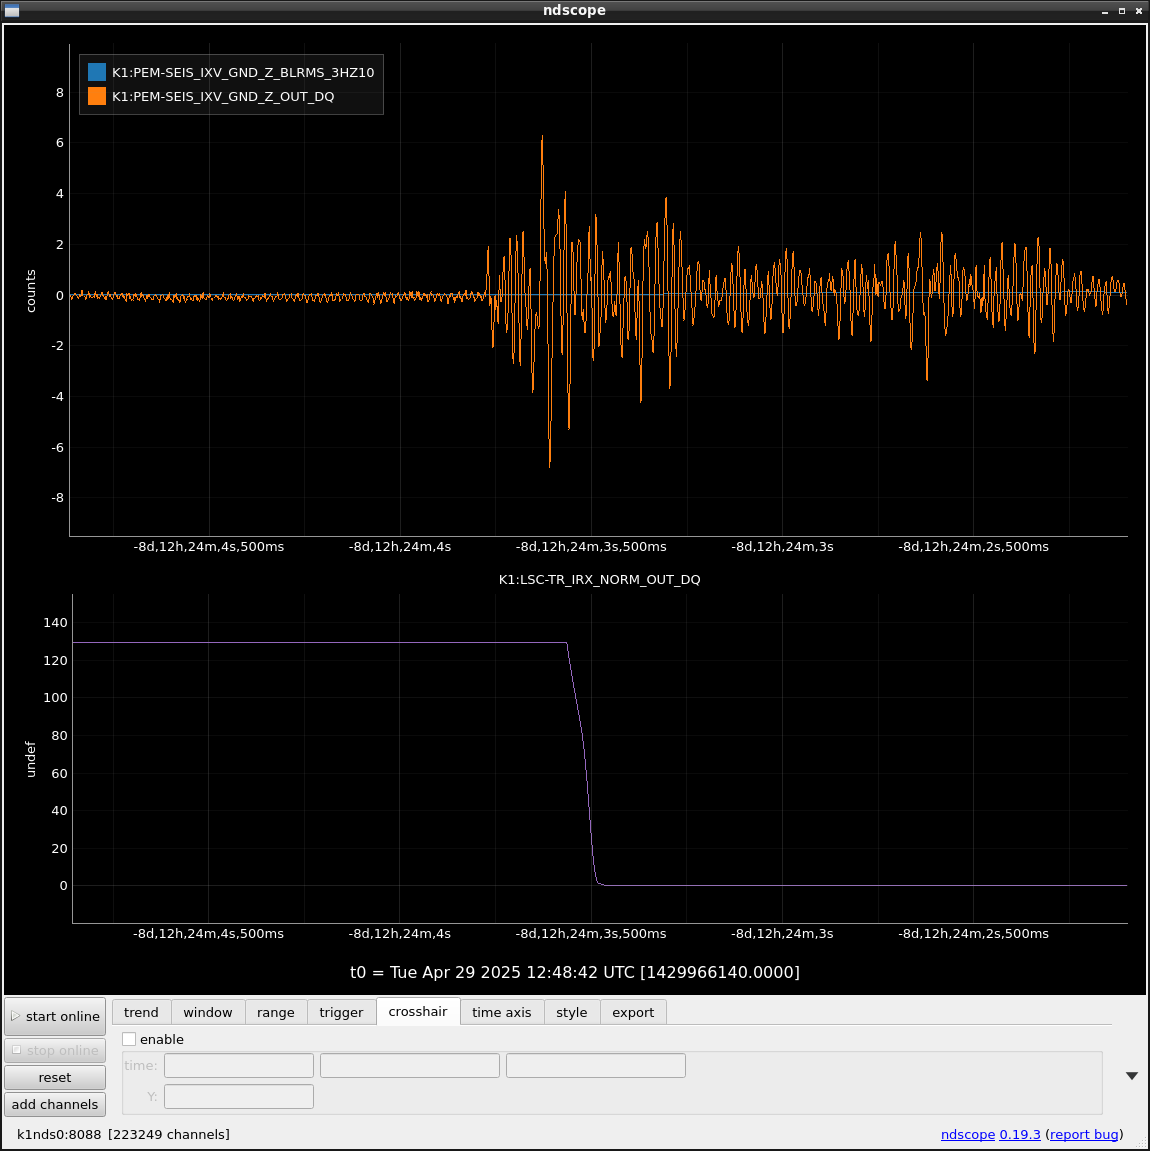
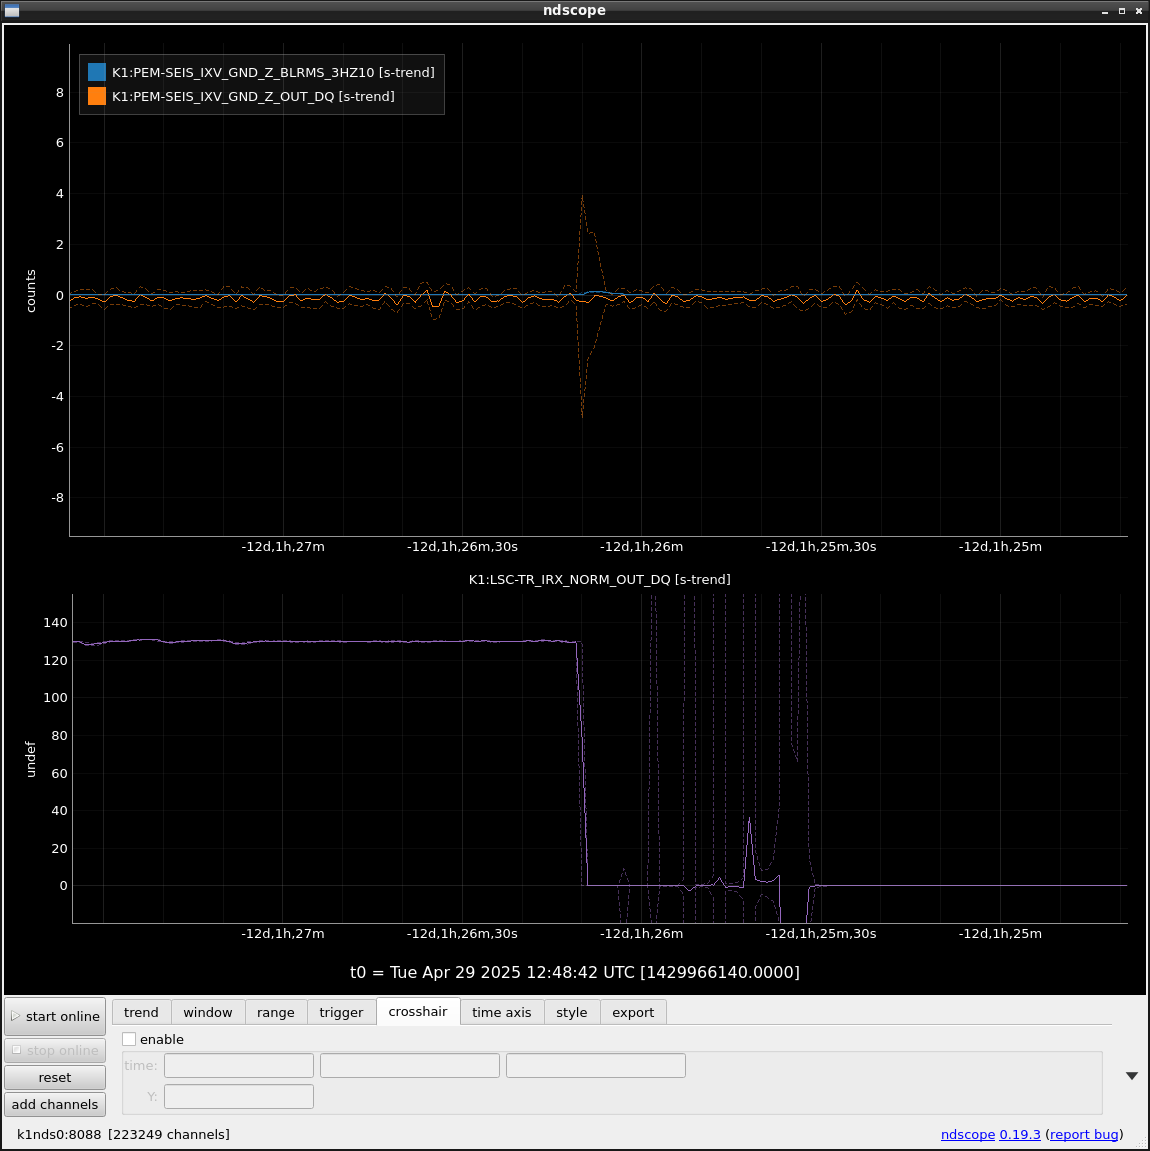
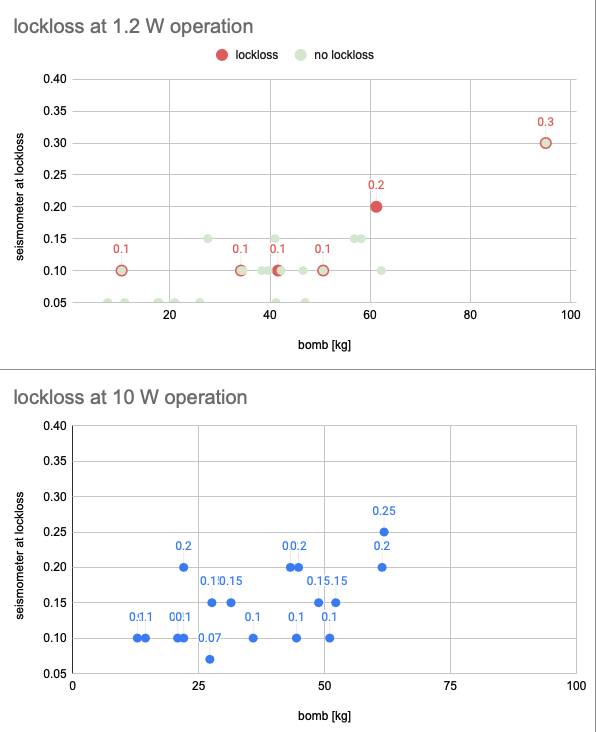
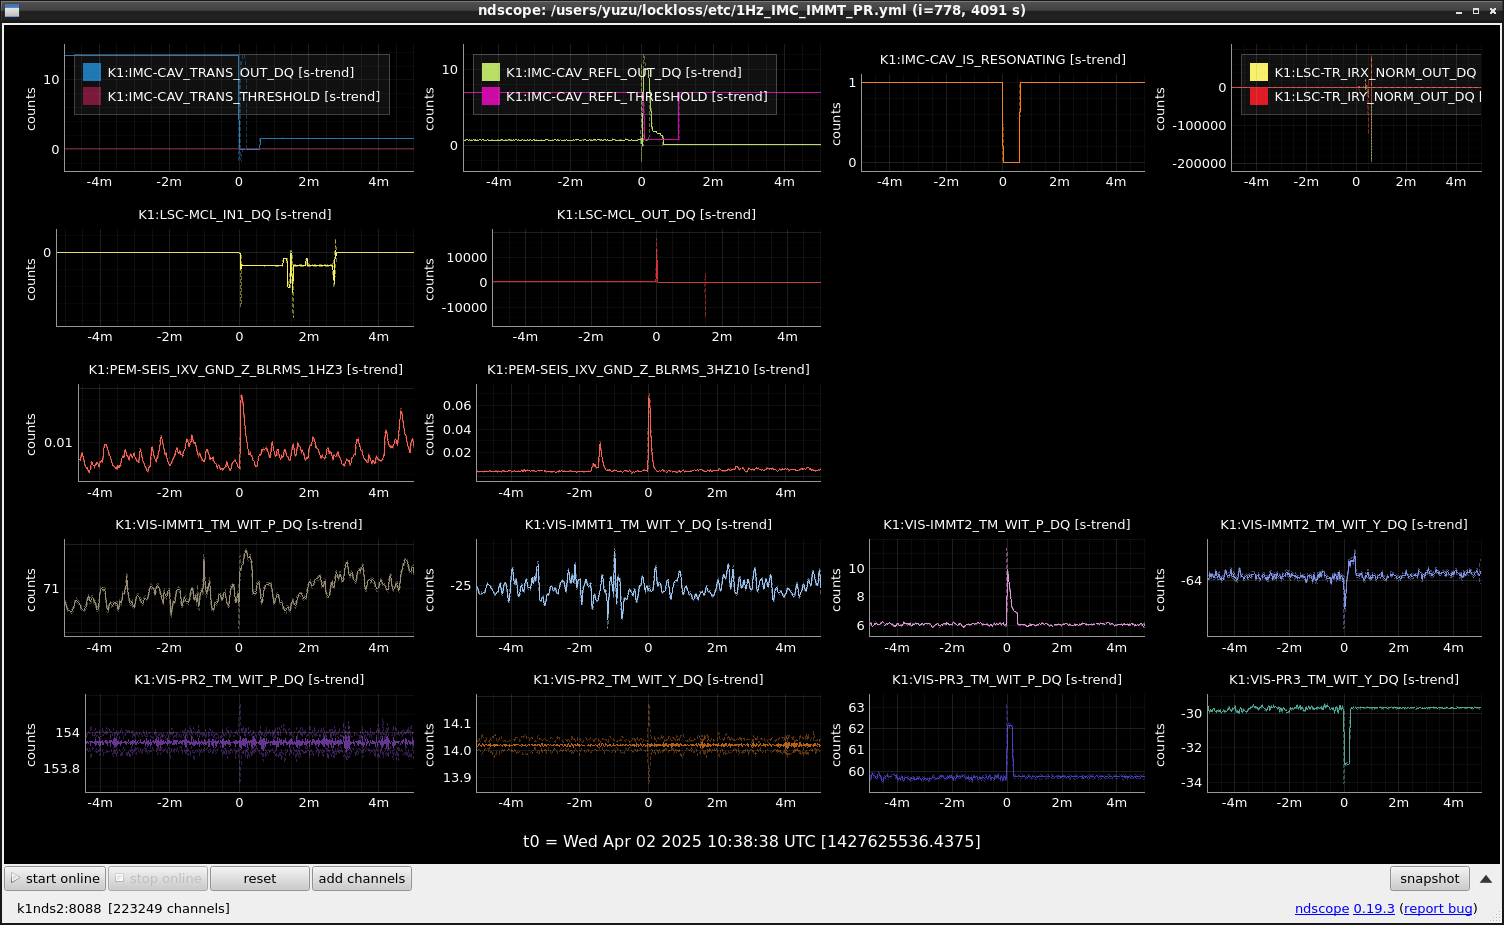
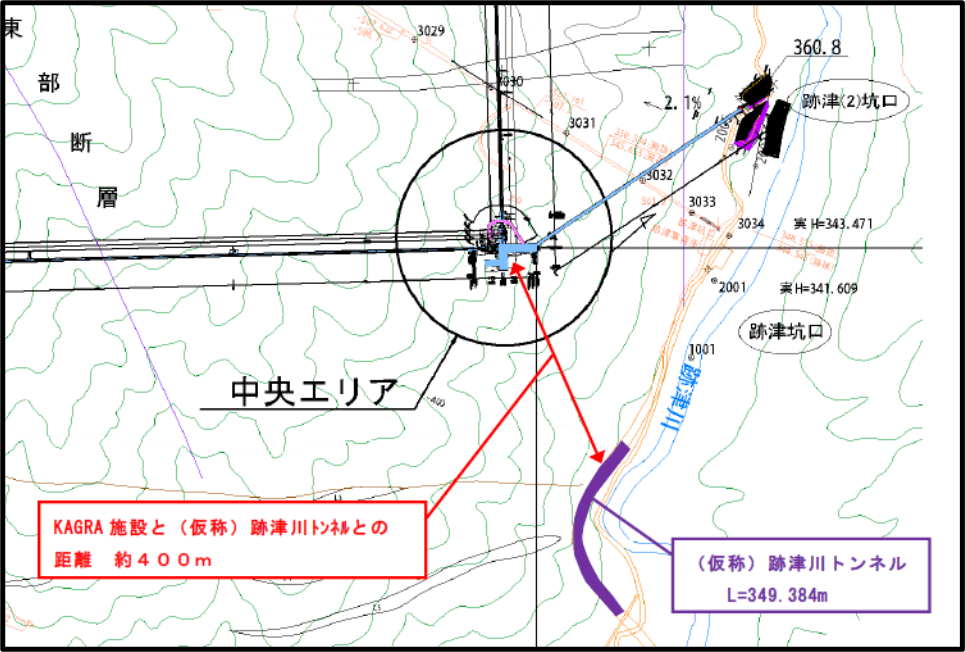
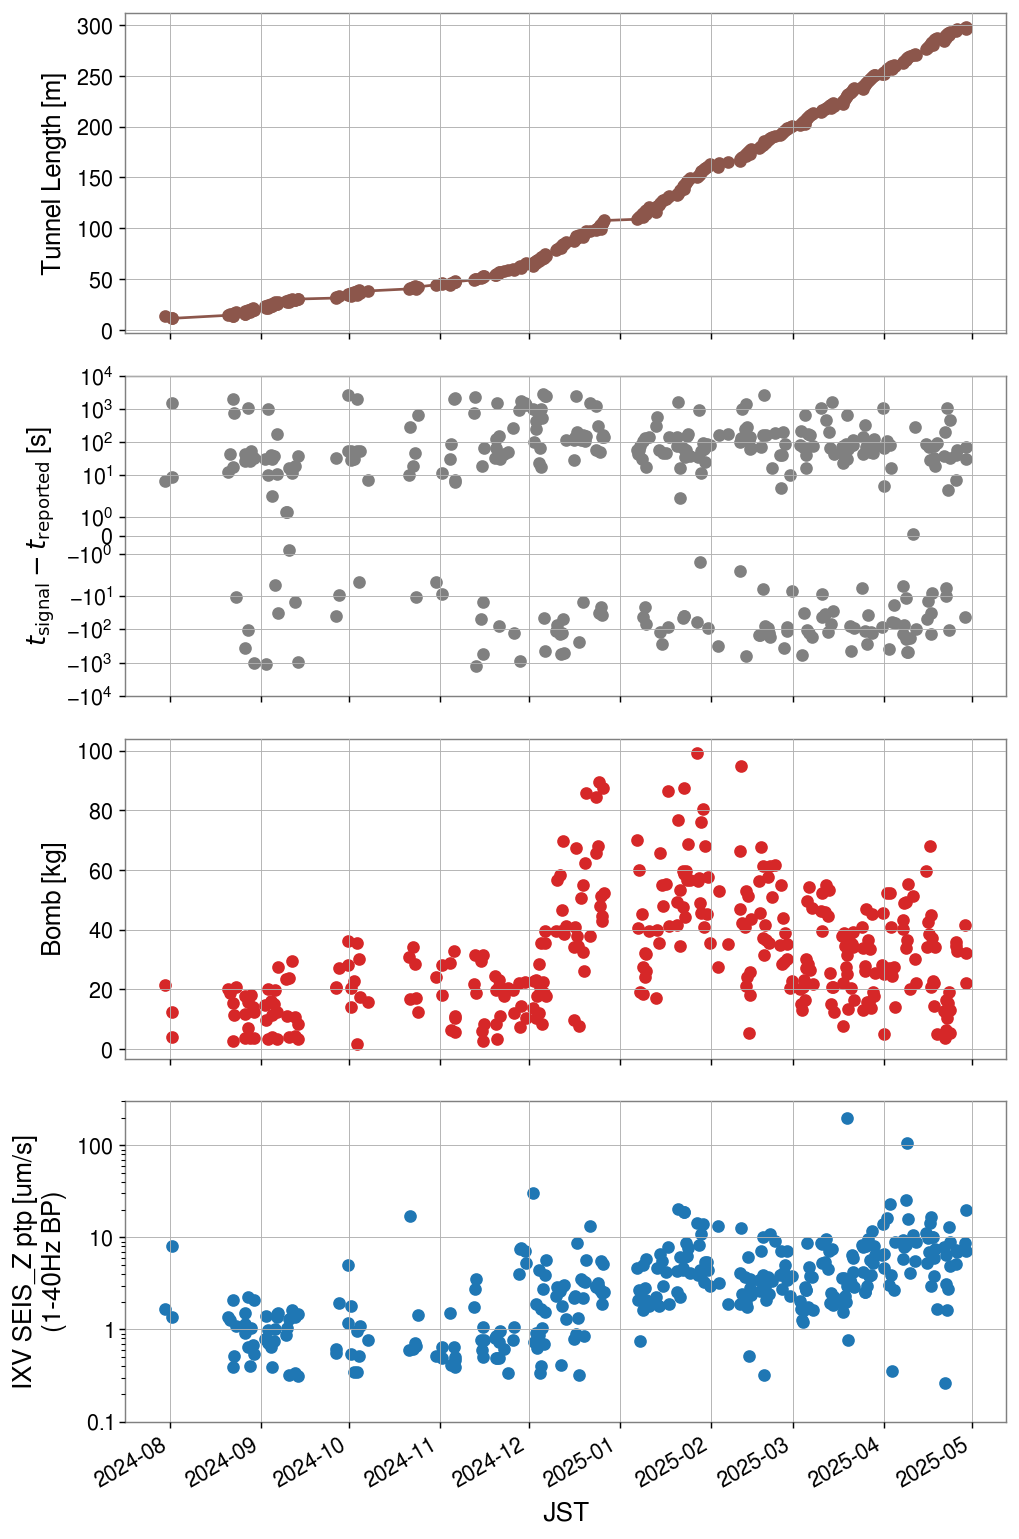
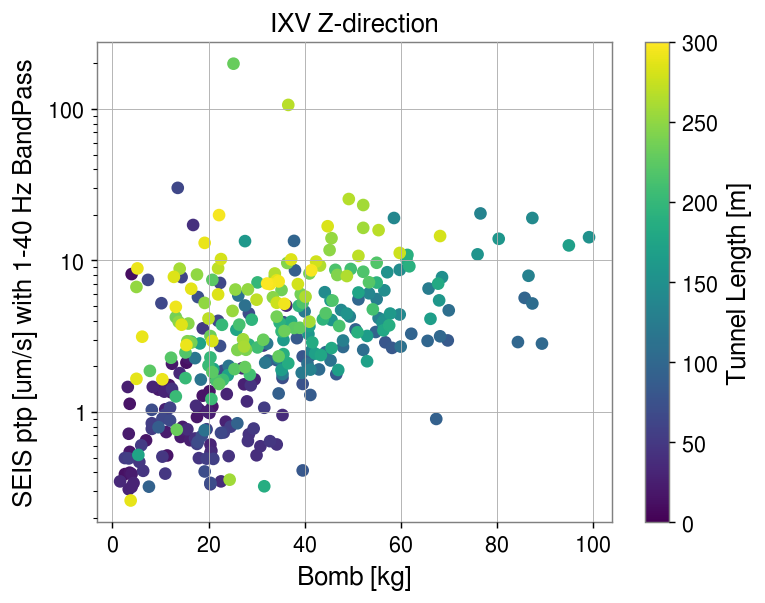
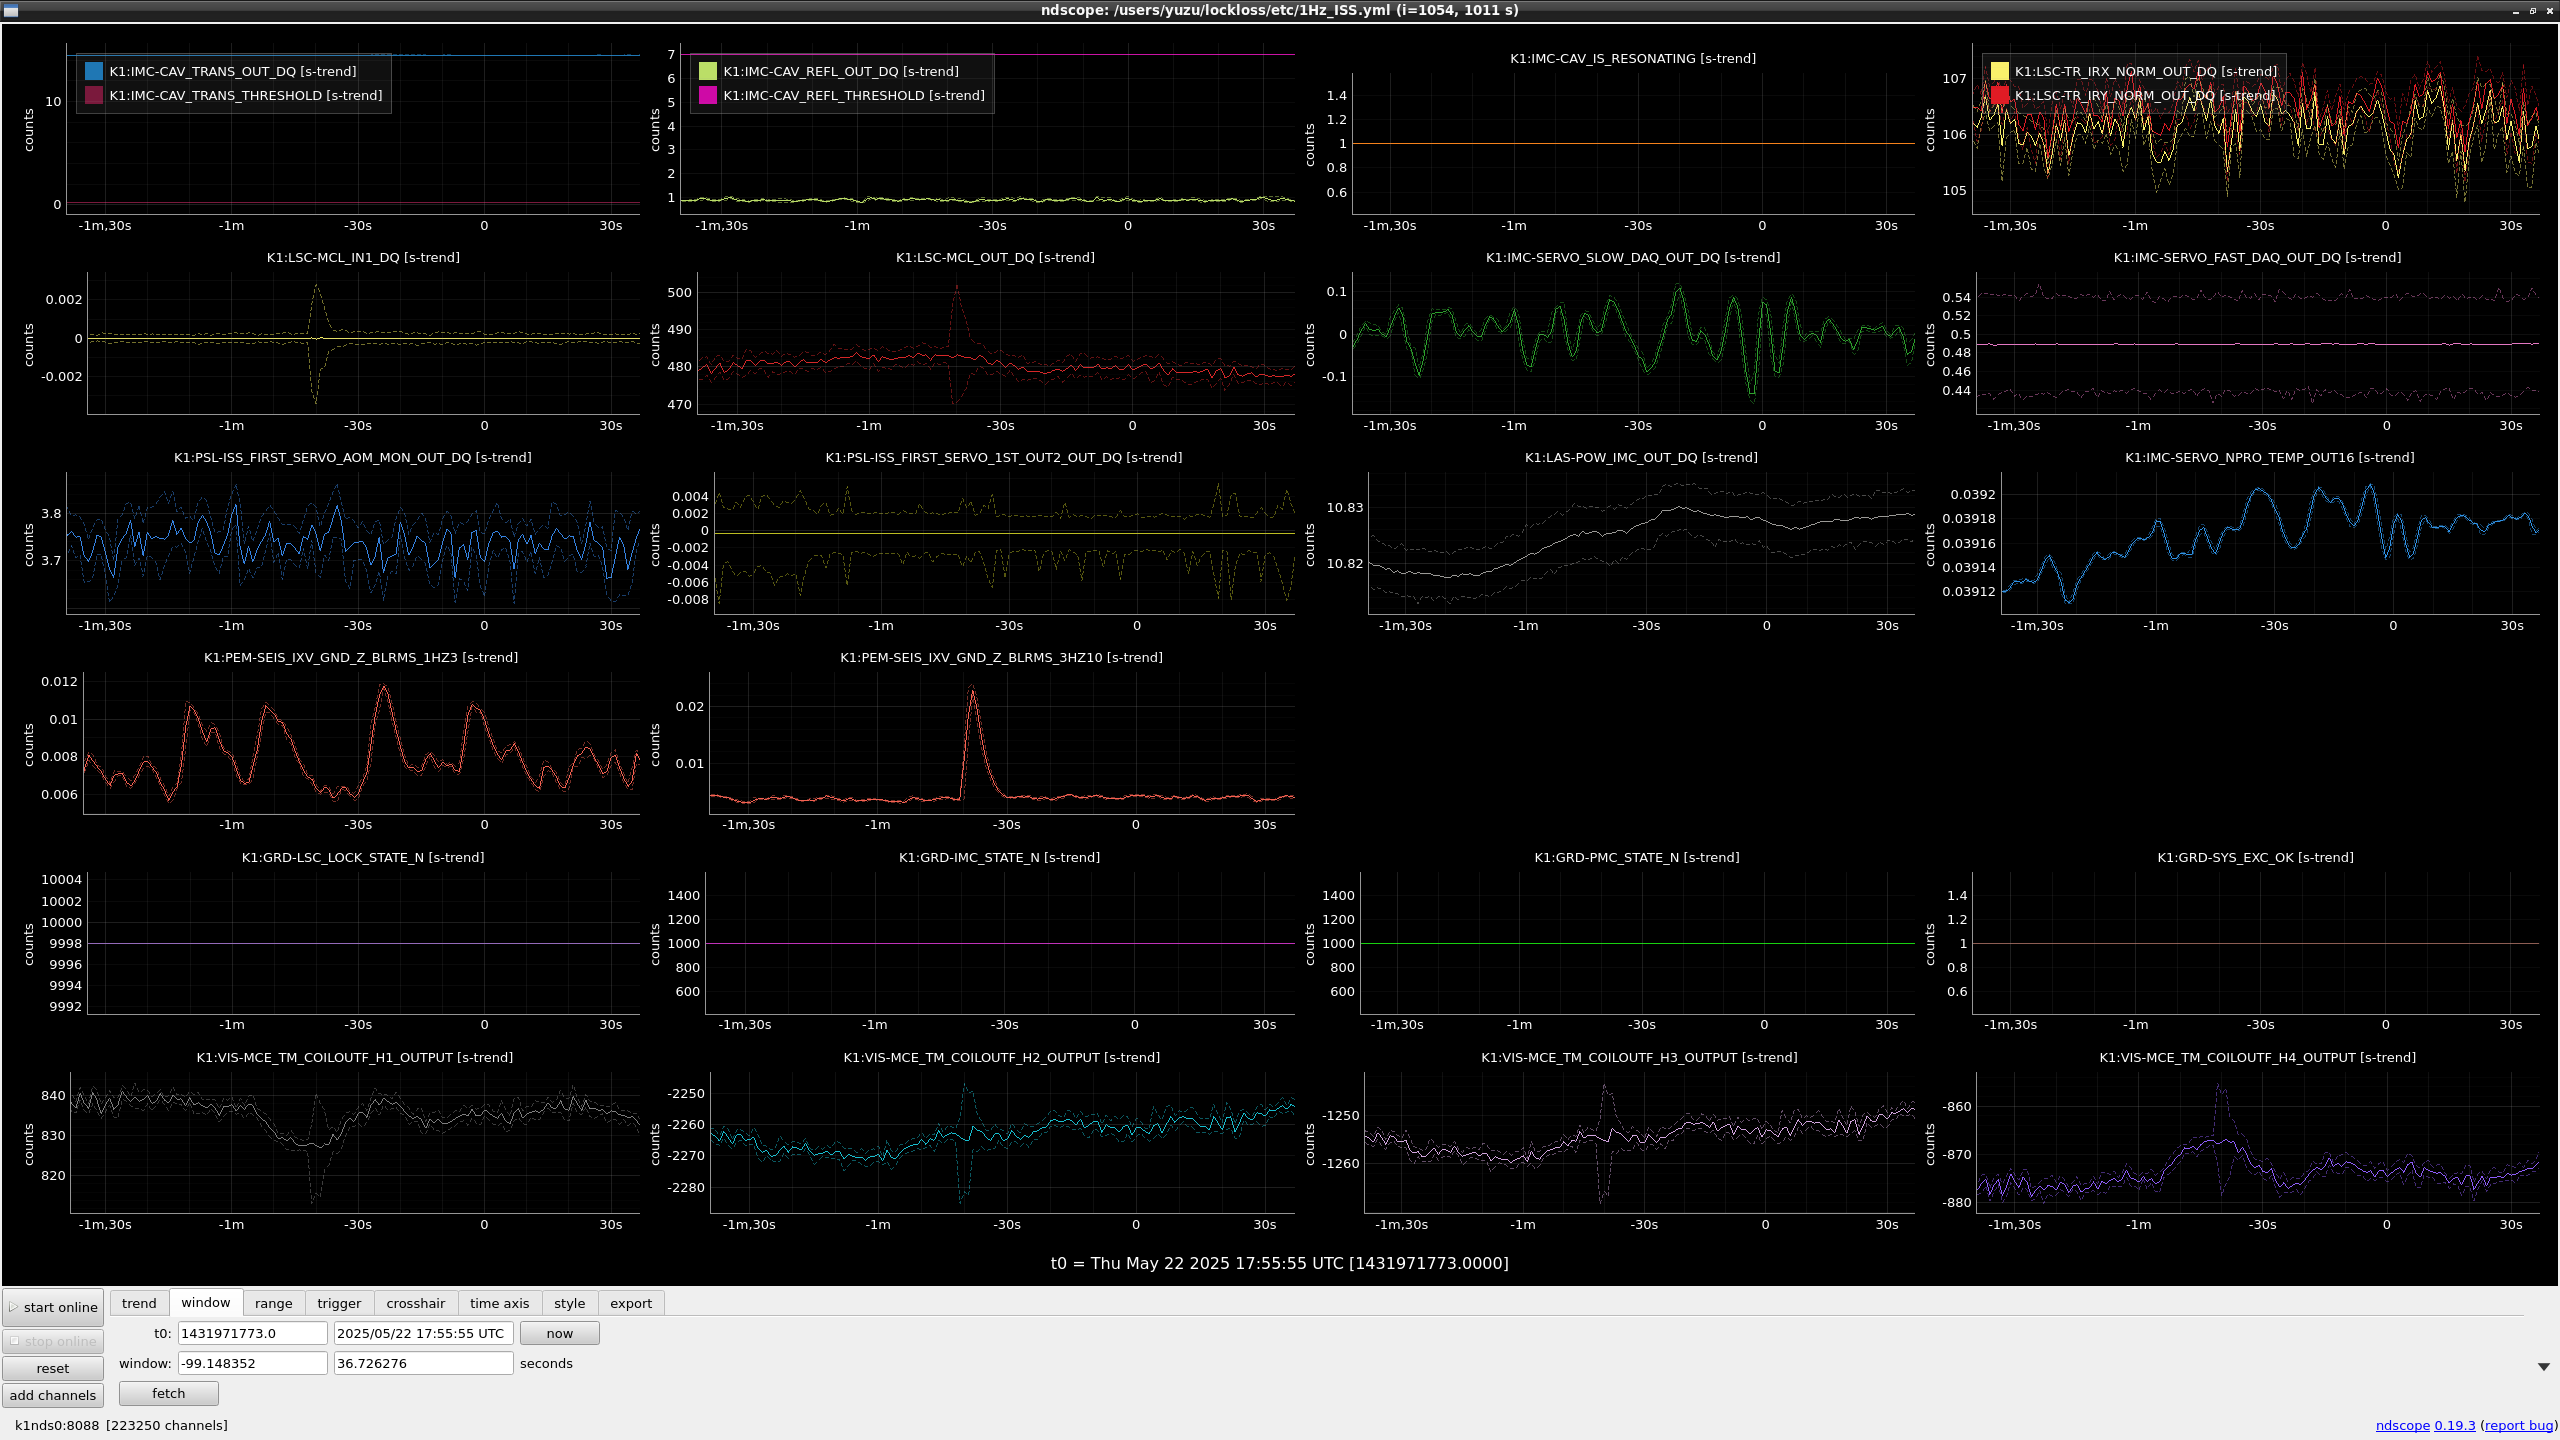
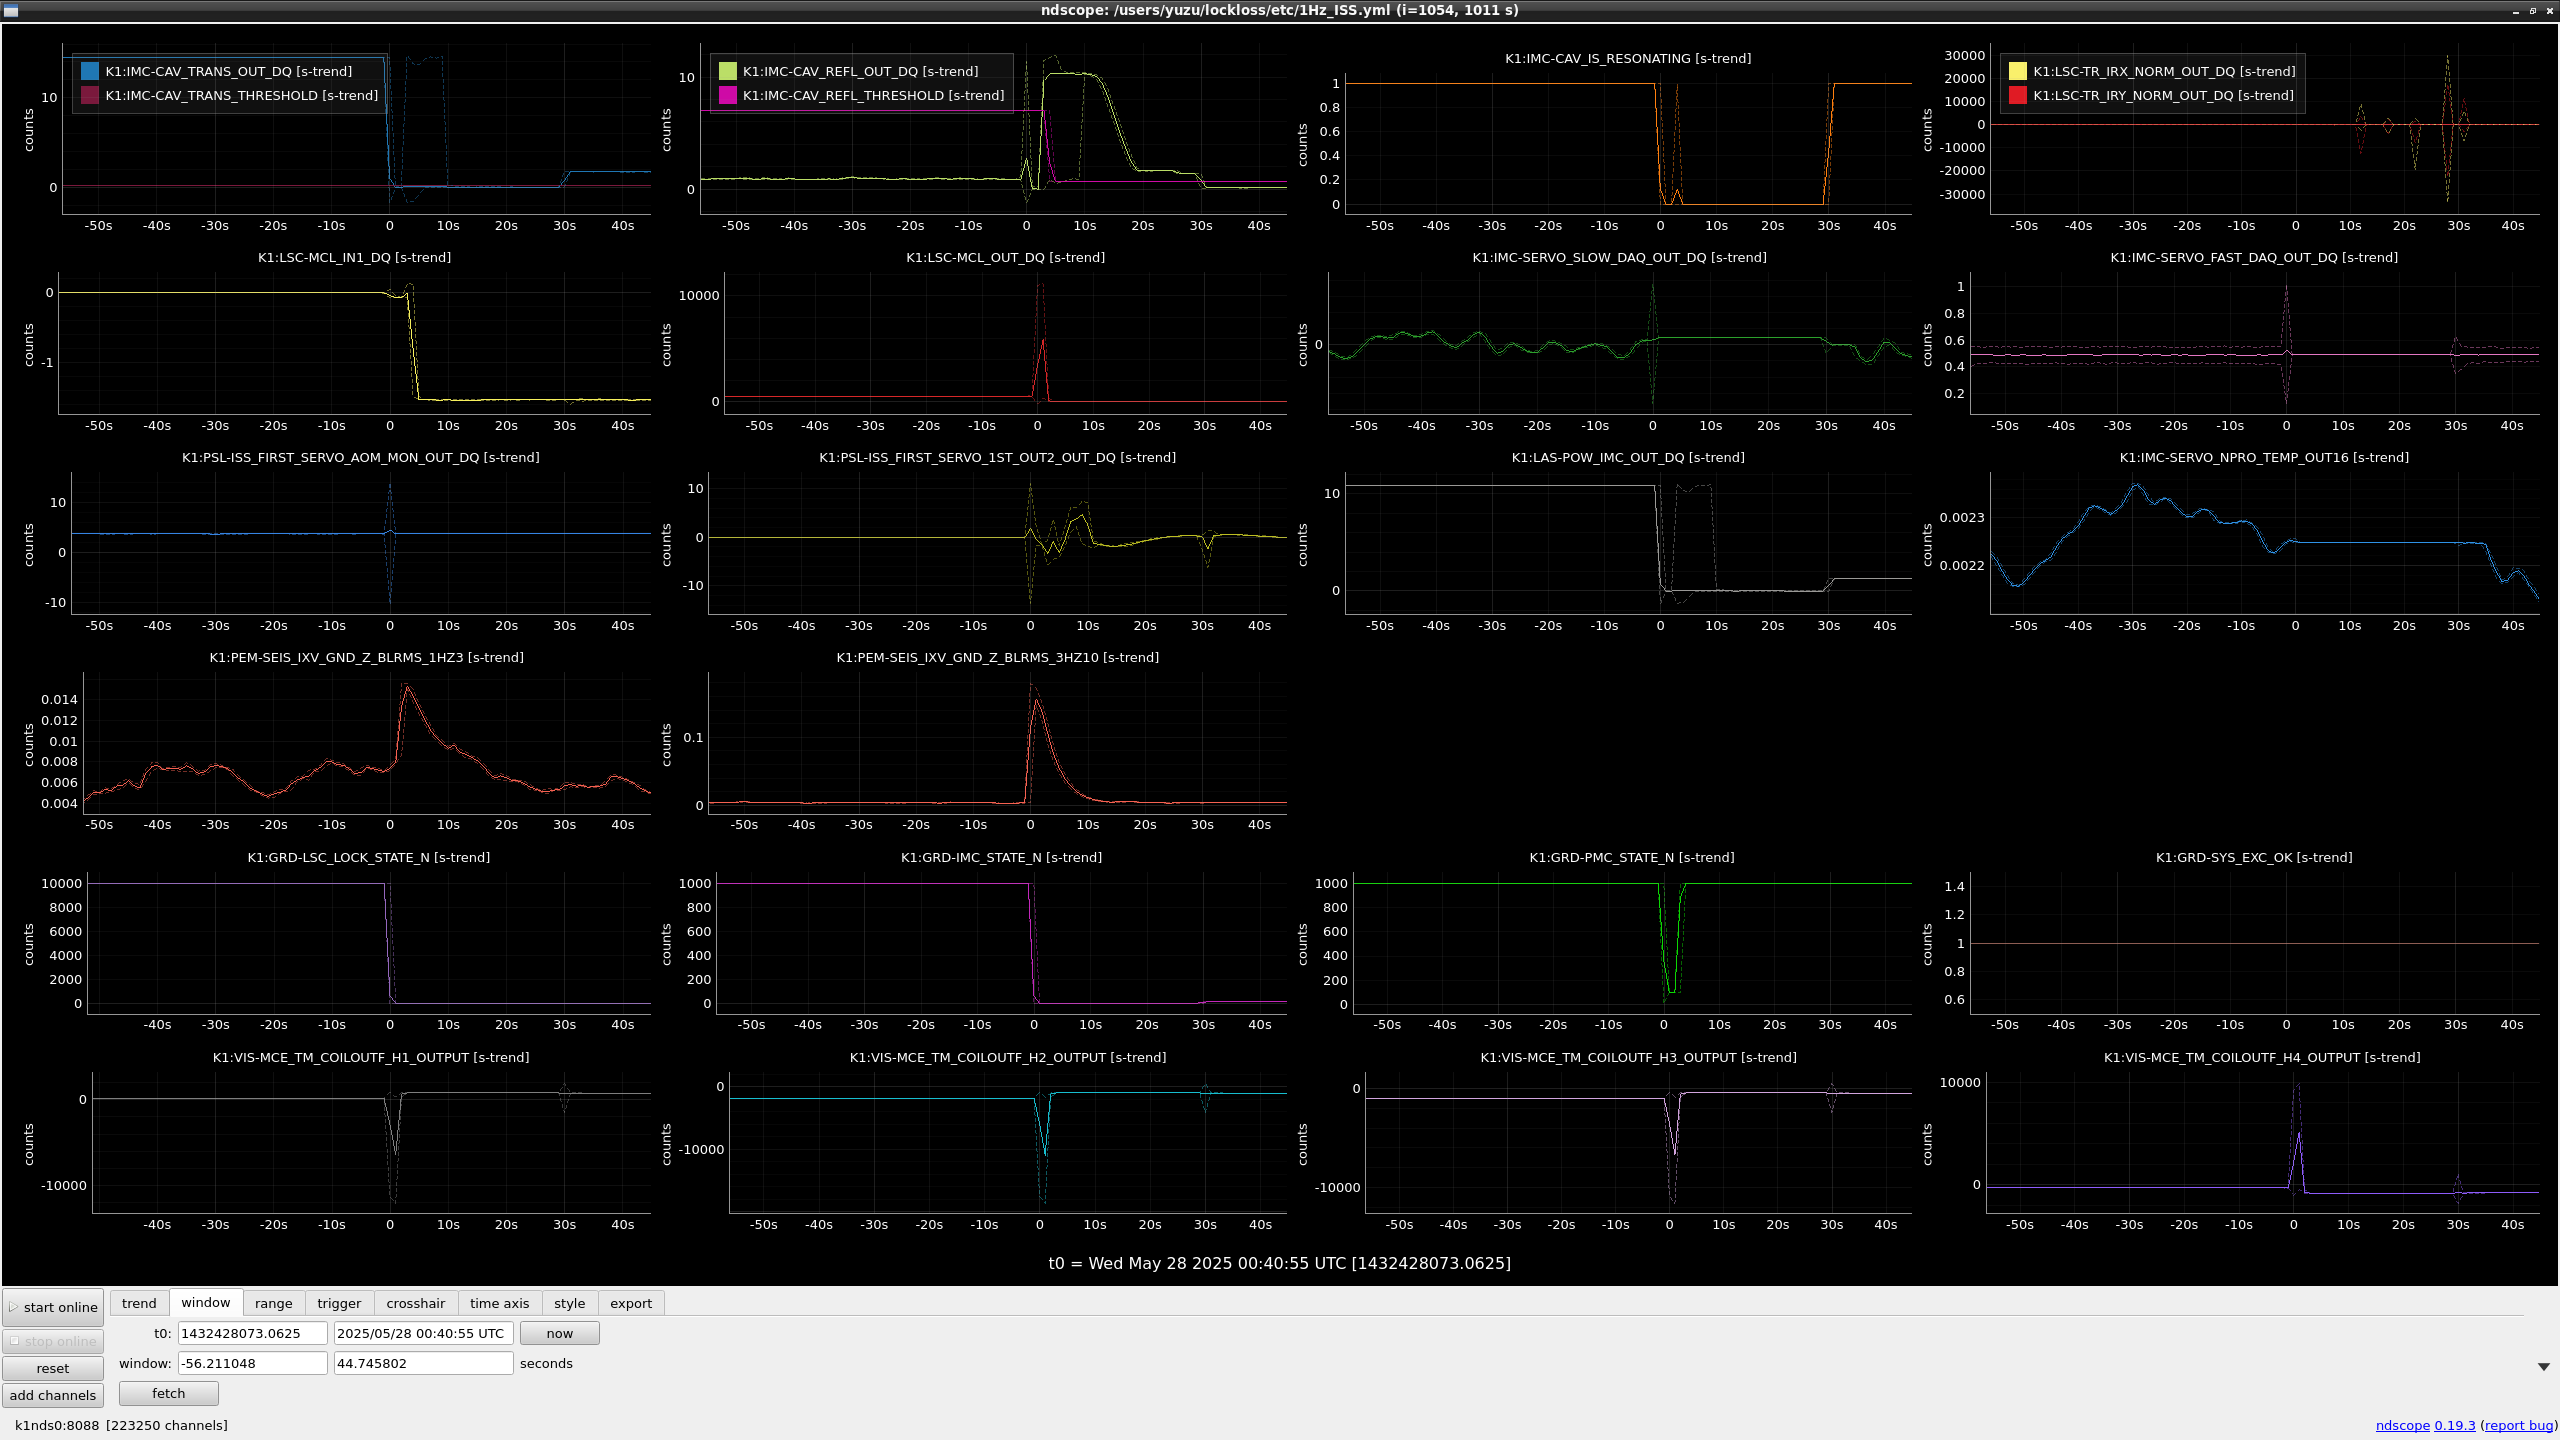
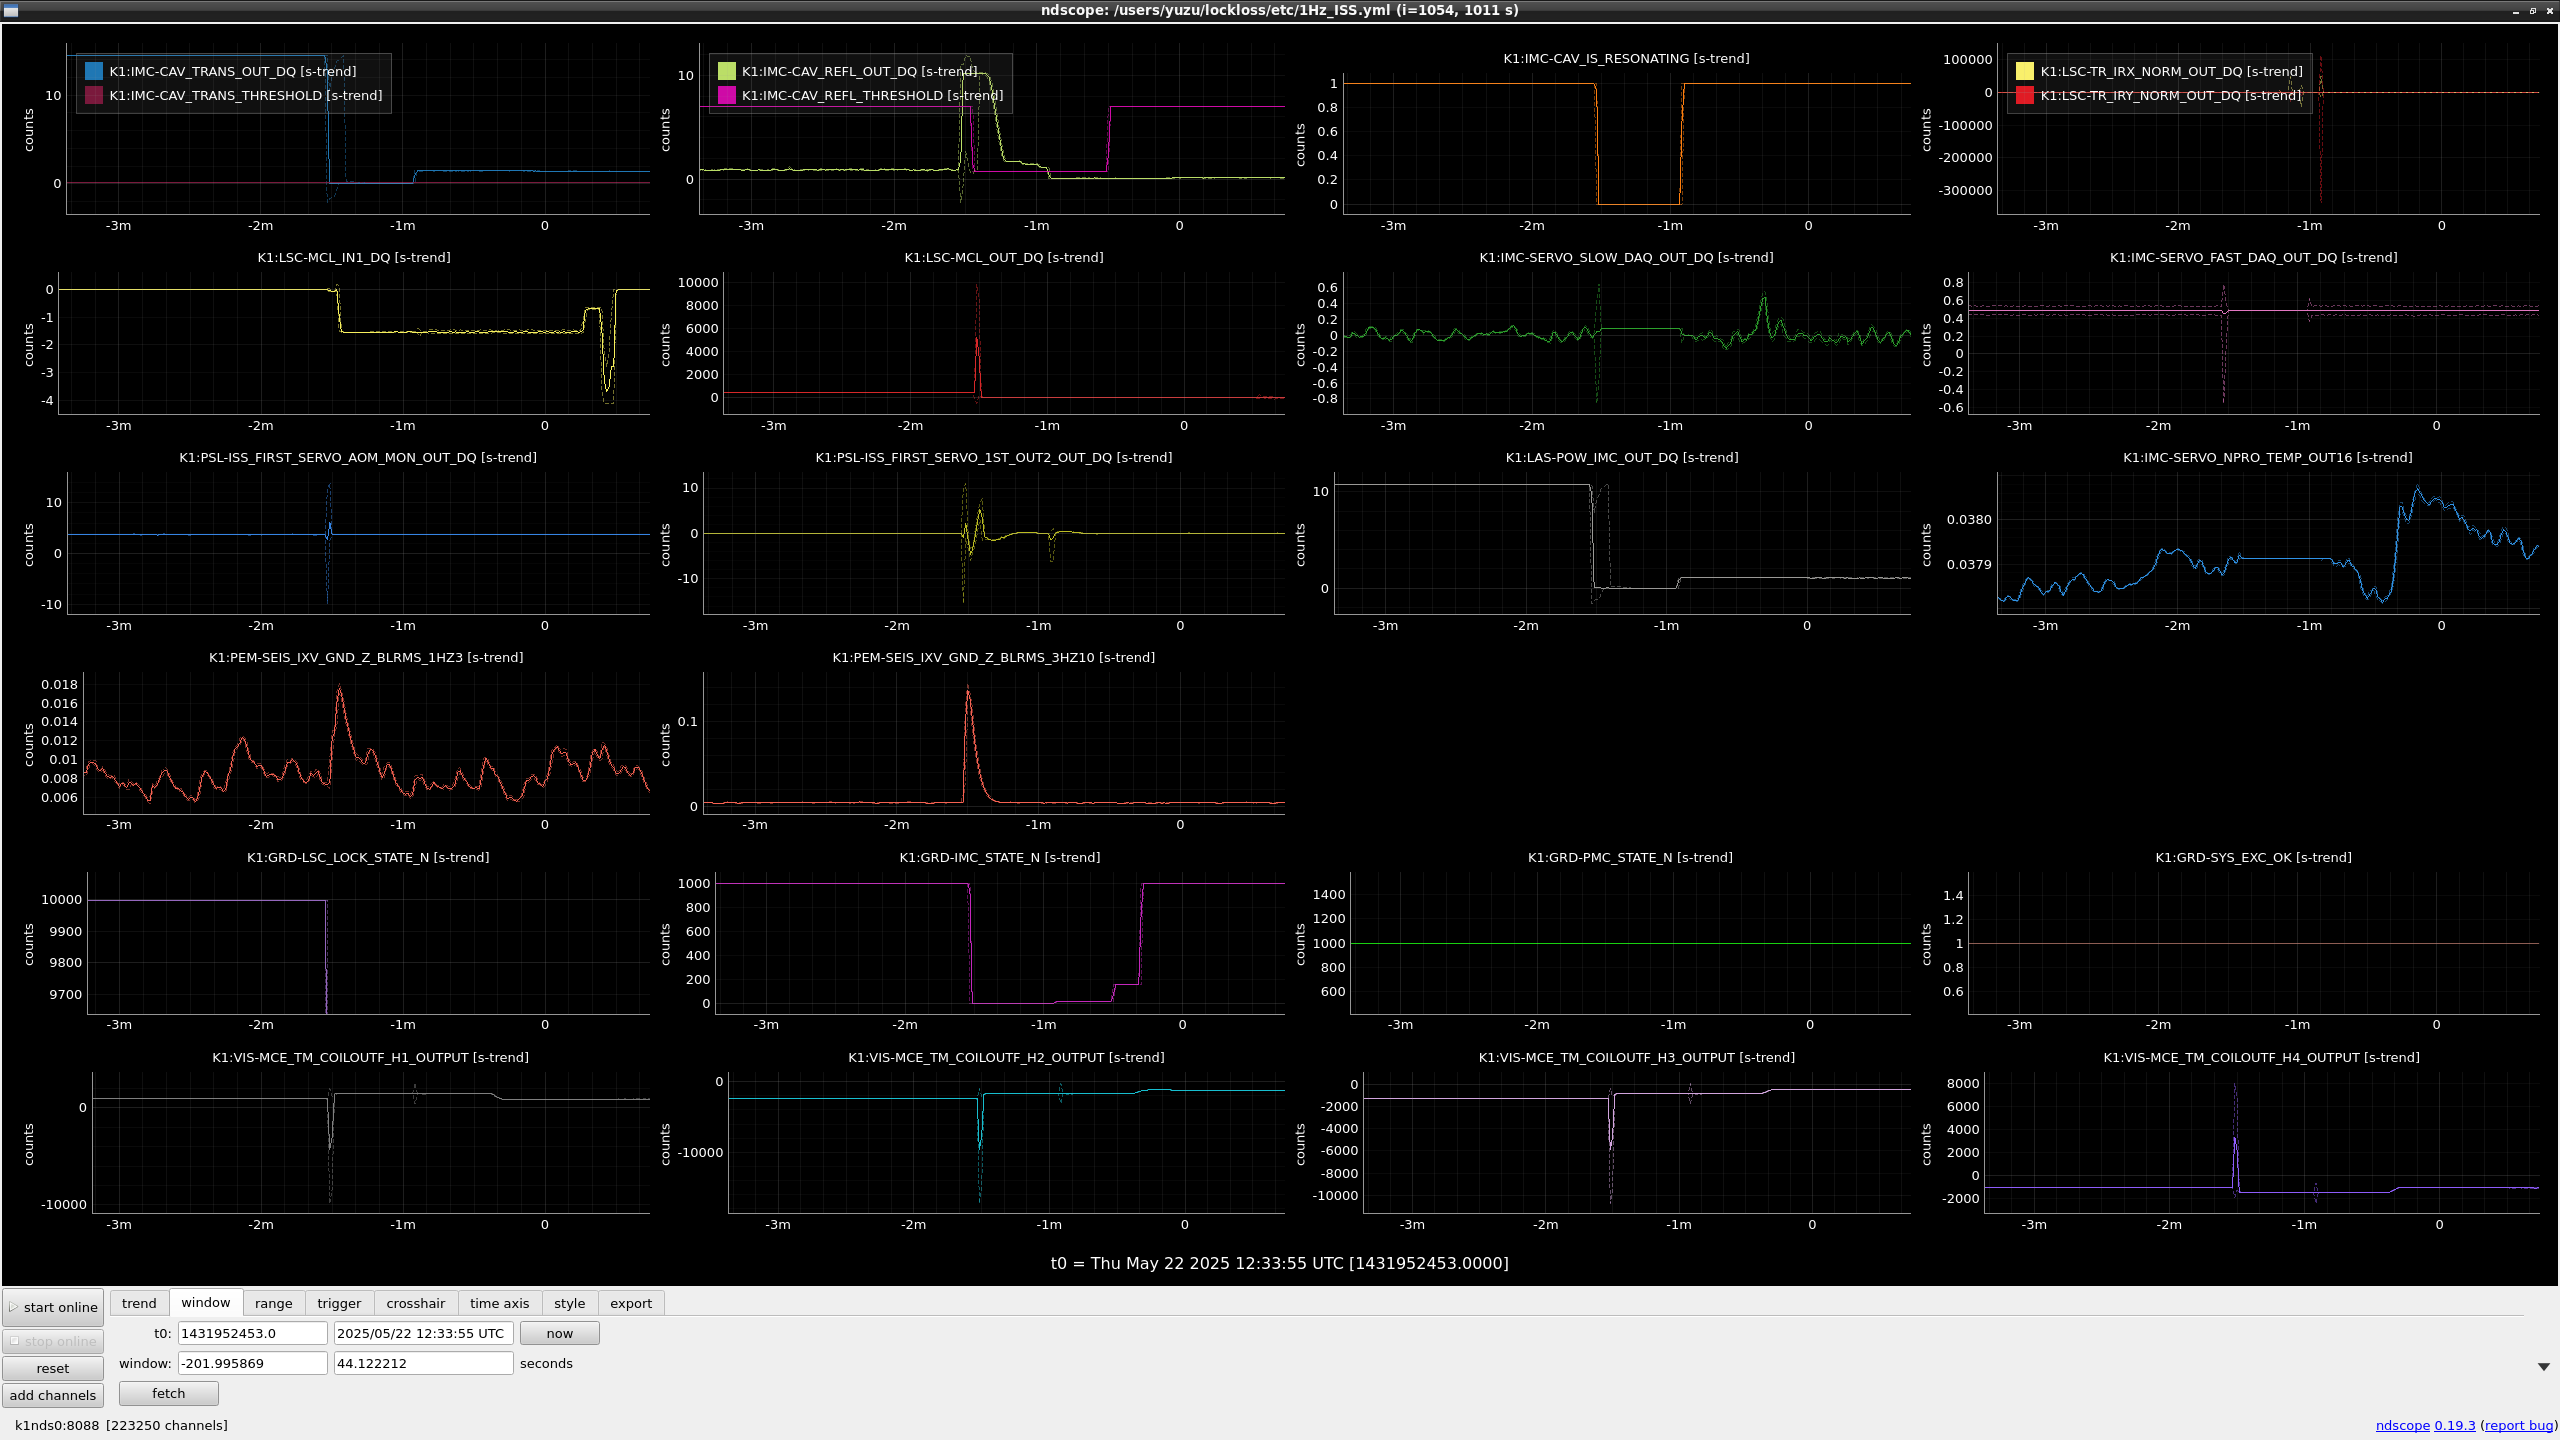
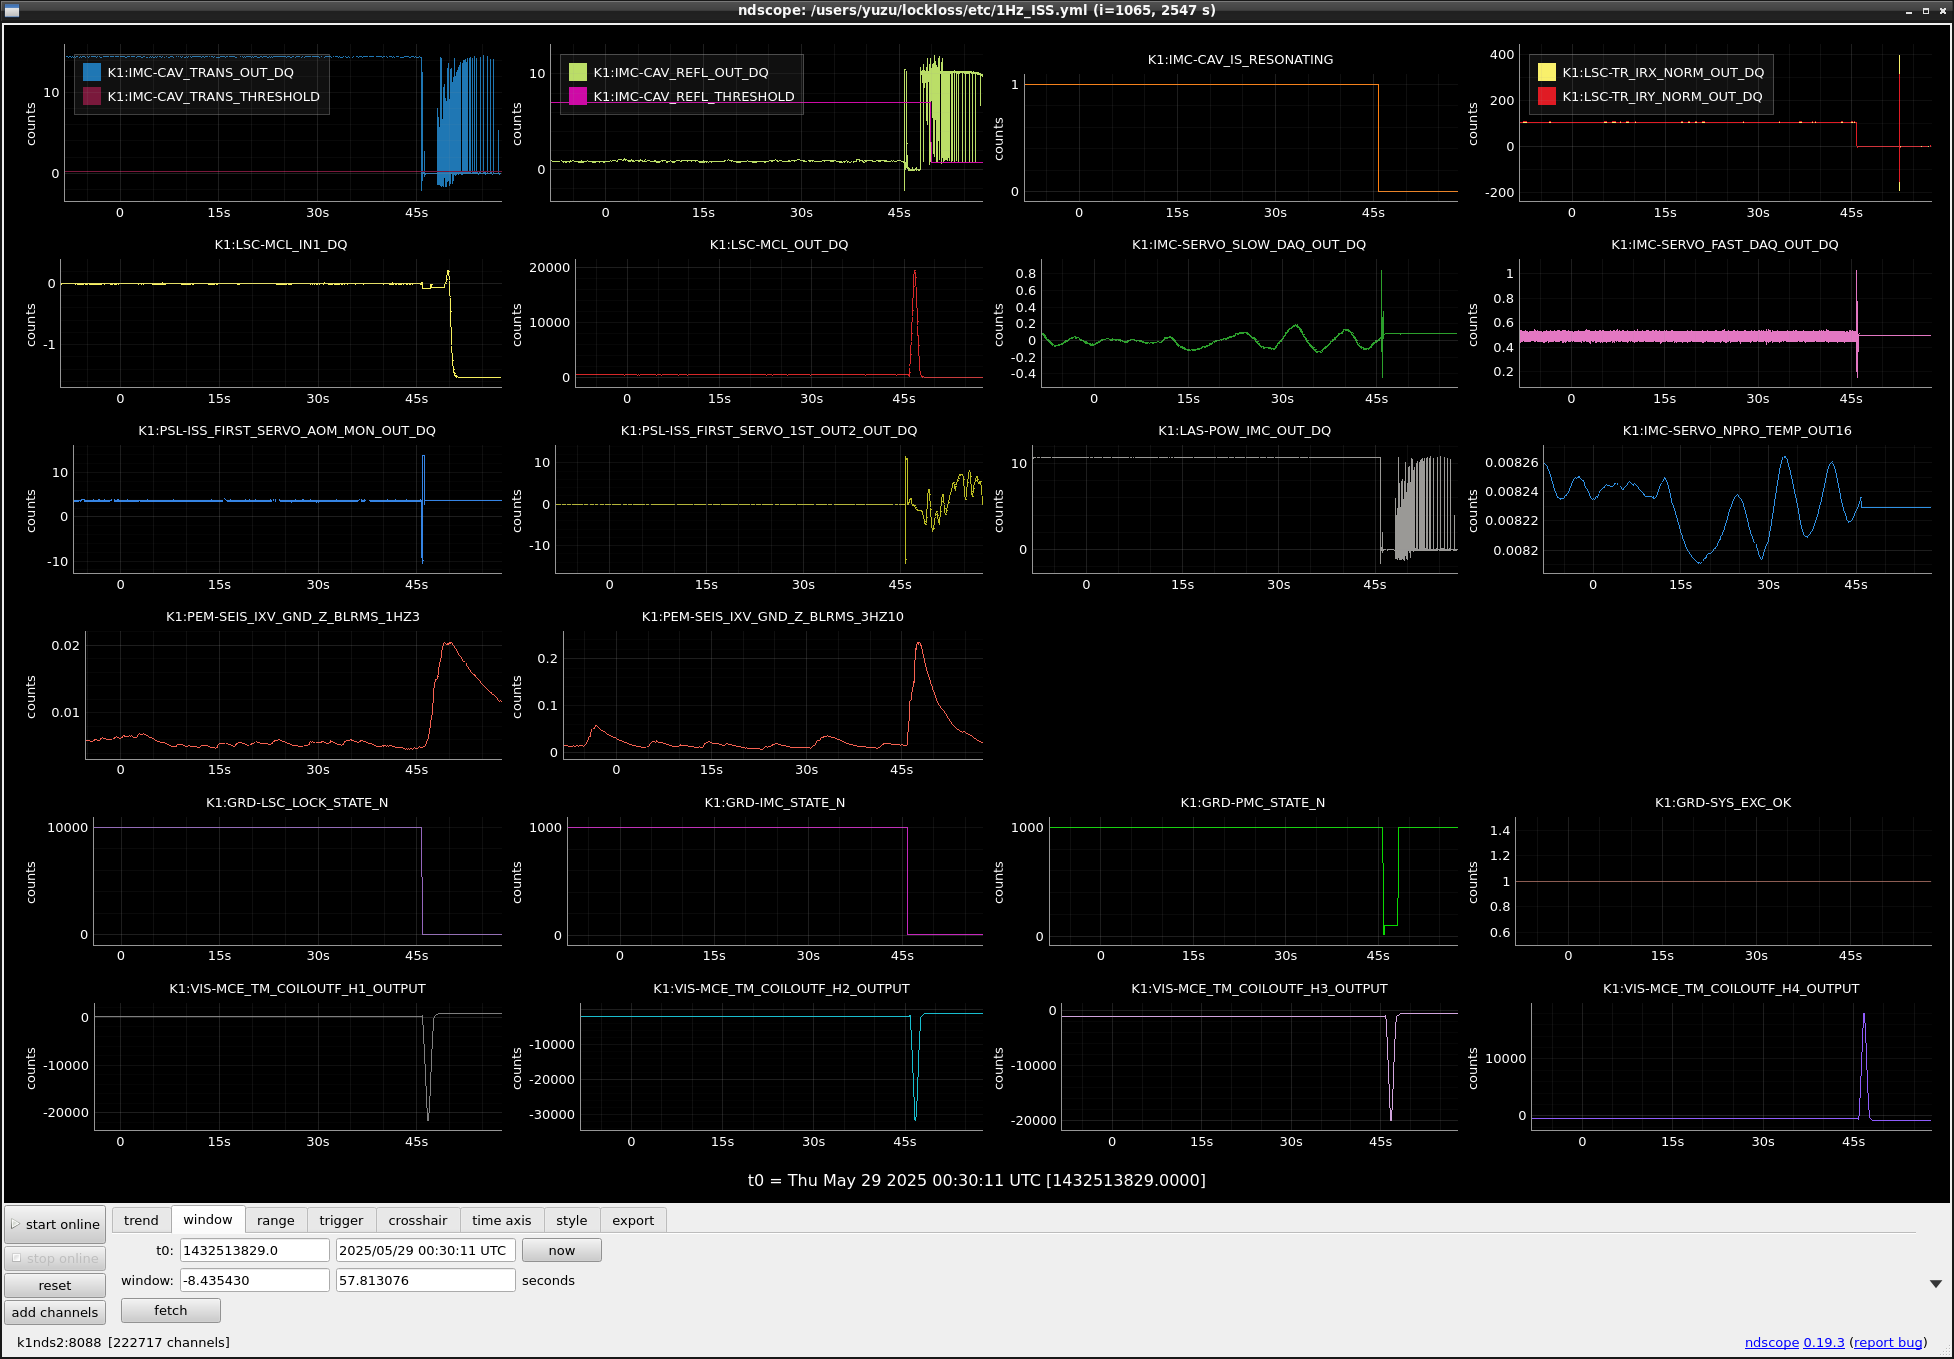
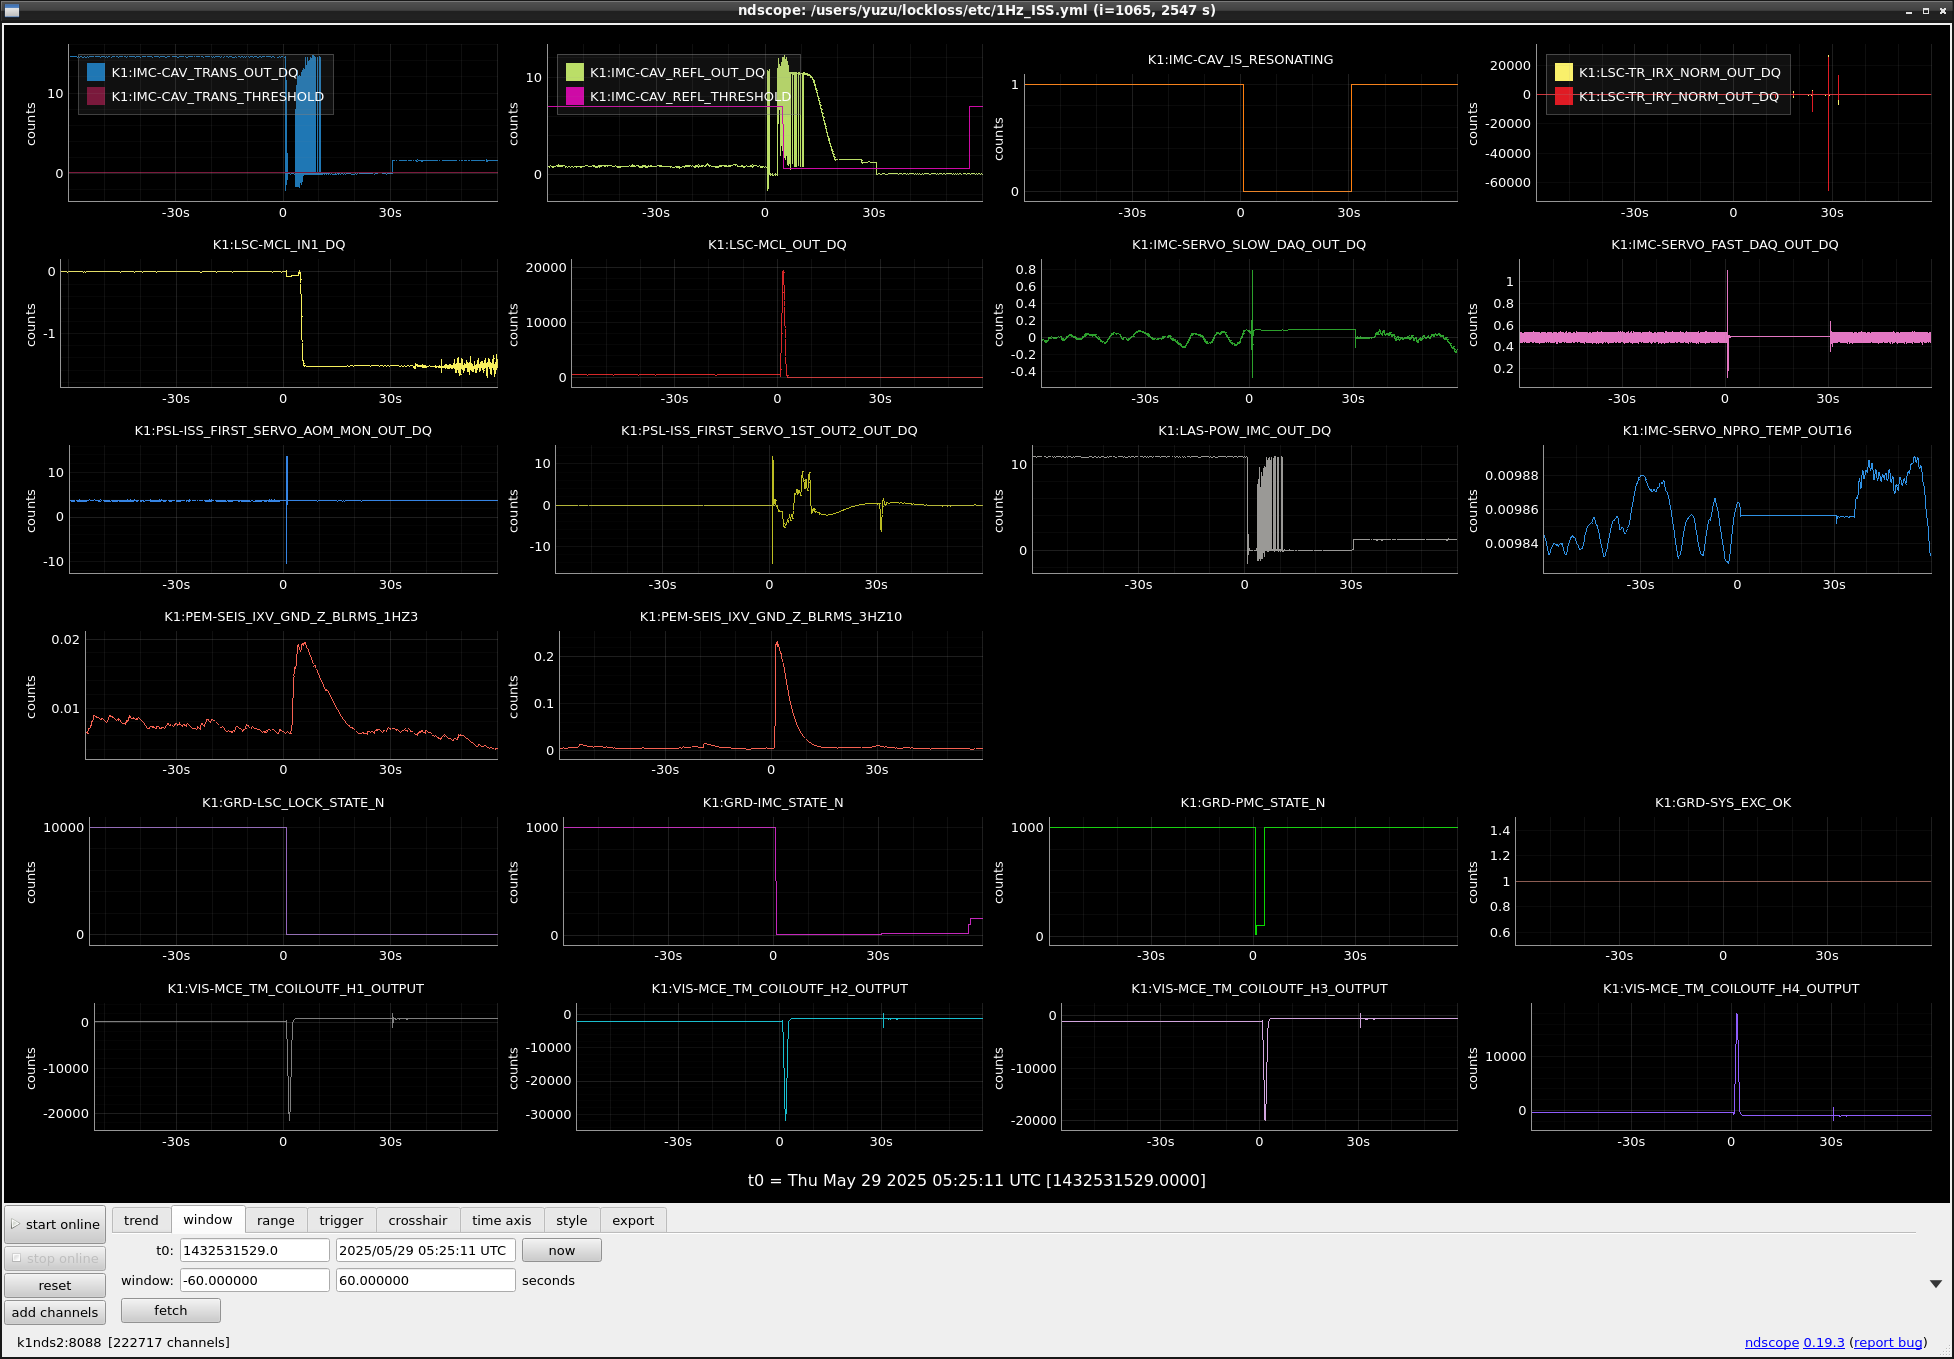
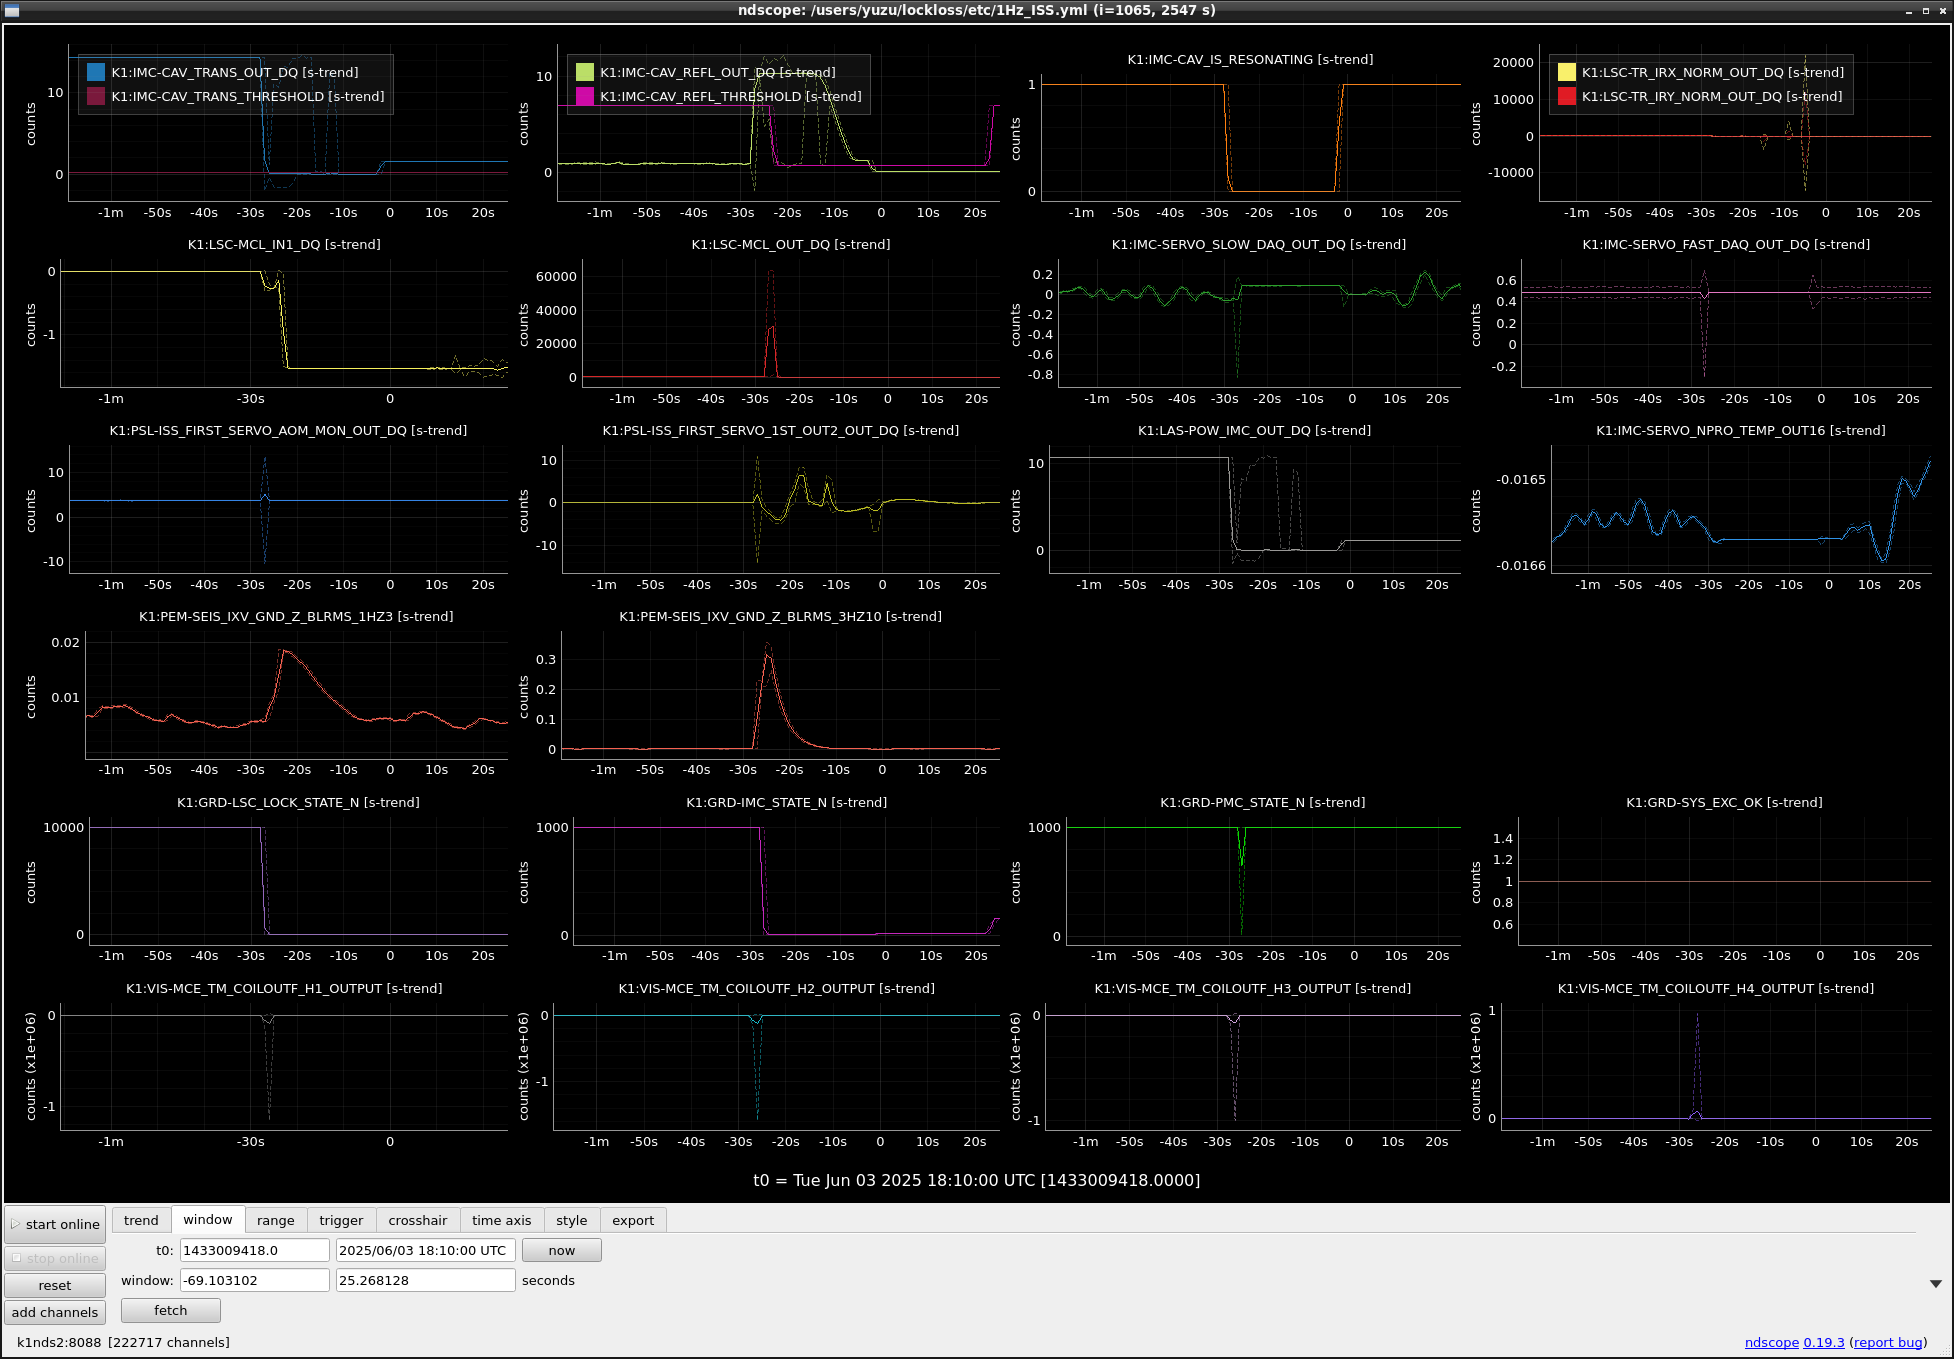
I checked the recent relations between blasting for the tunnel construction and IFO unlock. All figures show the seismic noise at IXV Z and IR trans changes.

All blasting seemed to unlock the IFO.

Is it beneficial to prepare a robust but noisy control for the predicted blasting timing? The actual blasting timings seemed to be fluctuating within about 1 hour around the pre-reported timings. 1 hour is too long to waste the observation time. If the relock is faster, is it better to wait for the relock? However, alignment can also be damaged by blasting? If so, the sensitivity just after relock can be worse until ASC/BPS/ADS finds good alignment. This is also practical loss of time?

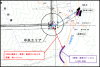
Anyway, we should report these results to the Tunnel constructors.

  • Fig.1: 20250429 19:30
  • Fig.2: 20250428 19:44
  • Fig.3: 20250428 09:58
  • Fig.4: 20250422 04:27
  • Fig.5: 20250421 22:59
  • Fig.6: 20250421 09:24
  • Fig.7: 20250417 20:22

and blasting timing reports from the tunnel constructor (excel files).

Images attached to this report
Non-image files attached to this report
Comments to this report:
tatsuki.washimi - 16:20 Wednesday 30 April 2025 (33608) Print this report

I checked the seismometer signal (IXV, Z-axis, with 1- 40Hz) for the blasting time.

The amount of bombs was larger in Dec-Feb  than recent. However the signal is  larger in recent.

Images attached to this comment
tomotada.akutsu - 20:36 Wednesday 30 April 2025 (33611) Print this report

An assumption: Since the digging has been ongoing, the blasting point would become deeper, and so the shock might become easier to transfer to the KAGRA site.

shinji.miyoki - 22:33 Wednesday 30 April 2025 (33612) Print this report

Of course, the blasting position is approaching the KAGRA corner station. 300m of excavation was now completed from the Do area.

hirotaka.yuzurihara - 15:23 Thursday 01 May 2025 (33631) Print this report

Based on Miyoki-san's request, I performed the eye-scan for the seismometer data (1~10 Hz) at the blasting. The lockloss during 1.2 W operation (~2025/02/20) sometimes occurred coincidentally with the blasting. The ratio is 9/33=27%. On the other hand, the lockloss during 10 W operation (2025/02/20~4/28) always occurred coincidentally with the blasting (17/17=100%), even though the amplitude of the seismometer (3~10 Hz) was comparable between 1.2 W and 10 W operation.

Details

  • The plots of the seismometer (1~3 Hz and 3~10 Hz) are uploaded in JGWdoc. Figure 1 shows an example of a seismometer. The blue dotted line indicates the time of the blasting. The bottom green/red bar indicates the interferometer status. When the bar is green, the interferometer is locked in the OBSERVATION state (=LSC_LOCK guardian is more than 9990). The title shows the bomb size.
  • For the blasting time, Washimi-san provided the CSV file, including the blasting time and bomb information. I split it into two files. They are available at JGWdoc.
  • I performed the eye-scan for all the blasting time and collected the peak amplitude of K1:PEM-SEIS_IXV_GND_Z_BLRMS_3HZ10 . The results are summarized in the Google spreadsheet (for the link, see JGWdoc).
  • Figure 2 shows the time series of the bomb size and peak amplitude of the seismometer.
  • Figure 3 shows the comparison of the peak amplitude between 1.2 W and 10 W operation.
    • The top panel shows the result of the 1.2 W operation. The interferometer faced the lockloss coincidentally with the blasting. The ratio is 9/33=27%. Red dots represent the amplitude of the seismometer at the time of lockloss, coincidentally with the blasting. The green dots represent the amplitude when there was no lockloss, coincidentally with the blasting.
    • The bottom panel shows the result of the 10 W operation. The interferometer faced the lockloss coincidentally with the blasting. The ratio is 17/17=100%. For other blastings, the interferometer was not in the OBSERVATION state.
    • The amplitude values are comparable in both cases. But, as shown in klog33559, the interferometer at 10 operation is sensitive to the seismic motion of 3~10 Hz. So, the number of lockloss is different.
    • Even though the bomb is 10 kg which is the mimumum value in 10 W operation, the coincident lockloss occurred.
  • Because the values are collected by eye-scan, it's possible that the miscounting happened. I will perform the cross check by using ndscope.
Images attached to this comment
hirotaka.yuzurihara - 19:34 Thursday 01 May 2025 (33635) Print this report

I checked the data by using ndscope. The plots taken by the ndscope are summarized in wiki.
Actually, 2 of 17 lockloss were miscounted. We can see the transient excess on the seismometer. But, before the excess of the seismic motion, the interferometer lost the lock due to the other reason, a few minutes ago.

Anyway, we can see the coincidence of the lockloss and excess of seismometer 100% (=15/15). Note that 5 of 15 lockloss were labeled by the IMCL label.

In these lockloss, the minimum amplitude of the seismometer (3~10 Hz) at the lockloss was 0.07, as shown in Figure 1. The minimum bomb size at the lockloss was the 12.8 kg, which made the excess of 0.1 um/s to the seismomter.

The time shift between the recorded time of blasting and the time of seismometer excess is distributed from -7min to +3 min.  In most cases, the time is shifted to earlier. The actual values are summarized in the spreadsheet.

Here I just counted the excess of seismometer. To exclude the accidental coincidence, the apperance of the excess might be helpful. These excess has the single peak, not two step peak (consisting the P-wave and S-wave). It indicates that the source of the seismic motion will be very close to the KAGRA site. So, it's OK to say these excess came from the blasting.

Images attached to this comment
shinji.miyoki - 9:11 Friday 02 May 2025 (33647) Print this report

The blasting point is now approaching the KAGRA corner station as Fig.1. More 50m of excavation using blasting will be expected until around the end of July.

According to the constructor, the ground condition became worse around April 18th. In addition, the blasting point is approaching the surface of the mountain, so blasting could also increase the surface waves.

Images attached to this comment
tatsuki.washimi - 12:32 Friday 02 May 2025 (33654) Print this report

I updated my analysis:

  • Get the SEIS_IXV_Z peak-to-peak value [um/s] in ±20 minutes of the reported time. (previous analysis: ±2 minutes )
  • Check the time difference (SEIS signal - reported), and the blasting position along the tunnel length
Images attached to this comment
hirotaka.yuzurihara - 16:50 Thursday 29 May 2025 (33955) Print this report

I got the time information of the blasting from Yokozawa-san. So, I checked the recent blasting between 2025/05/22 18:30 JST (we could recovered the DC READOUT at that time klog33869) and 2025/05/28 14:30 JST (the last recorded time in the document).
In total, there were 16 blasting.

  • 2 times: the interferometer survived the blasting at OBSERVATION state (as shown in Figure 1 and 2)
    • suvival ratio: 50% = 2/4
    • In the case of Figure 1, the amount of the bomb was 37.6 which is typical value. Even though the amplitude of the seismic motion is comparable with the threshold to make the IMC oscillation, the lockloss didn't happen.
    • In the case of Figure 2, the amount of the bomb was 11.6 which is relatively small. The amplitude of the seismic motion was smaller than the threshold to make the IMC oscillation.
  • 2 times: lockloss occurred from OBSERVATION state (as shown in Figure 3 and 4)
    • In both cases, the amplitude of the seismic motion was comparable with the threshold to make the IMC oscillation.
  • 3 times: the interferometer survived the blasting at RF_LOCKED state
    • suvival ratio: 42% = 3/7
  • 4 times: lockloss occurred from RF_LOCKED state
  • 5 times: interferometer was down

There is a hope to survive the interferometer from the blasting.

Images attached to this comment
hirotaka.yuzurihara - 16:12 Wednesday 04 June 2025 (34067) Print this report

Here is a update of the 9 blasting between 5/29 9:30 JST and 6/4 3:10 JST. The pots are available at DAC wiki.

  • 1 time: the interferometer survived the blasting at OBSERVATION state (as shown in Figure 1)
    • suvival ratio: 25% = 1/4
    • The amount of the bomb was 10.6, which is a small value. The amplitude of the seismometer was smaller than the typical value at which the lockloss happened.
  • 3 times: lockloss occurred from OBSERVATION state (as shown in Figure 2~4)
    • The amplitude of the seismic motion was large enough to make the lockloss.
    • The bomb size were 20.6, 34.0, 20.2.
  • 1 time: the interferometer survived the blasting at RF_LOCKED state
    • suvival ratio: 50% = 1/2
  • 2 times: lockloss occurred from RF_LOCKED state
  • 2 times: interferometer was down or lock acquisition.
Images attached to this comment
hirotaka.yuzurihara - 16:48 Friday 06 June 2025 (34093) Print this report

Here is a update of the 7 blasting between 2025/05/30 18:10:00 UTC and 2025/06/05 13:26:35 UTC.

  • no time: the interferometer survived the blasting at OBSERVATION state
    • suvival ratio: 0% = 0/7
  • 6 times: lockloss occurred from OBSERVATION state
    • The amplitude of the seismic motion was large enough to make the lockloss.
    • The bomb size were 25.2, 39.6, 28.4, 26.8, 27.2, 20.2. The plots are available at DAC wiki.
  • 1 times: interferometer was not in observation state.

Note that sometimes the reported time and blasting execution time are different. In maximum, the blasting happened 4 minutes earlier than the reported time.

Search Help
×

Warning

×