[Guo Chin, yuzu]
Motivation
Ushiba-san pointed out the hypothesis that the recent interferometer is sensitive to seismic motion, that weak seismic motion can lead to oscillation of the IMC length, and that frequent lockloss with IMCL label occurs. We want to test this hypothesis by comparing the lockloss data between 10 W operation and 1.2 W operation.
Data set
We focused on the lockloss from the OBSERVATION_WITHOUT_LINES (called silent run) and lockloss with the IMCL labels, because it's easy to find the lockloss related to the excess of the seismic motion (3~10 Hz).
The data in two kinds of periods were checked.
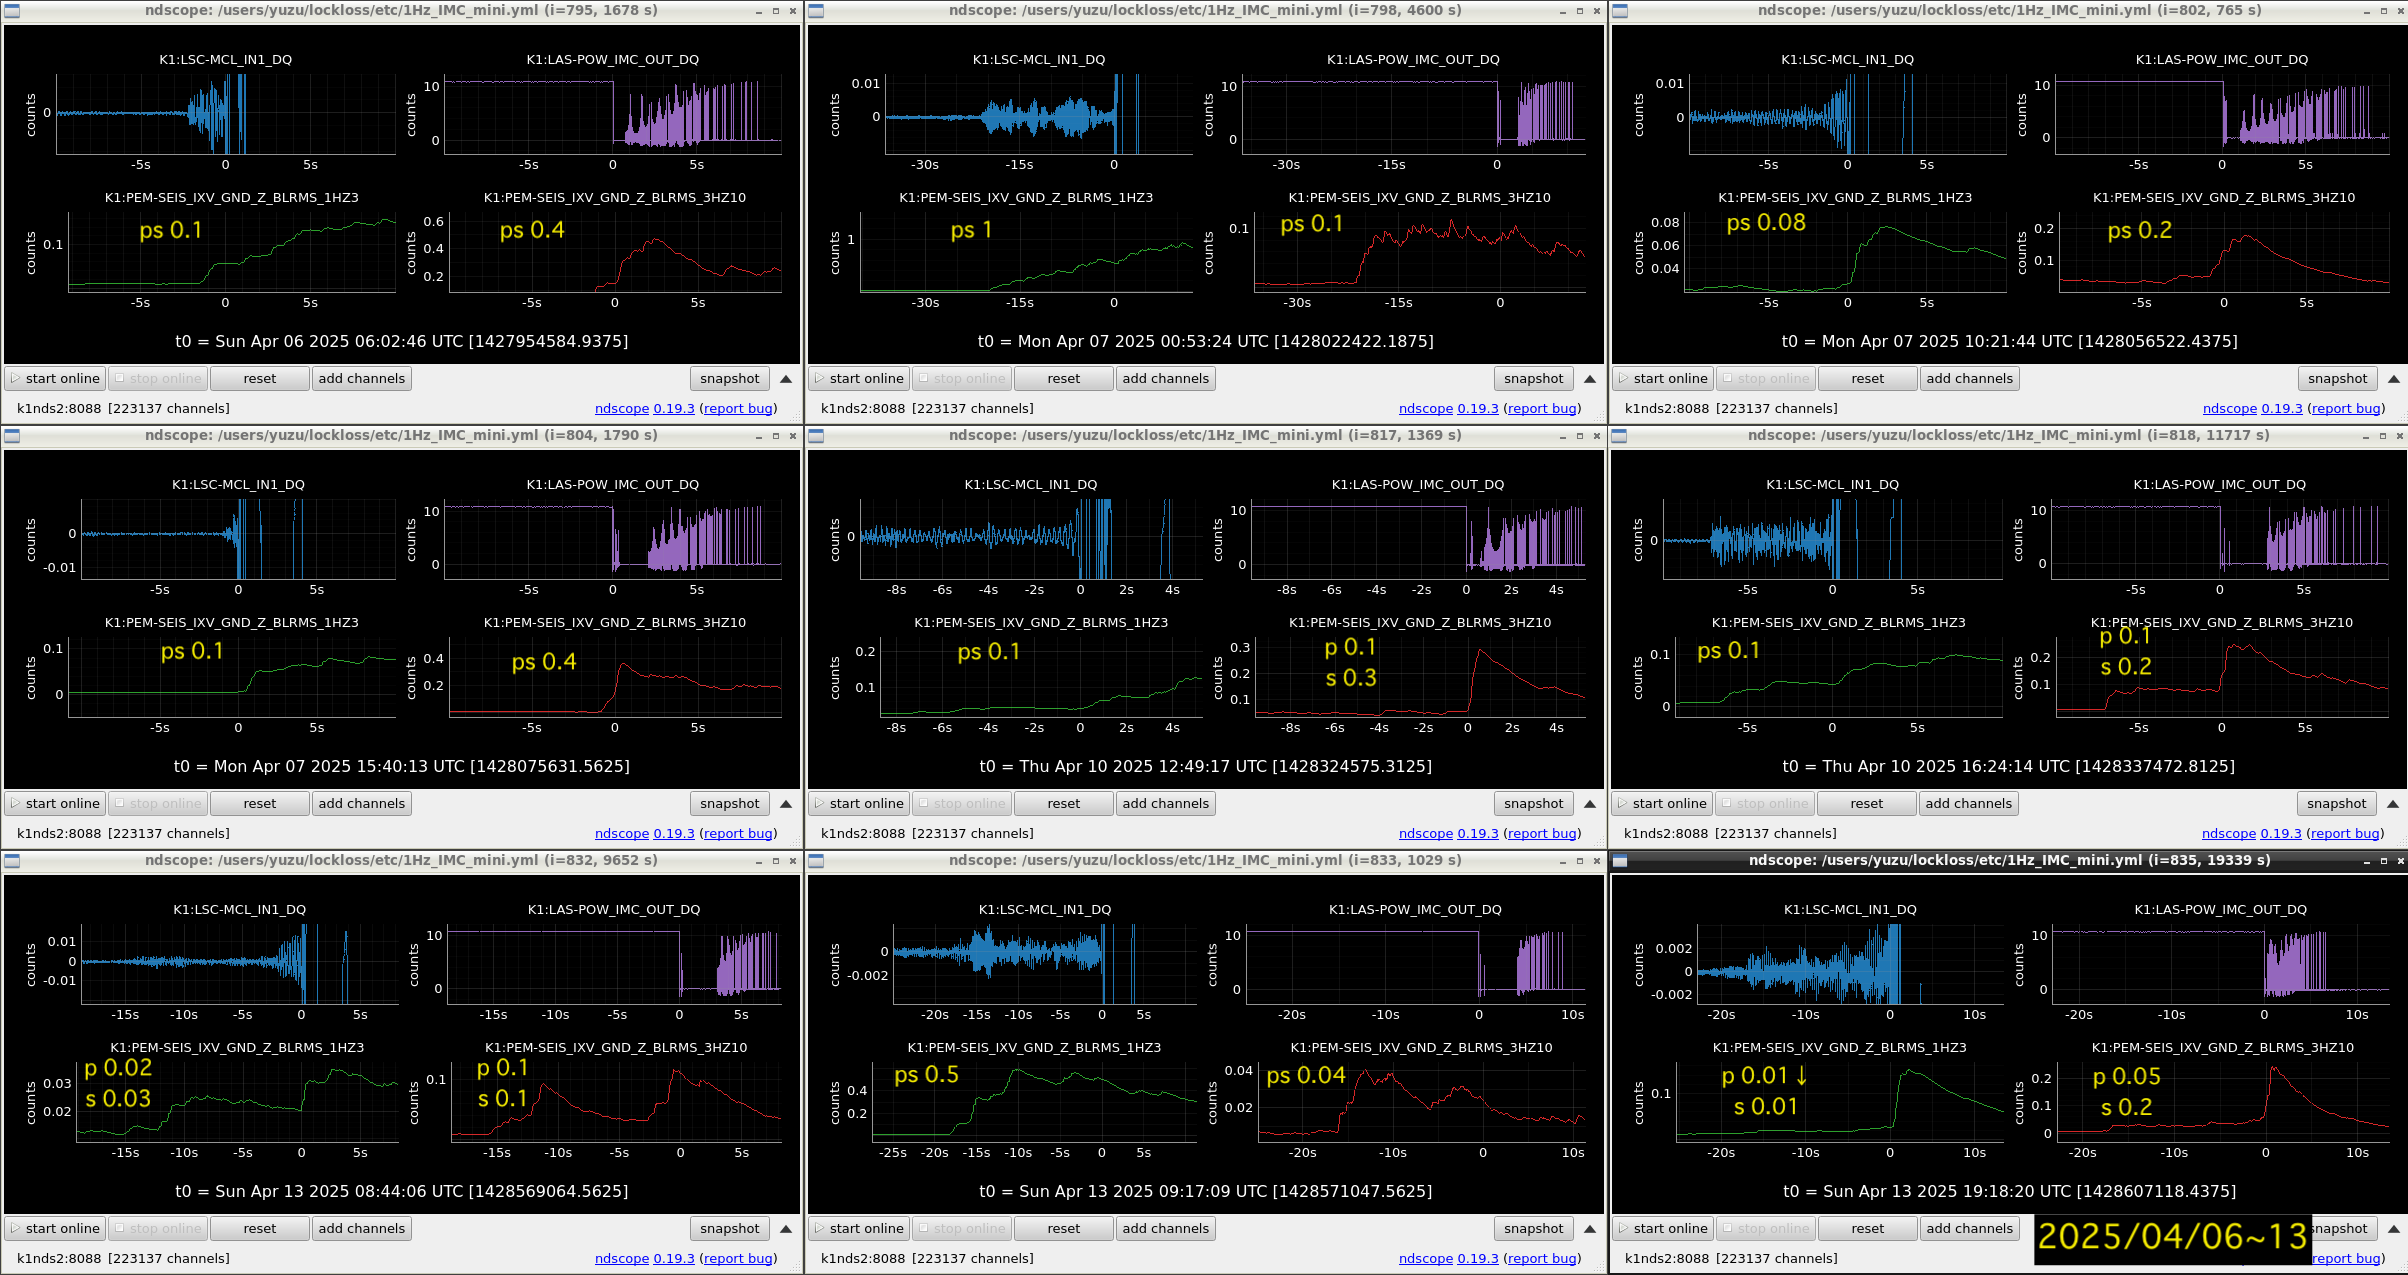
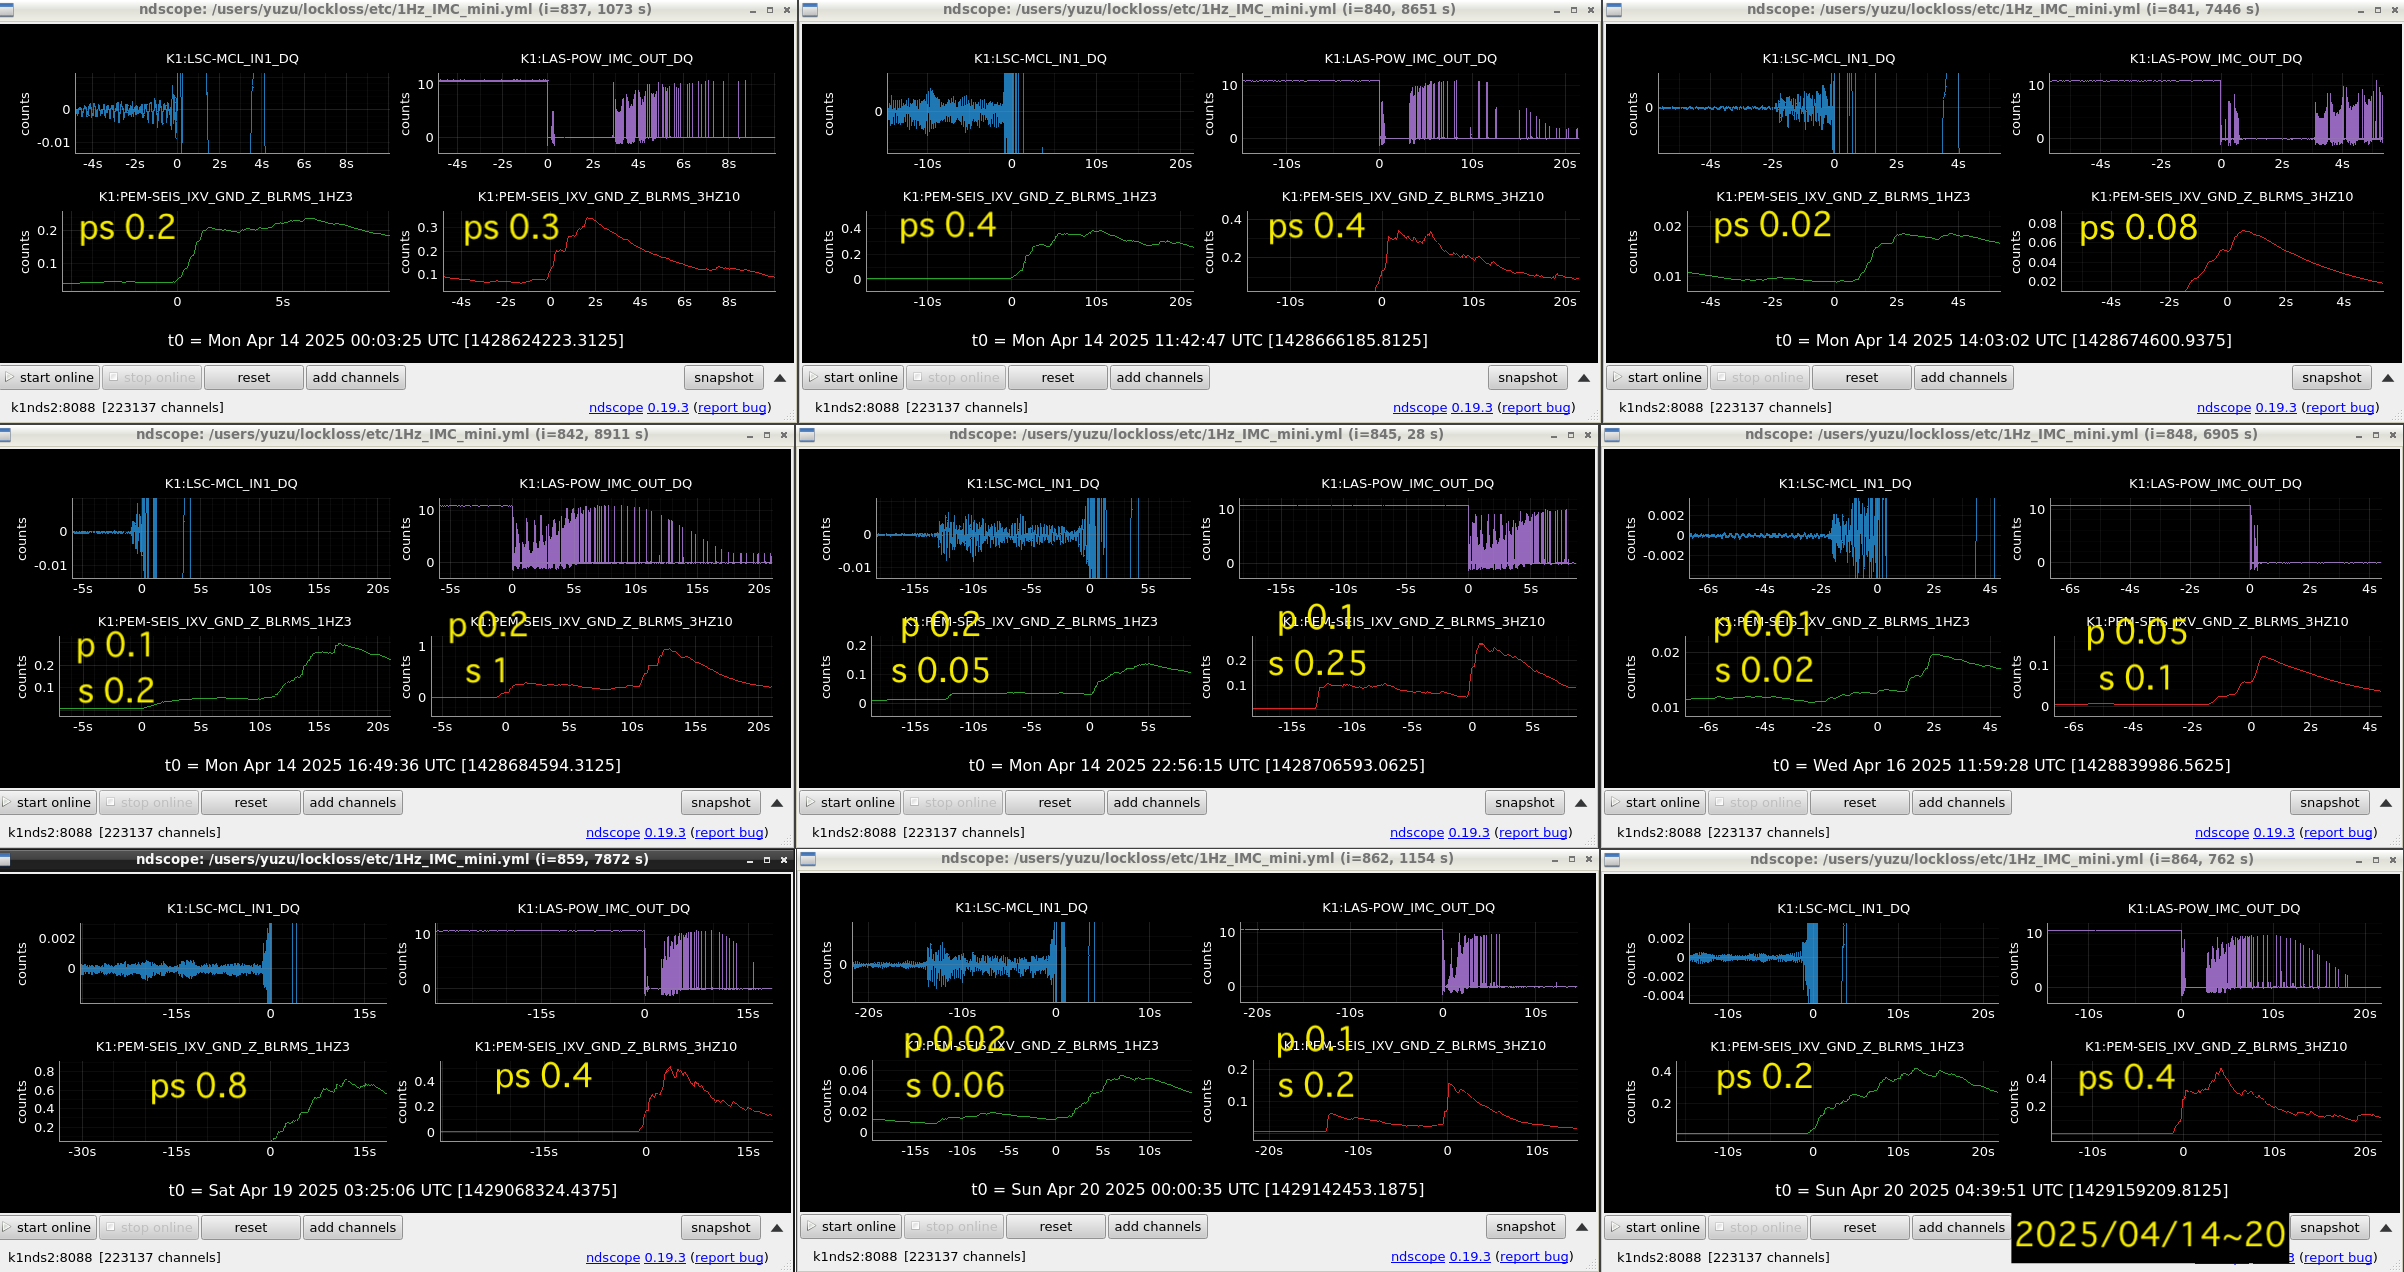
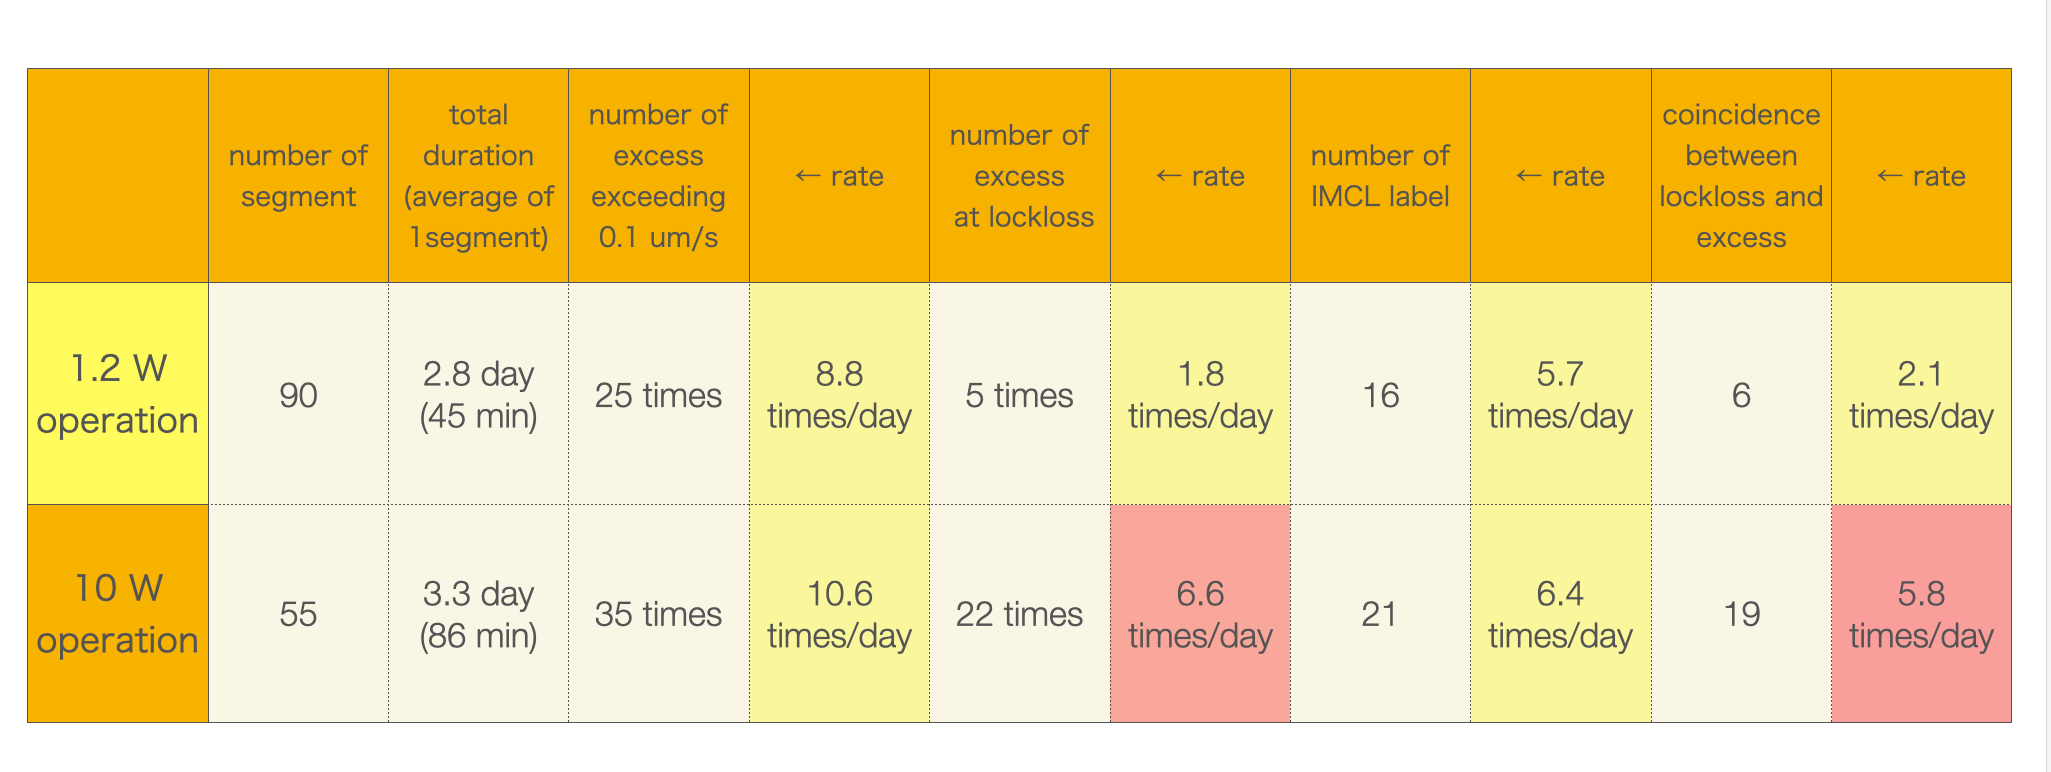
- 10 W operation: 2025/04/06 ~ 04/21
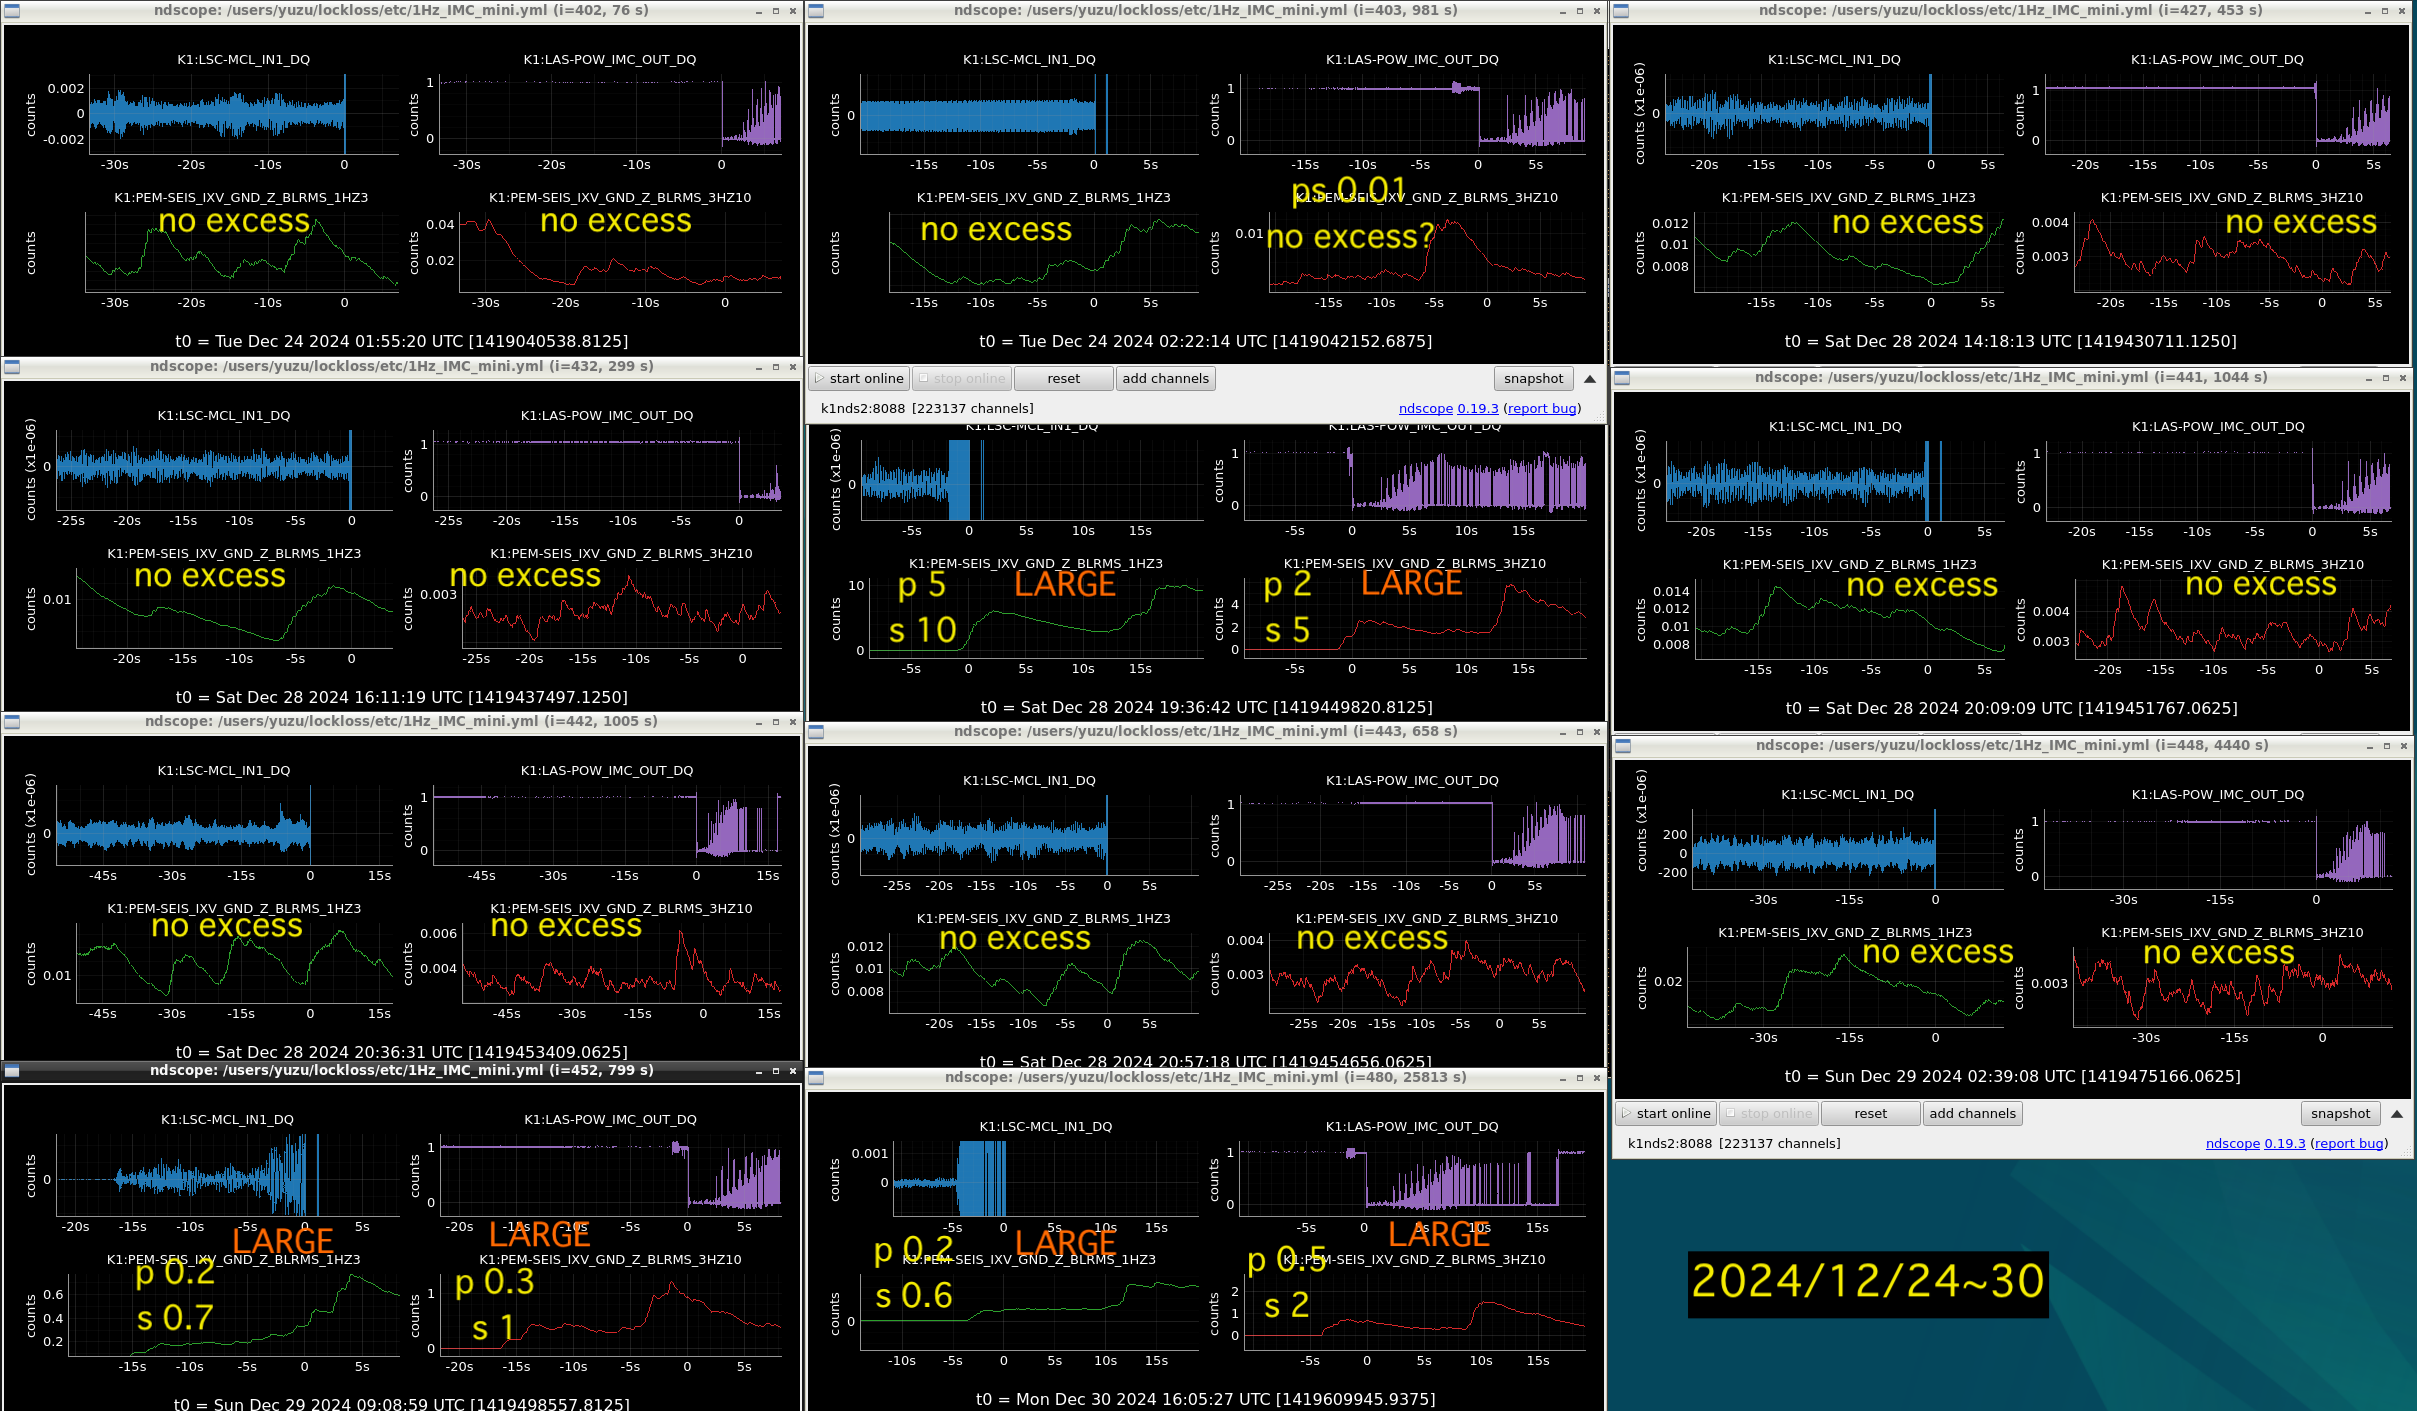
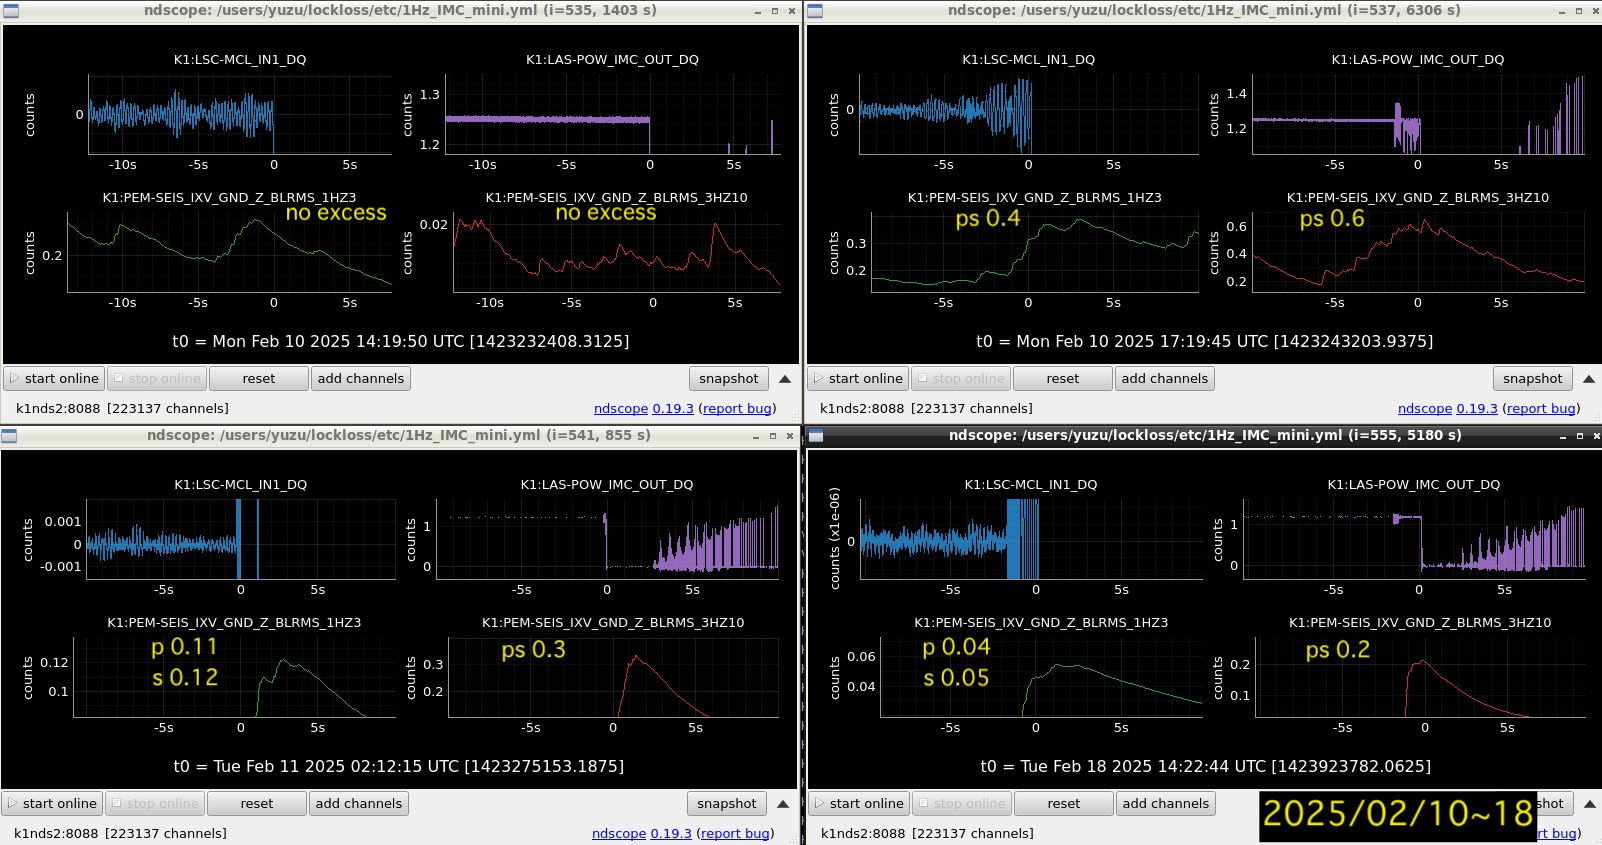
- 1.2 W operation: 2025/12/24 ~ 12/30, 2025/02/10 ~ 02/18
Result
During 10 W operation, there were 21 lockloss with the IMCL label. 19 lockloss coincided with an excess of the seismic motion of 1~10 Hz bands.
During 1.2 W operation, there were 16 lockloss with the IMCL label. 6 lockloss coincided with an excess of the seismic motion of 1~10 Hz bands.
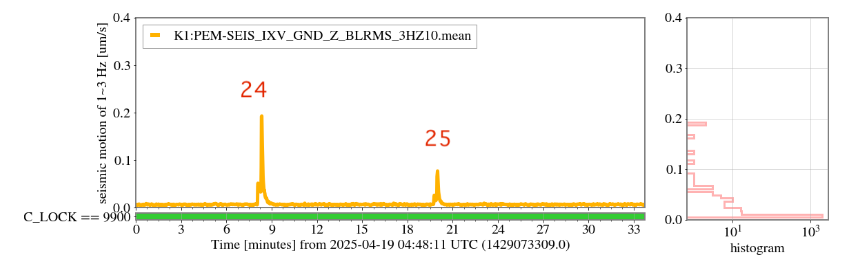
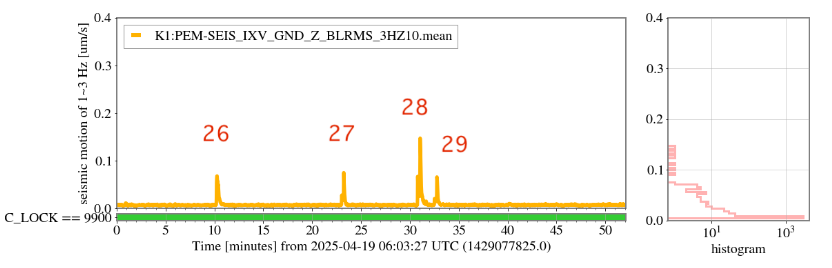
We collected the seismic motion data of the 3~10 Hz band around the lockloss. Actually, we checked both frequency bands of 1~3 Hz and 3~10 Hz. The excess of the 3~10 Hz frequency band looks to be the dominant source of the oscillation of the IMC length.
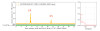
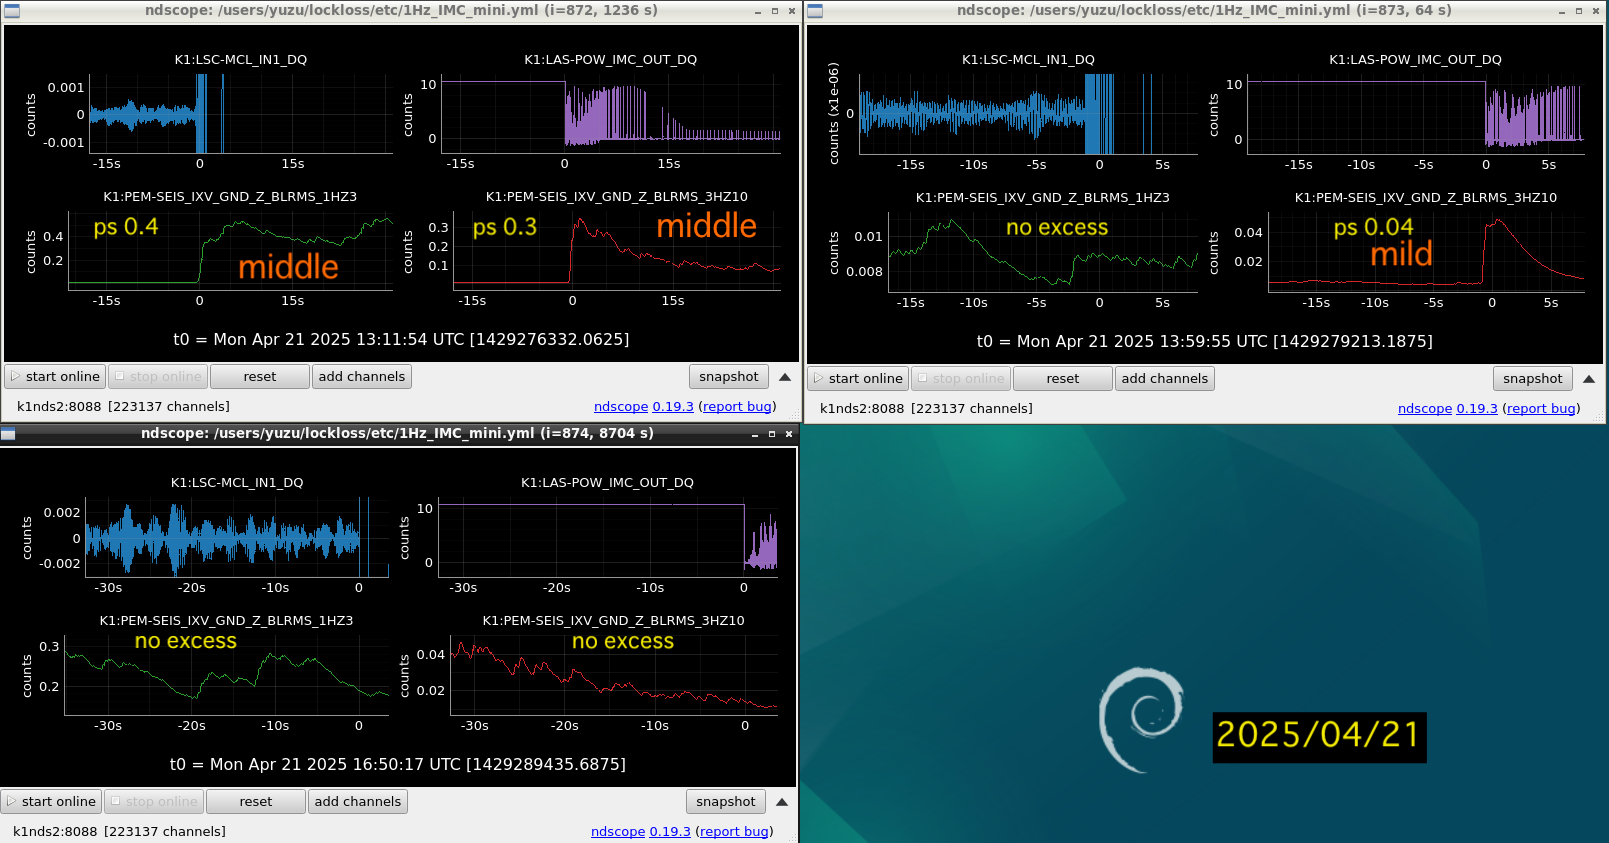
In some cases, we observed the two-step peaks due to the p-wave and s-wave (for example, the lockloss of 2024/12/28 19:36:42 UTC), and we recorded the peak value closer to the lockloss.
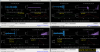
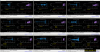
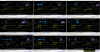
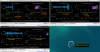
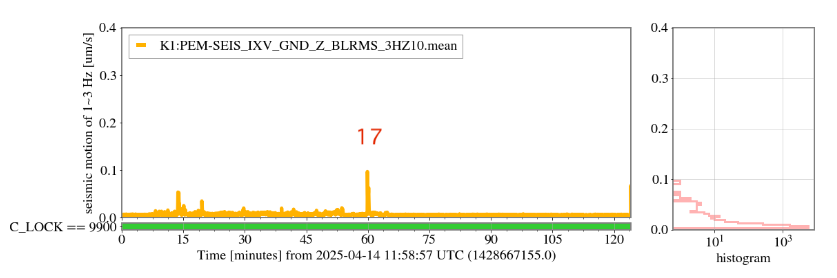
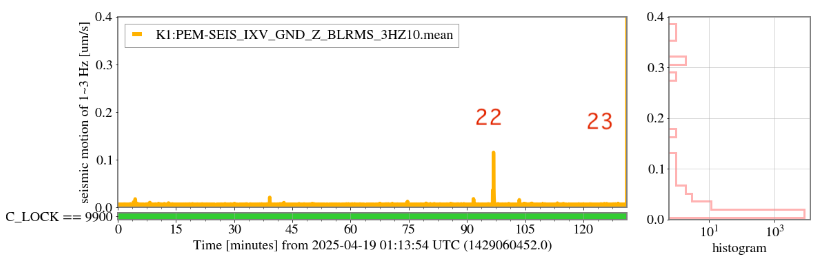
Figures 1~5 show the time series around the lockloss and peak value of the seismic motion.
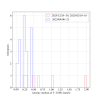
Figure 6 shows the histogram of the peak amplitudes for two periods.
In the case of 10 W operation, even though the seismic motion is small, such as < 0.5 um/s, the oscillation of IMC length frequently occurred, and the lockloss occurred.
In the case of 1.2 W operation, the IMC length oscillation didn't happen frequently. It makes a smaller number of lockloss with the IMCL label (6 times).
Next week, I will plan to check the seismic motion of 3~10 Hz during lock and collect the excess of 3~10 Hz data that didn't make the lockloss. We can test the hypothesis if we collect many examples where the lock continued even though there was an excess of 3-10 Hz seismic motion, in 10 W operation.
And also, I will check the frequency of occurrence of the excess 3~10 Hz at 2024/12, 2025/02, and 2025/04. It's possible that the seismic motion of 3~10 Hz occurred frequently in April.


