[Tanaka, Fujimoto, Saito]
To observe the beat signal with the RFPD installed at OMC REFL, the vertical axis of the spectrum analyzer was set to a linear scale, and the number of frame averages was increased to make the peak height and frequency easier to identify. During the observation, the beat frequency occasionally shifted toward lower frequencies, sometimes as often as once every few seconds. The No. 3 sub-laser used in this experiment (as identified in the JGW DOC documentation) is known to exhibit frequency-noise events that increase its RMS frequency noise approximately once every 5 s to 2 min, and the occurrence rate closely matched that of the observed beat-frequency shifts. Therefore, these frequency shifts are considered to originate from the frequency noise of the sub-laser. The beat-signal amplitude also fluctuated, which is believed to be caused by fluctuations of PRX. Accordingly, when the beat signal was stable, the LO frequency was varied, and the minimum and maximum frequencies at which the beat-signal amplitude reached its maximum were measured around 160 MHz, 140 MHz, −160 MHz, and −140 MHz. Fitting these measurements yielded a PRX length of 68.27 ± 0.01 m, compared with the design value of 68.2563 m.
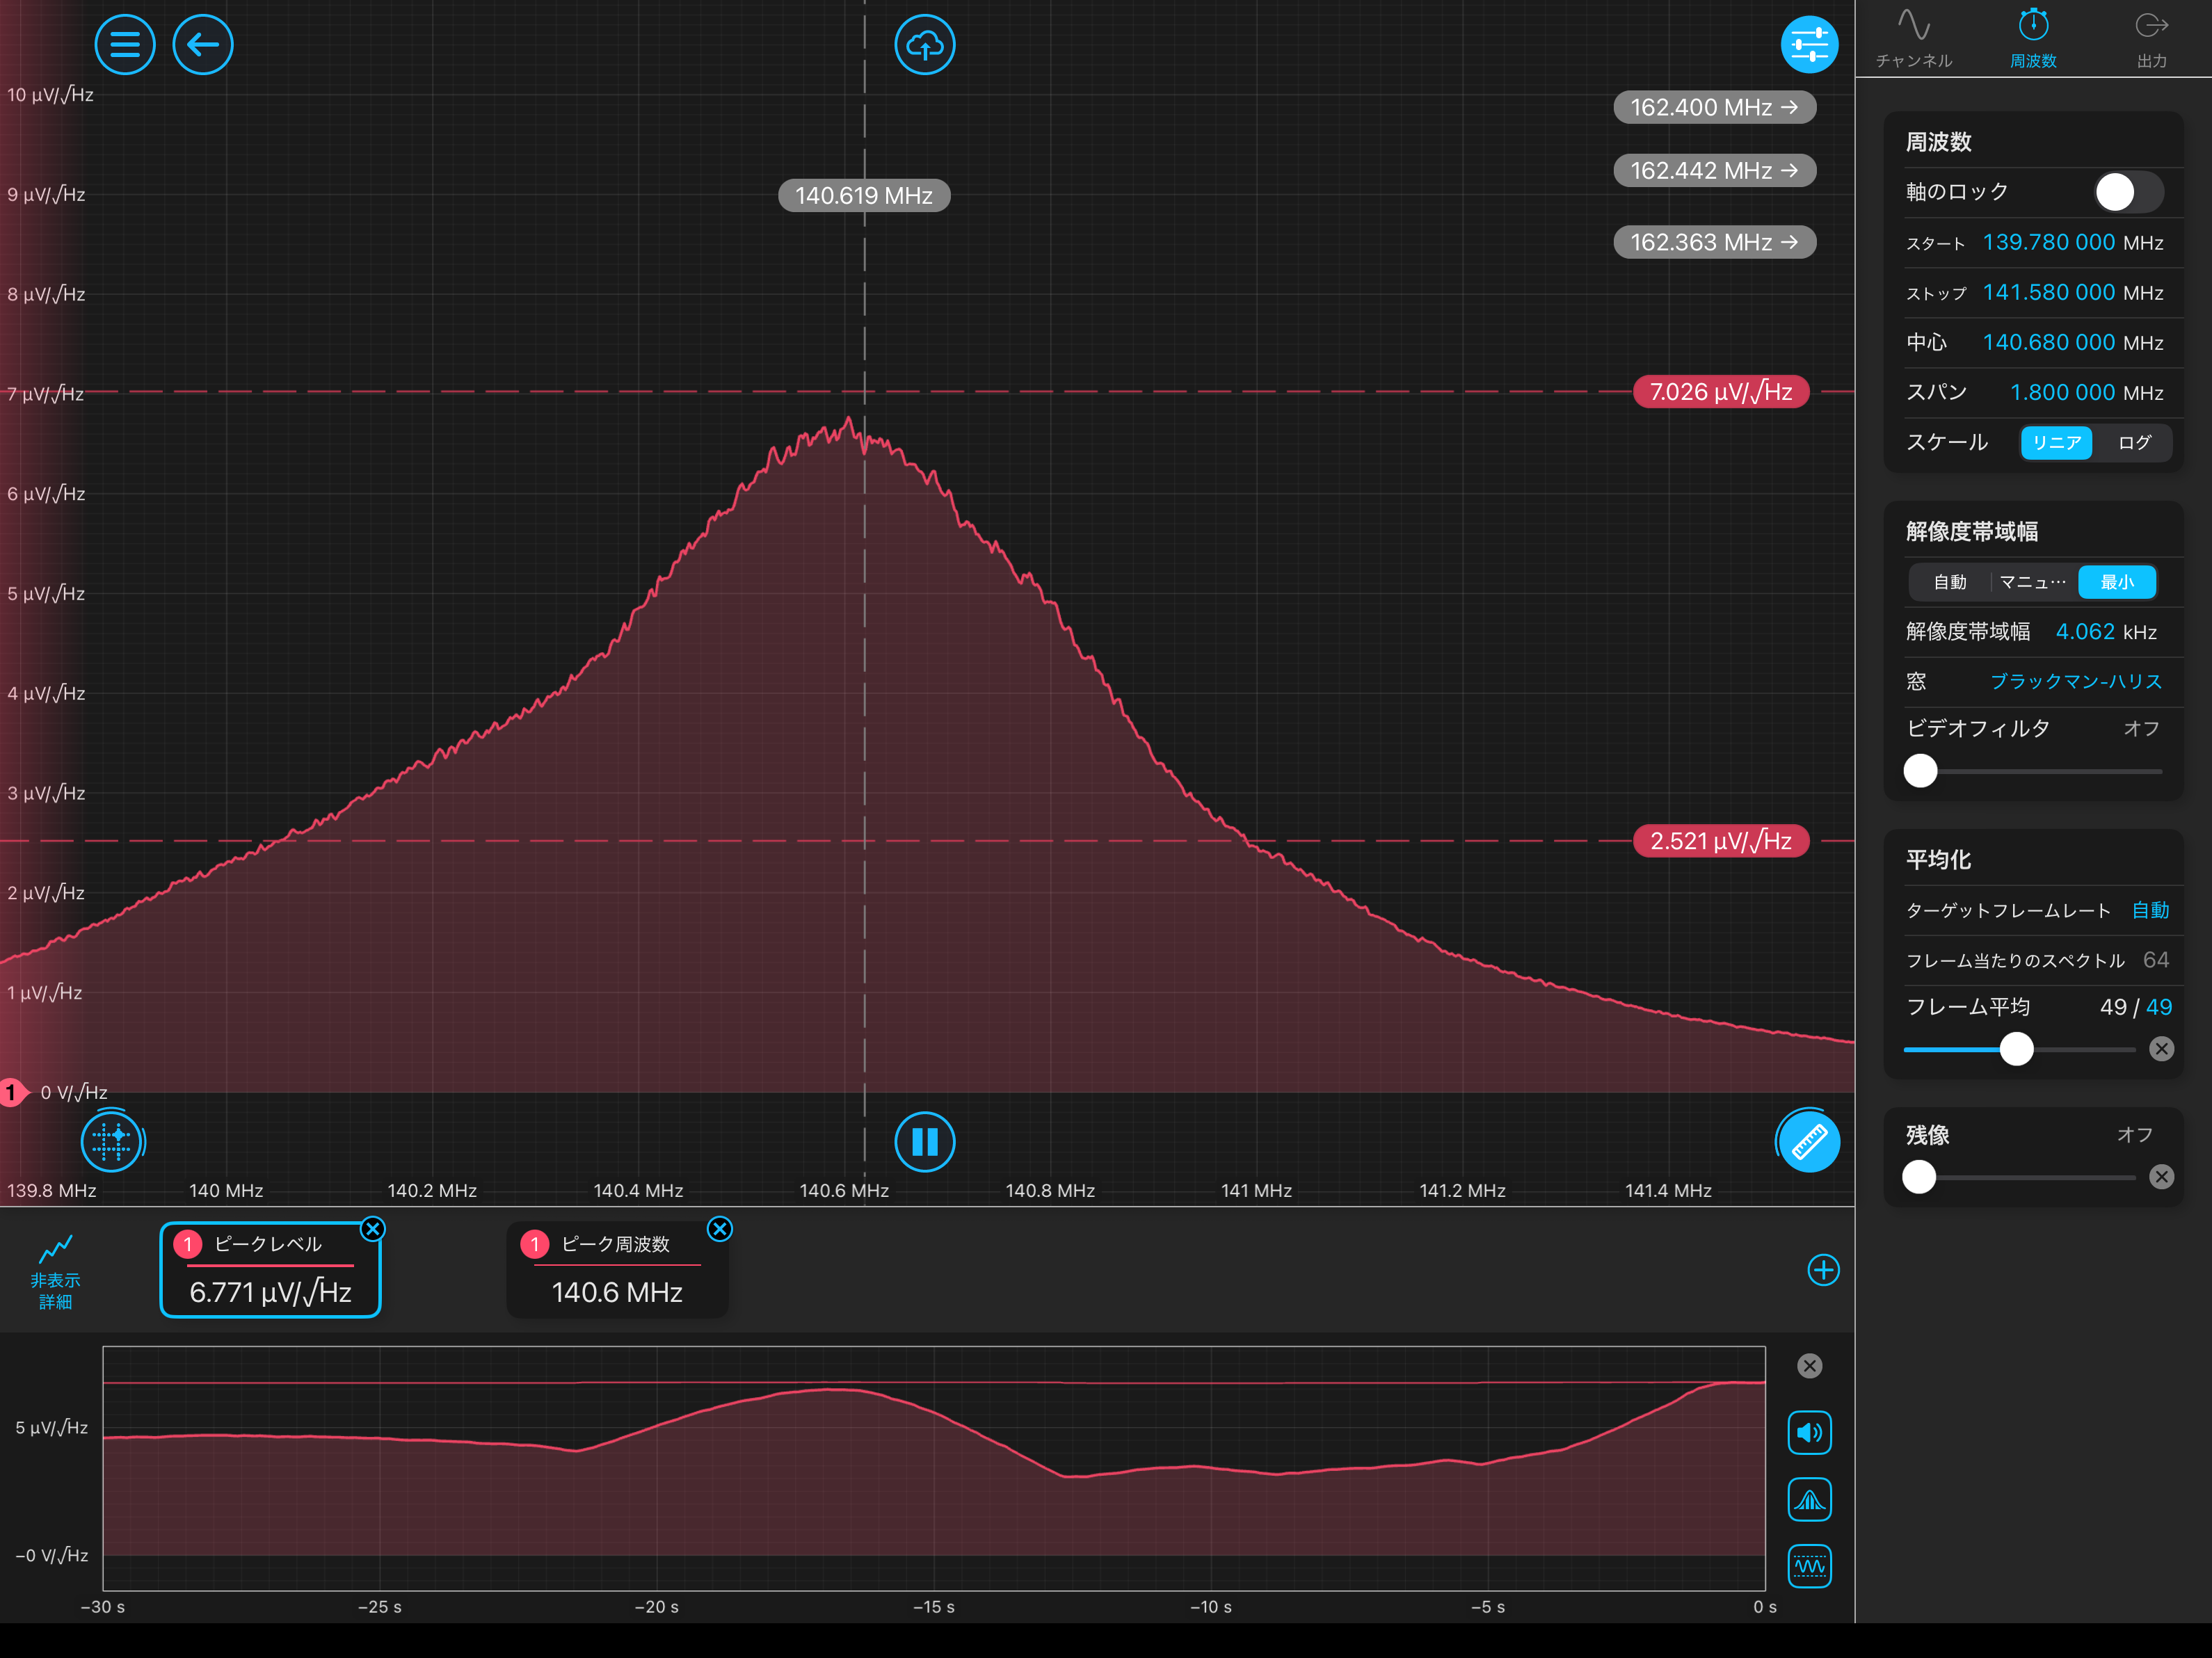
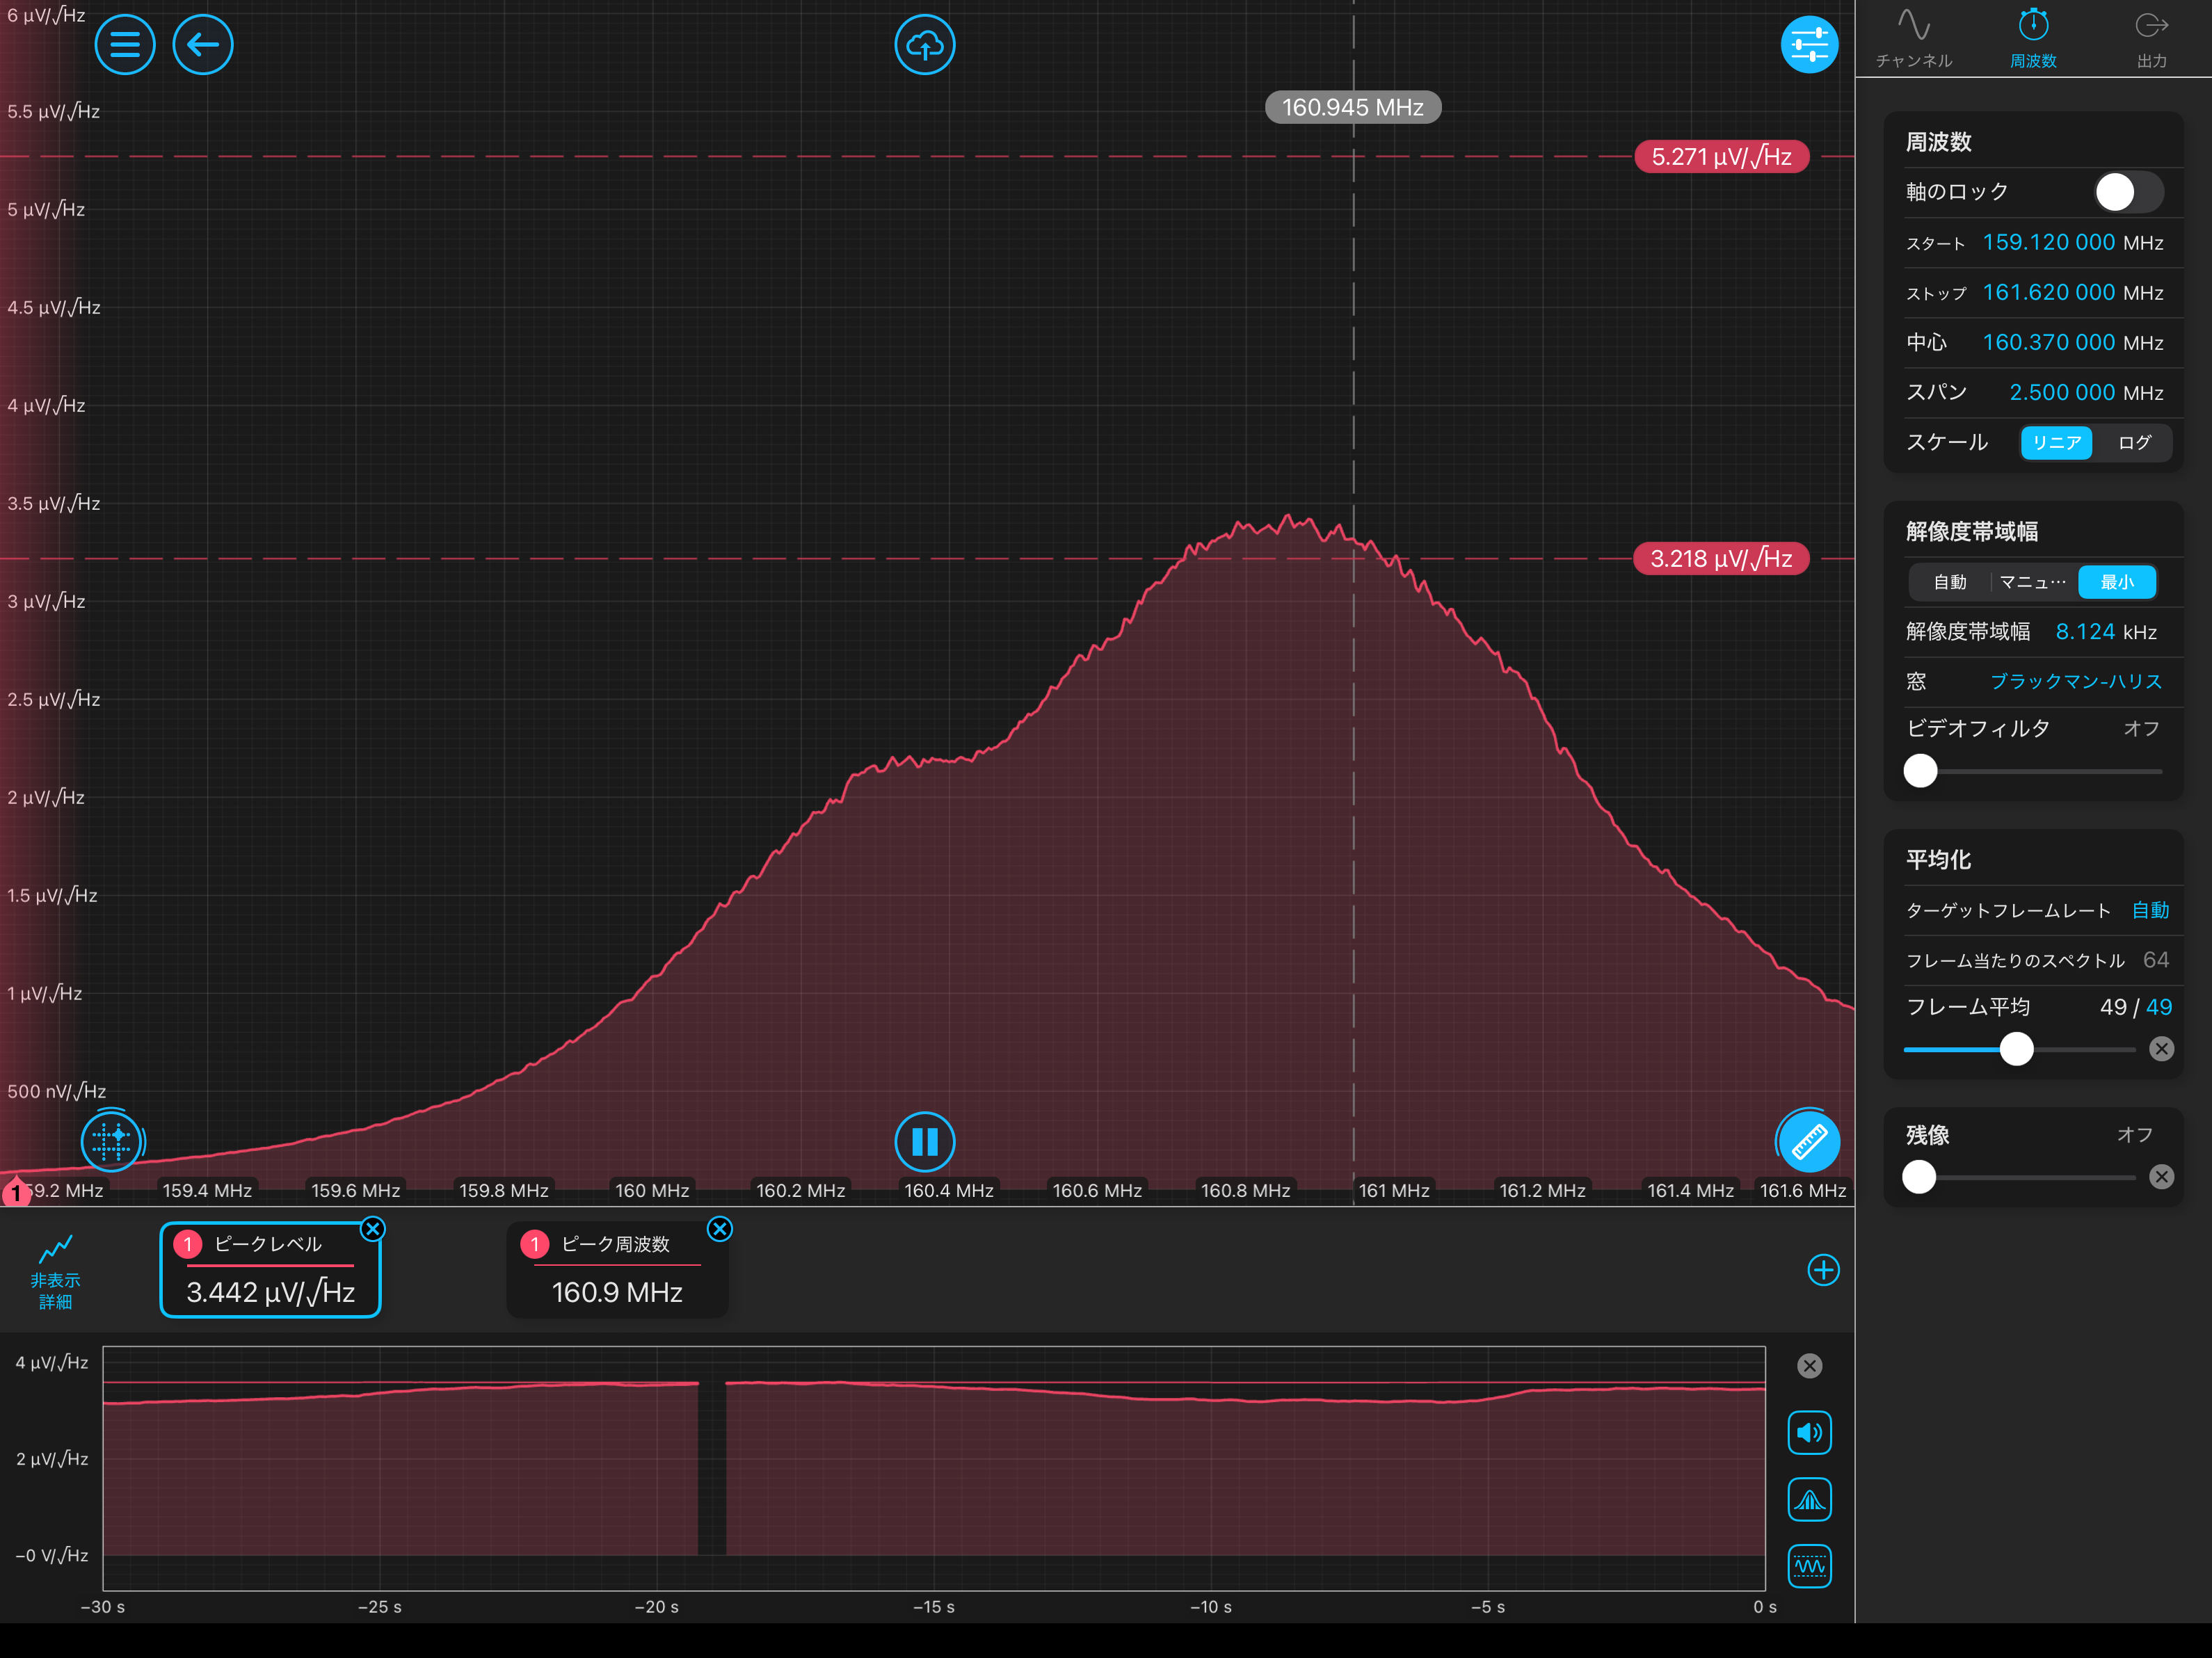
- The sub-laser was injected into PRX, the PLL was engaged, and the beat signal was observed with the RFPD installed at OMC REFL. The objective was to determine the minimum and maximum frequencies at which the beat-signal amplitude reached its maximum. For this purpose, the vertical axis of the spectrum analyzer was set to a linear scale, and the number of frame averages was increased to improve the visibility of the peak height and frequency. By varying the PLL LO frequency, both the resonance point (Fig. 1) and the anti-resonance point (Fig. 2) were observed. At the anti-resonance point, however, the beat-signal peak appeared to split into two peaks.
- During the measurements, the beat frequency occasionally shifted toward lower frequencies, sometimes as often as once every few seconds. The beat signal in the PLL path exhibited the same frequency shift. Initially, fluctuations of the Moku:Lab LO signal were suspected, so the LO source was switched from the Moku:Lab to the function generator that had originally been used. However, no change was observed. Fluctuations of the main laser were also considered, and an additional control loop was applied to suppress them, but this likewise produced no improvement. On the other hand, the No. 3 sub-laser used in this experiment (as described in the JGW DOC documentation) is known to exhibit frequency-noise events that increase its RMS frequency noise approximately once every 5 s to 2 min, and the occurrence rate closely matched that of the observed beat-frequency shifts. Therefore, the observed frequency shifts are considered to originate from the frequency noise of the sub-laser. The beat-signal amplitude also fluctuated, which is believed to be caused by fluctuations of PRX.
-
Therefore, when the beat signal was stable, the LO frequency was varied, and the minimum and maximum frequencies at which the beat-signal amplitude reached its maximum were measured around 160 MHz, 140 MHz, −160 MHz, and −140 MHz. Negative frequencies correspond to the case where the sub-laser frequency is lower than the main-laser frequency. The measured values are listed below.
Minimum Maximum
162.363 MHz 162.442 MHz
140.366 MHz 140.494 MHz
−140.683 MHz −140.555 MHz (assuming ±0.064 MHz around −140.619 MHz)
−160.435 MHz −160.307 MHz (assuming ±0.064 MHz around −160.371 MHz)The midpoint between the minimum and maximum frequencies was then calculated for each measurement. Each midpoint was divided by the FSR calculated from the PRX design length of 68.2563 m. The resulting values were rounded to the nearest integers, and the measured frequencies were fitted with the linear function AN+B, where A and B are fitting parameters and N is the corresponding integer. The fitting results are shown in Fig. 3 and are summarized below:
A = 2.1957 ± 0.0004 MHz
B = −0.08 ± 0.03 MHzSince A corresponds to the FSR, the PRX length calculated from the fitted FSR is
Fitted PRX length: 68.27 ± 0.01 m
Design value: 68.2563 m