Reports 1-1 of 1 Clear search Modify search
MIF (General)
takafumi.ushiba - 19:03 Monday 09 February 2026 (36322) Print this report
X arm cavity scan

Similar measurement with klog33306.

[Komori, Ushiba]

Abstract:

To measure the FSR of arm cavity, we conducted the cavity scan for X arm.
Analysis will be done tomorrow.

Detail:

To obtain the latest X arm and Y arm length, we tried to perform cavity scan of arms.
Today, we only finished X arm measurement but if the scan method is fine, we plan to perform Y arm scan with the same configuration tomorrow.

Followings are the procedure of the cavity scan.
1. Misaligned ITMY and PRM (request MISALIGNED state for ITMY guardian and MISALIGNED_BF state for PRM guardian).
2. Lock GRX by using XARM guardian (request ALS_LOCKED state).
3. Feedback ALS signals to IMC manually.
4. Increase laser power by rotating HWP at PSL.
5. Scan laser frequency by turning on/off FM1 of K1:ALS-SUM_OFS_SLOWOUT_CALI filter bank.

We modified the ramp time of FM1 of K1:ALS-SUM_OFS_SLOWOUT_CALI filter bank to make the scan speed about 1 kHz/s (100 seconds for ~2 FSR).
The start time of the scan is 8:20:04 UTC and 8:29:10 UTC for forward and backward scans, respectively.
Figure 1 and 2 shows the scan results when increasing and decreasing the offsets, respectively.

It is hard to see the sideband signals in transmission but PDH signals can be seen clearly, so probably this scan can be used for the analysis.
The analysis will be done tomorrow.

Note:

First, I tried to perform cavity scan for X and Y arm at the same time by closing laser shutter for GRY and did not misalign ITMY.
However, maybe due to the coupling between MICH fringes and photosensor signals, ITMX and ITMY were kicked a lot when increasing IMC output power.
So, we gave up scaning X and Y arm at the same time.

Followings are the detailed procedure to feedback ALS signals to IMC manually.
1. change K1:LSC-MCL_GAIN to 1.
2. Turn on FM4 of K1:LSC-MCL filter bank.
3. Close K1:IMC-SERVO_IN2EN switch.
4. Turn off FM2 of K1:LSC-MCL filter bank.
5. Increase K1:LSC-CARM_SERVO_IN2GAIN to 15.
6. Turn on 1st and 2nd K1:IMC-SERVO_COMBOOST.
7. Turn on FM5 of K1:LSC-MCL filter bank.

Diaggui files are stored at /users/Commissioning/data/XARM/2026/0209/.

Images attached to this report
Comments to this report:
Alexandra Adam - 10:37 Friday 13 February 2026 (36346) Print this report
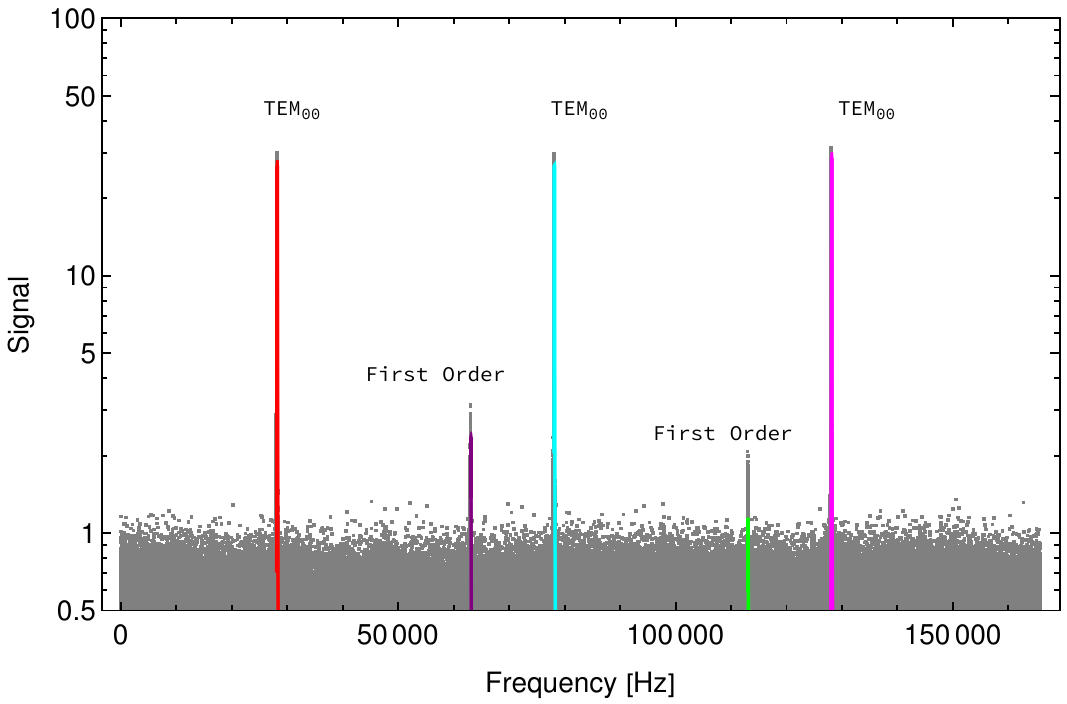
I have been analyzing the data from the cavity scan in order to estimate the free spectral range and length of the x-arm. I fitted the peaks visible in the TMS-X_IR_PDA1_OUT_DQ channel with Lorentzian curves. There are three large peaks visible which correspond to the fundamental modes at around 20s, 56s and 93s with two smaller peaks at 45s and 81s.

I used the error signals from the demodulated 17MHz signal (LSC-AS_PDA1_RF17_Q_ERR_DQ) and the demodulated 45MHz signal (LSC-REFL_PDA1_RF45_I_ERR_DQ) as frequency reference points in order to calibrate the scan rate into frequency.

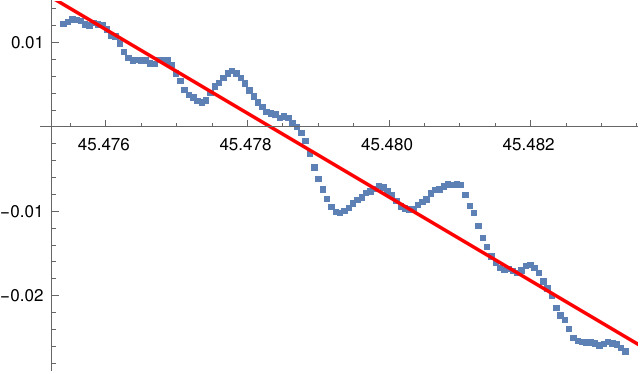
The 17MHz modulation beats with the FSR to produce sidebands at 34kHz and the 45MHz modulation beats with the FSR to produce sidebands at 25 kHz. Since we know the modulation frequency very well we can use the distance from the modulation sidebands to the fundamental modes to calibrate the scan. I found the frequency of the modulation sidebands by finding the zero crossing of the error signal (image below). This was done with a linear fit on the data around each zero crossing. This proved difficult with the 45MHz modulation sidebands since they are very close together (~2kHz separation ) and so the zero crossing for some of the sidebands was not well defined.

The distance in time between the fundamental modes was calculated using the fitted lorentzians on and was found to be 36.17 seconds. The relationship between the modulation sideband frequency and the FSR is linear and does not wrap for +/- 1m around the known cavity length so a linear fit can be use.

This gives a time to frequency conversion factor of 1381.41 Hz/s

Using the 17MHz error signal gave an FSR of: 49965.561 Hz and a cavity length of: 2999.991 m
Using the 45MHz error signal gave an FSR of: 49965.626 Hz and a cavity length of 2999.987 m
The estimates differ from each other by 0.06 Hz for the FSR which corresponds to cavity length difference of 4 mm

From the lorenztian fit the linewidth of the fundamental mode was found to be: 42.33 Hz which corresponds to a finesse of 1180
The smaller peaks occurred at 34.909 kHz and so were identified as the first order mode which from theory is at 34.7 kHz and had a linewidth of 77.5 Hz

Mathematica notebook available here: https://www.wolframcloud.com/obj/b839db43-042b-4548-abd4-ebe7c5bed996
Images attached to this comment
Non-image files attached to this comment
Search Help
×

Warning

×