Reports 1-1 of 1 Clear search Modify search
MIF (General)
Chia-Jui Chou - 1:02 Tuesday 24 June 2025 (34352) Print this report
Noise Subtraction Results using ICA on KAGRA Data

[Shu-Wei Yeh, Chia-Jui Chou]

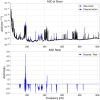
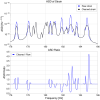
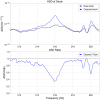
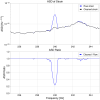
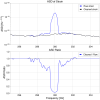
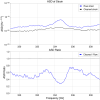
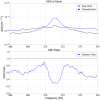
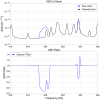
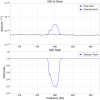
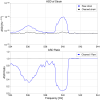
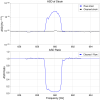
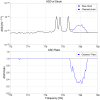
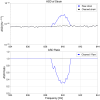
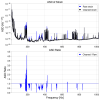
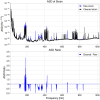
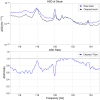
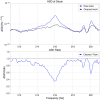
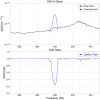
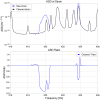
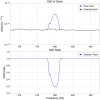
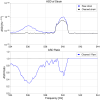
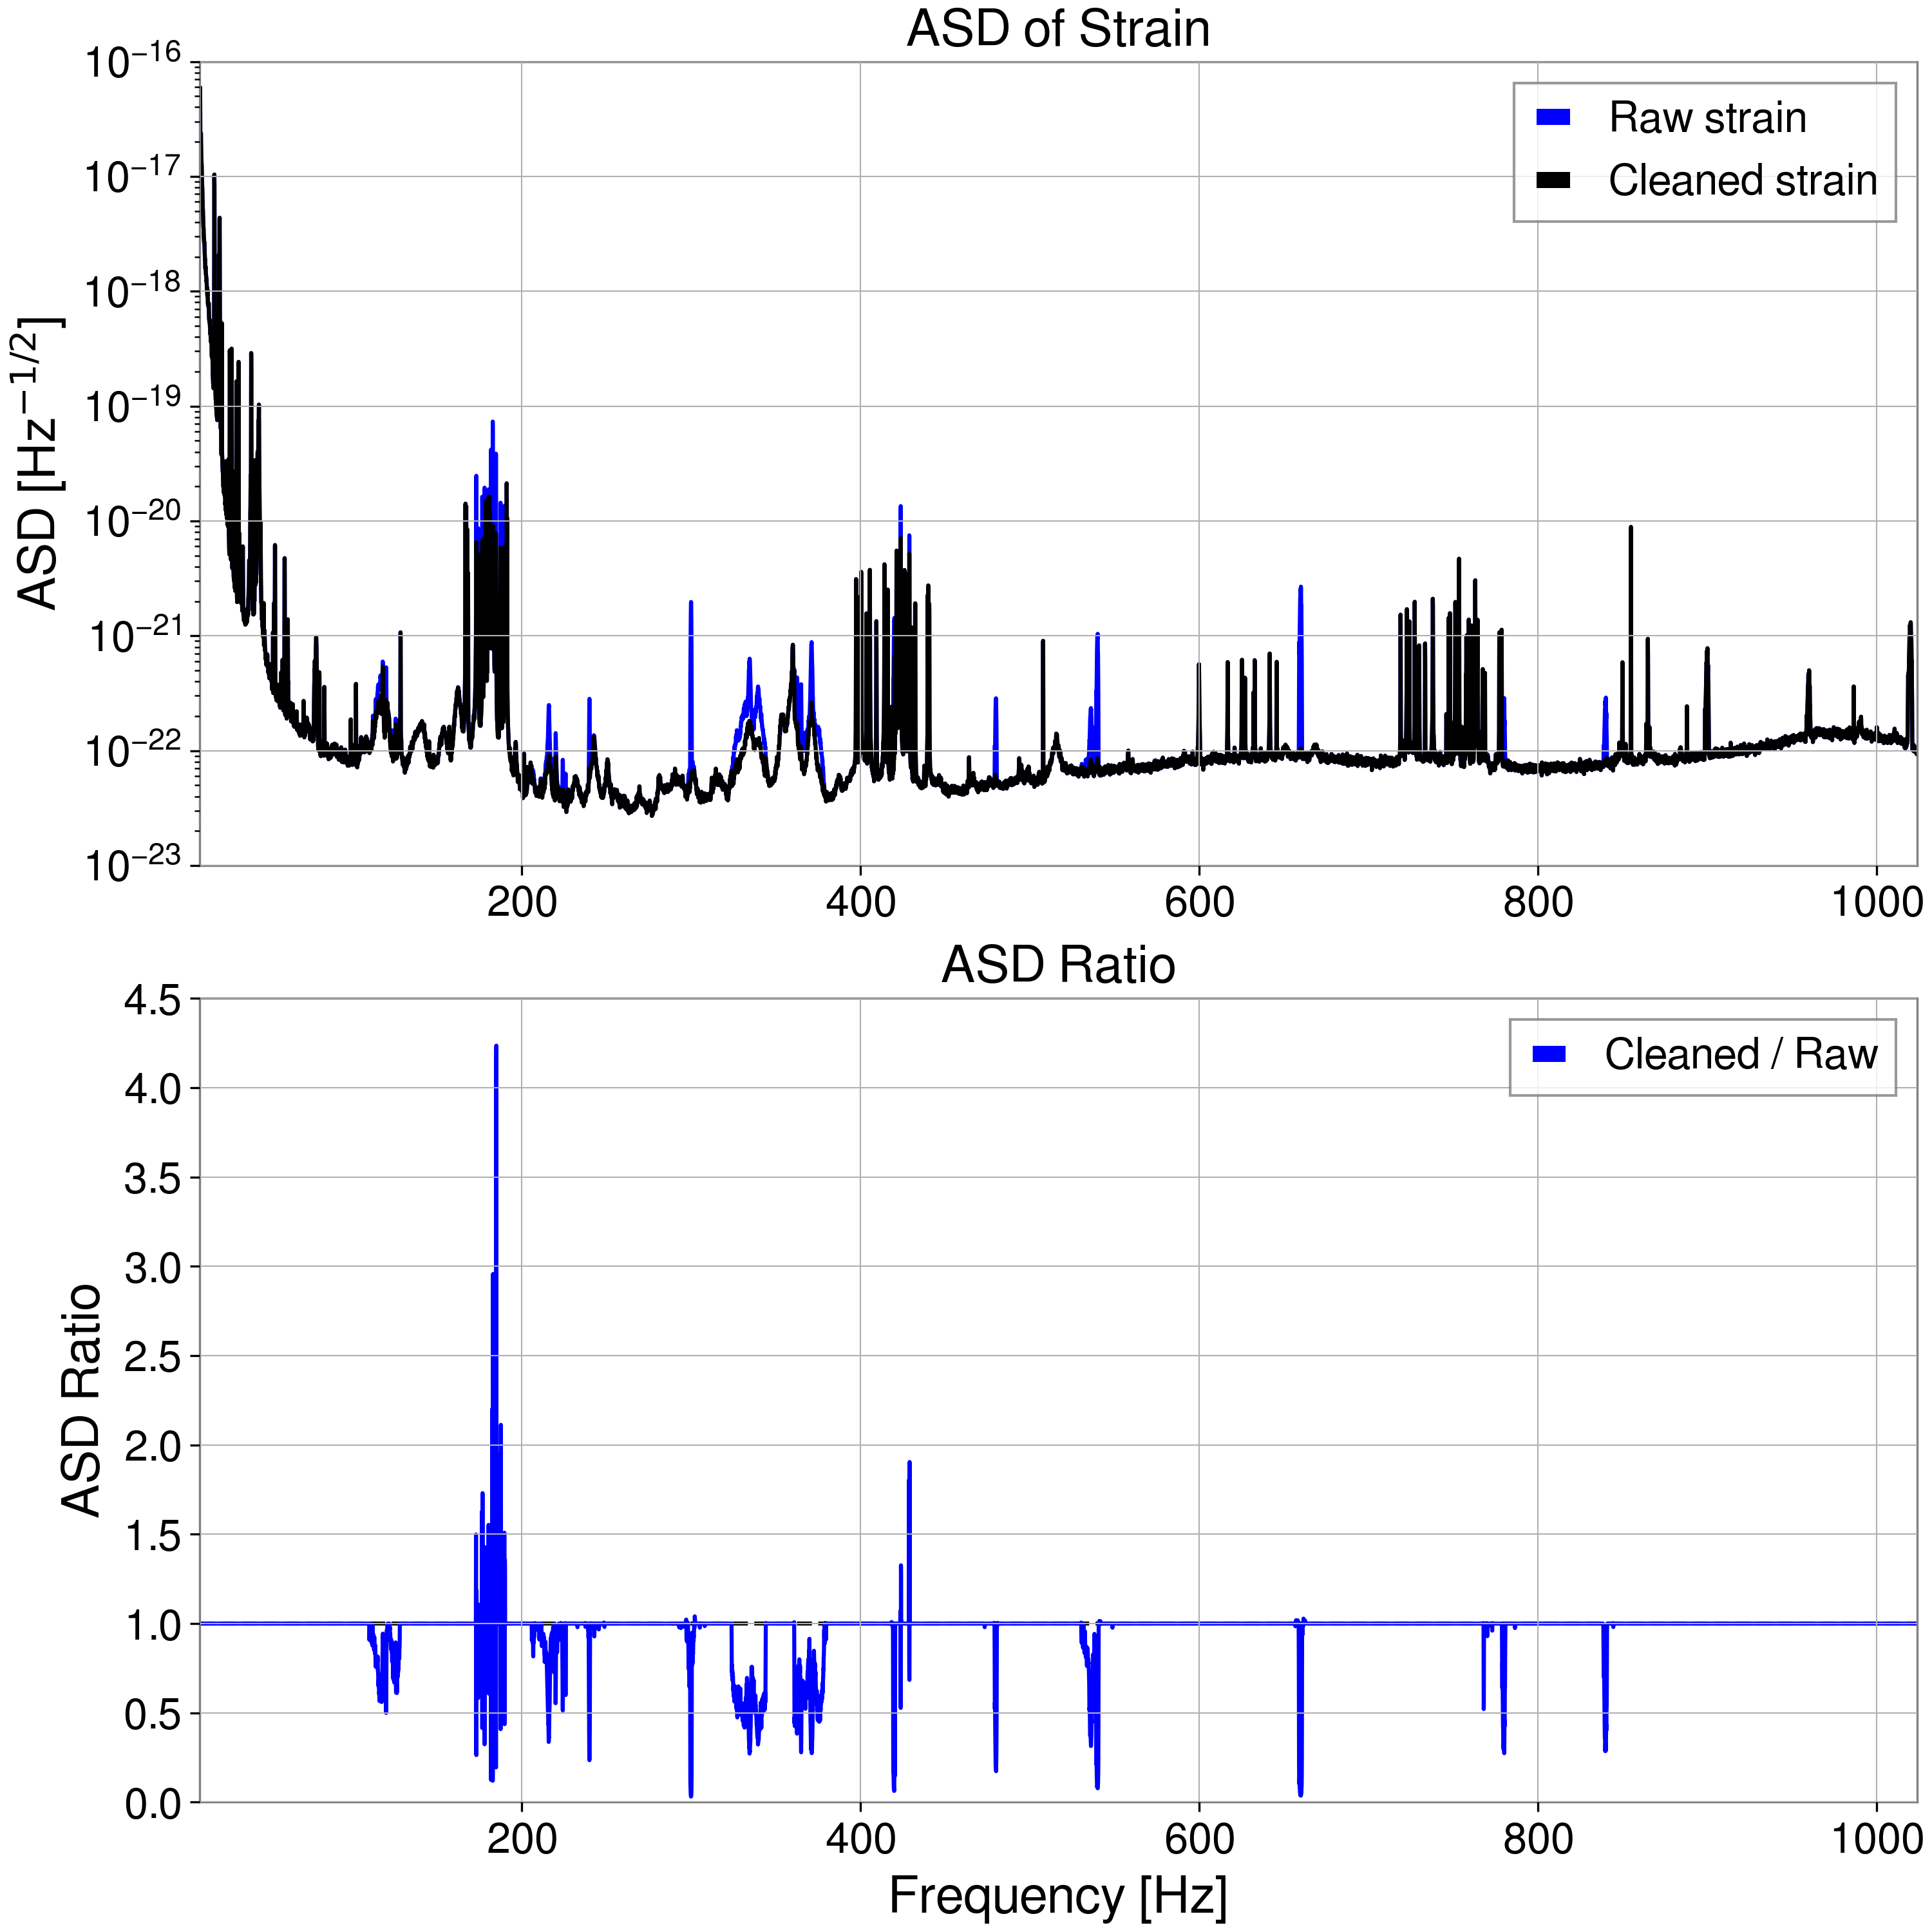
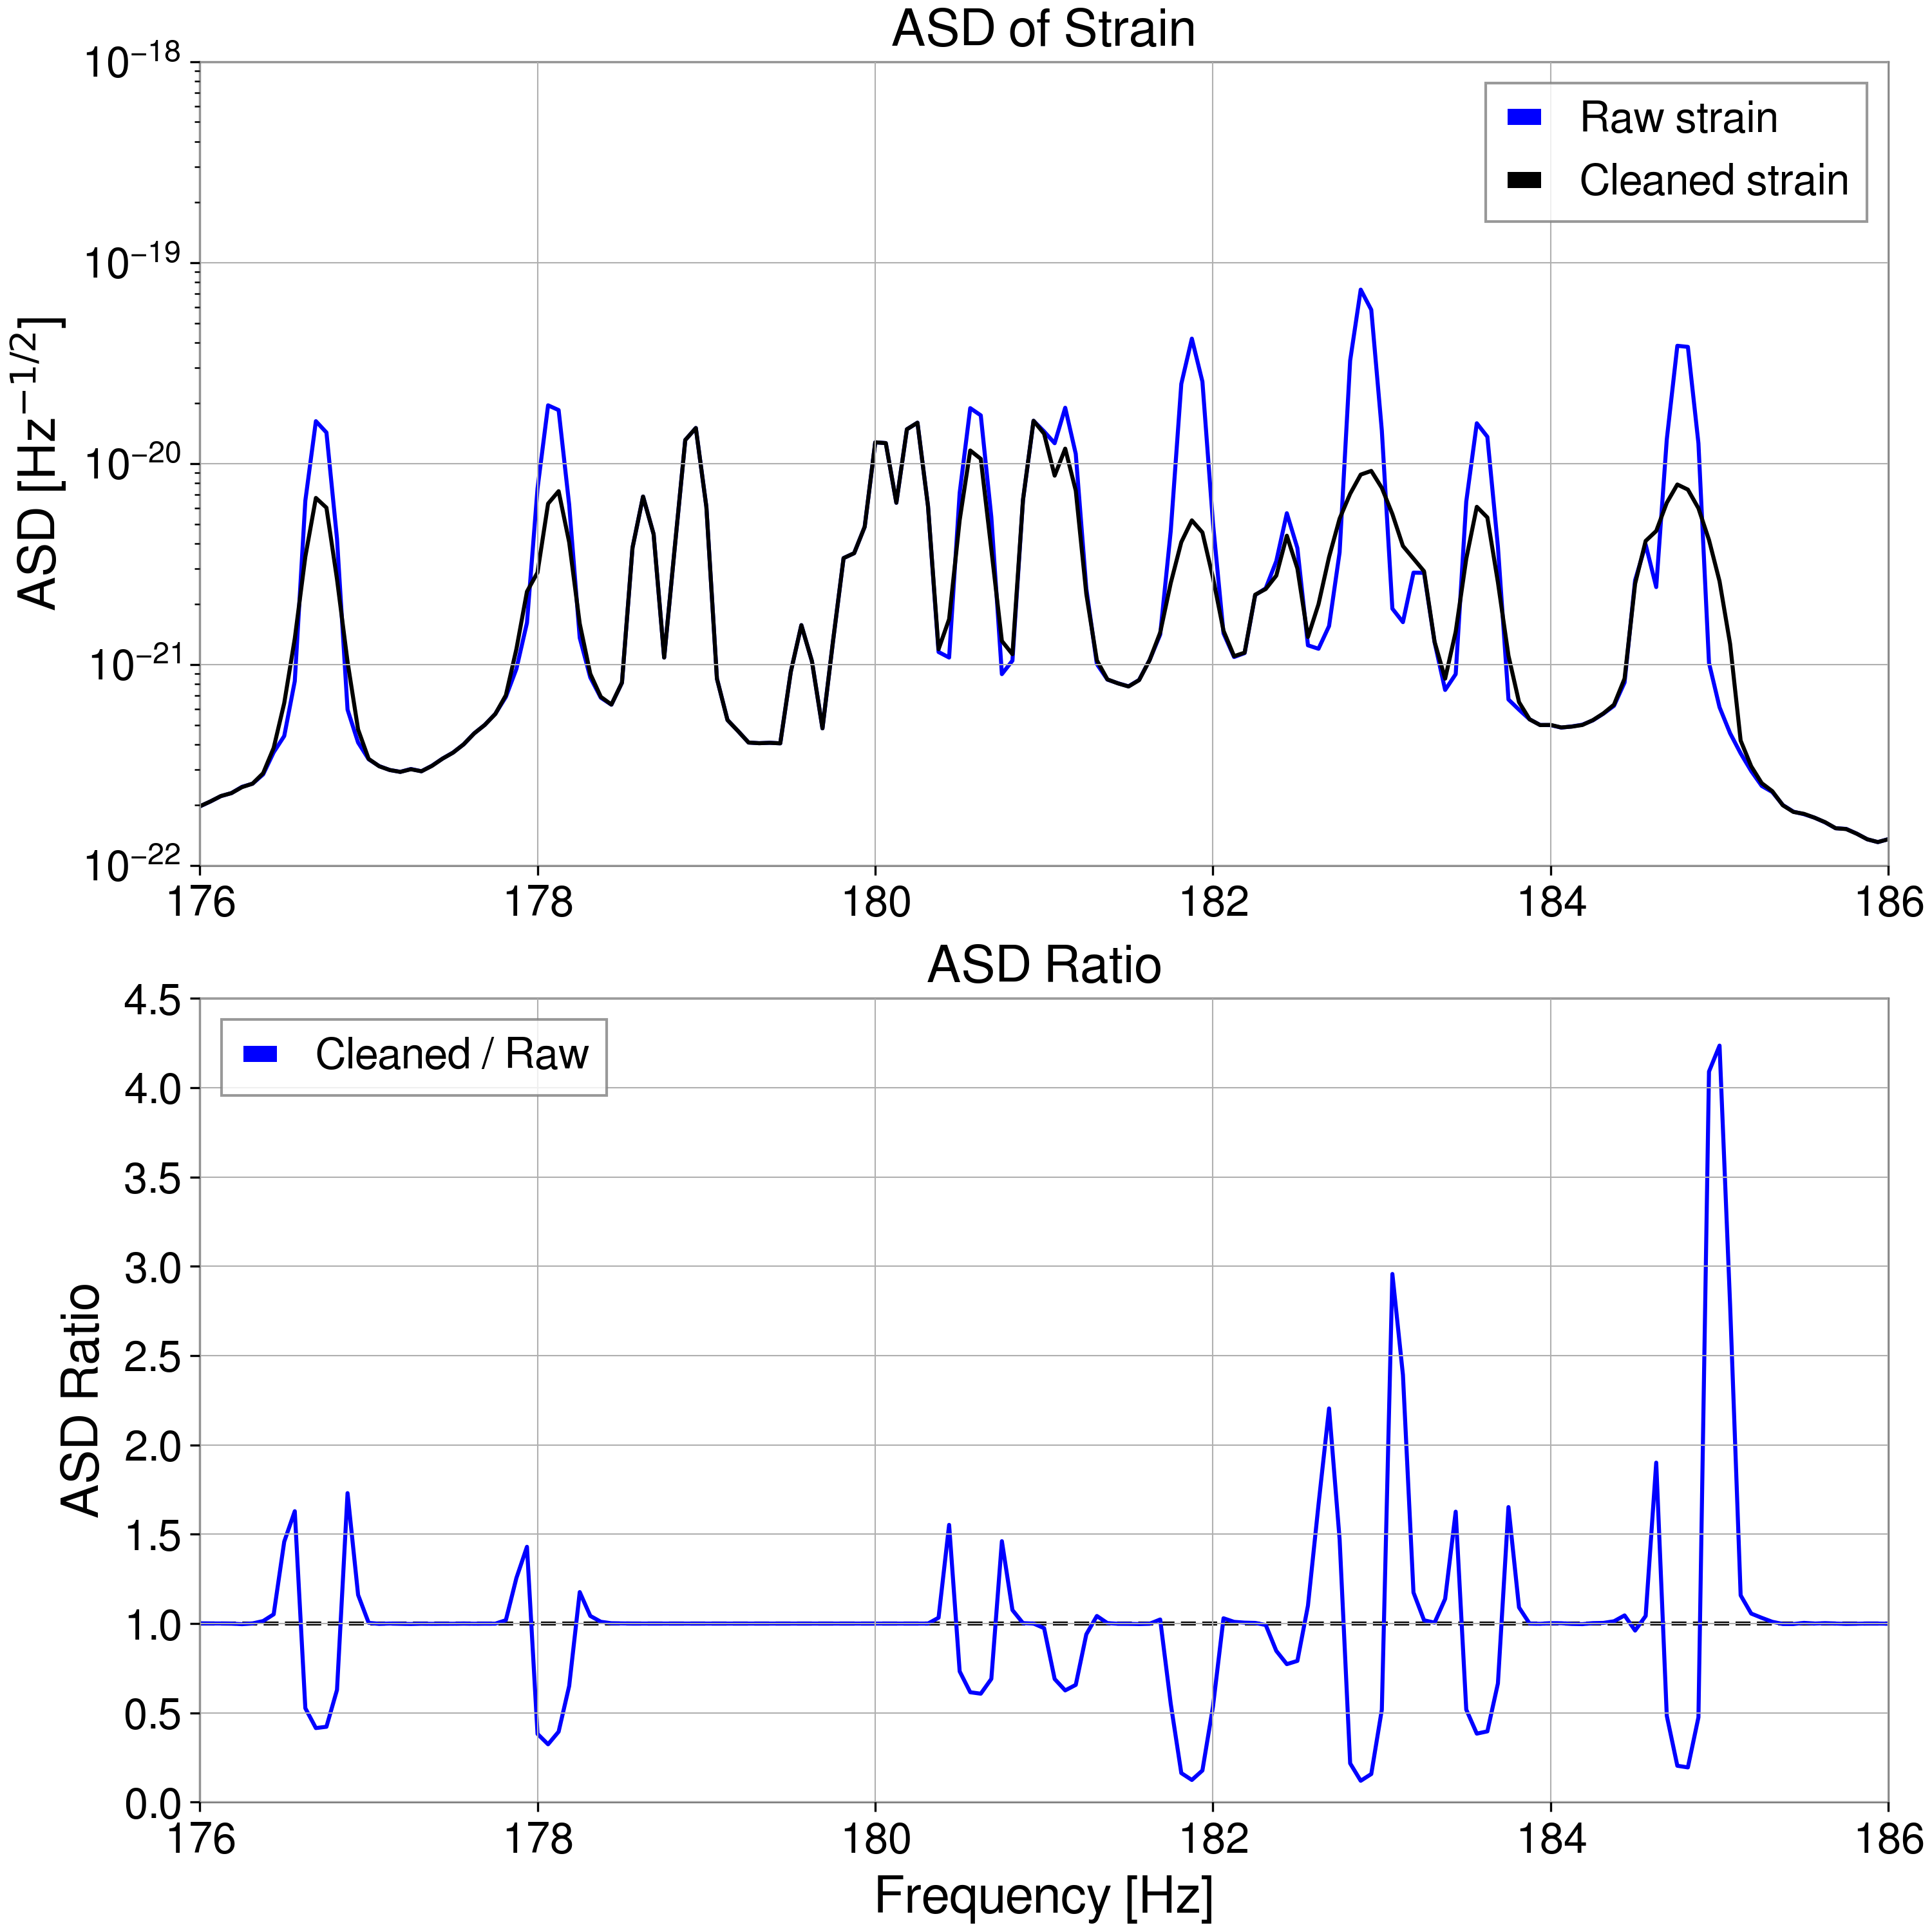
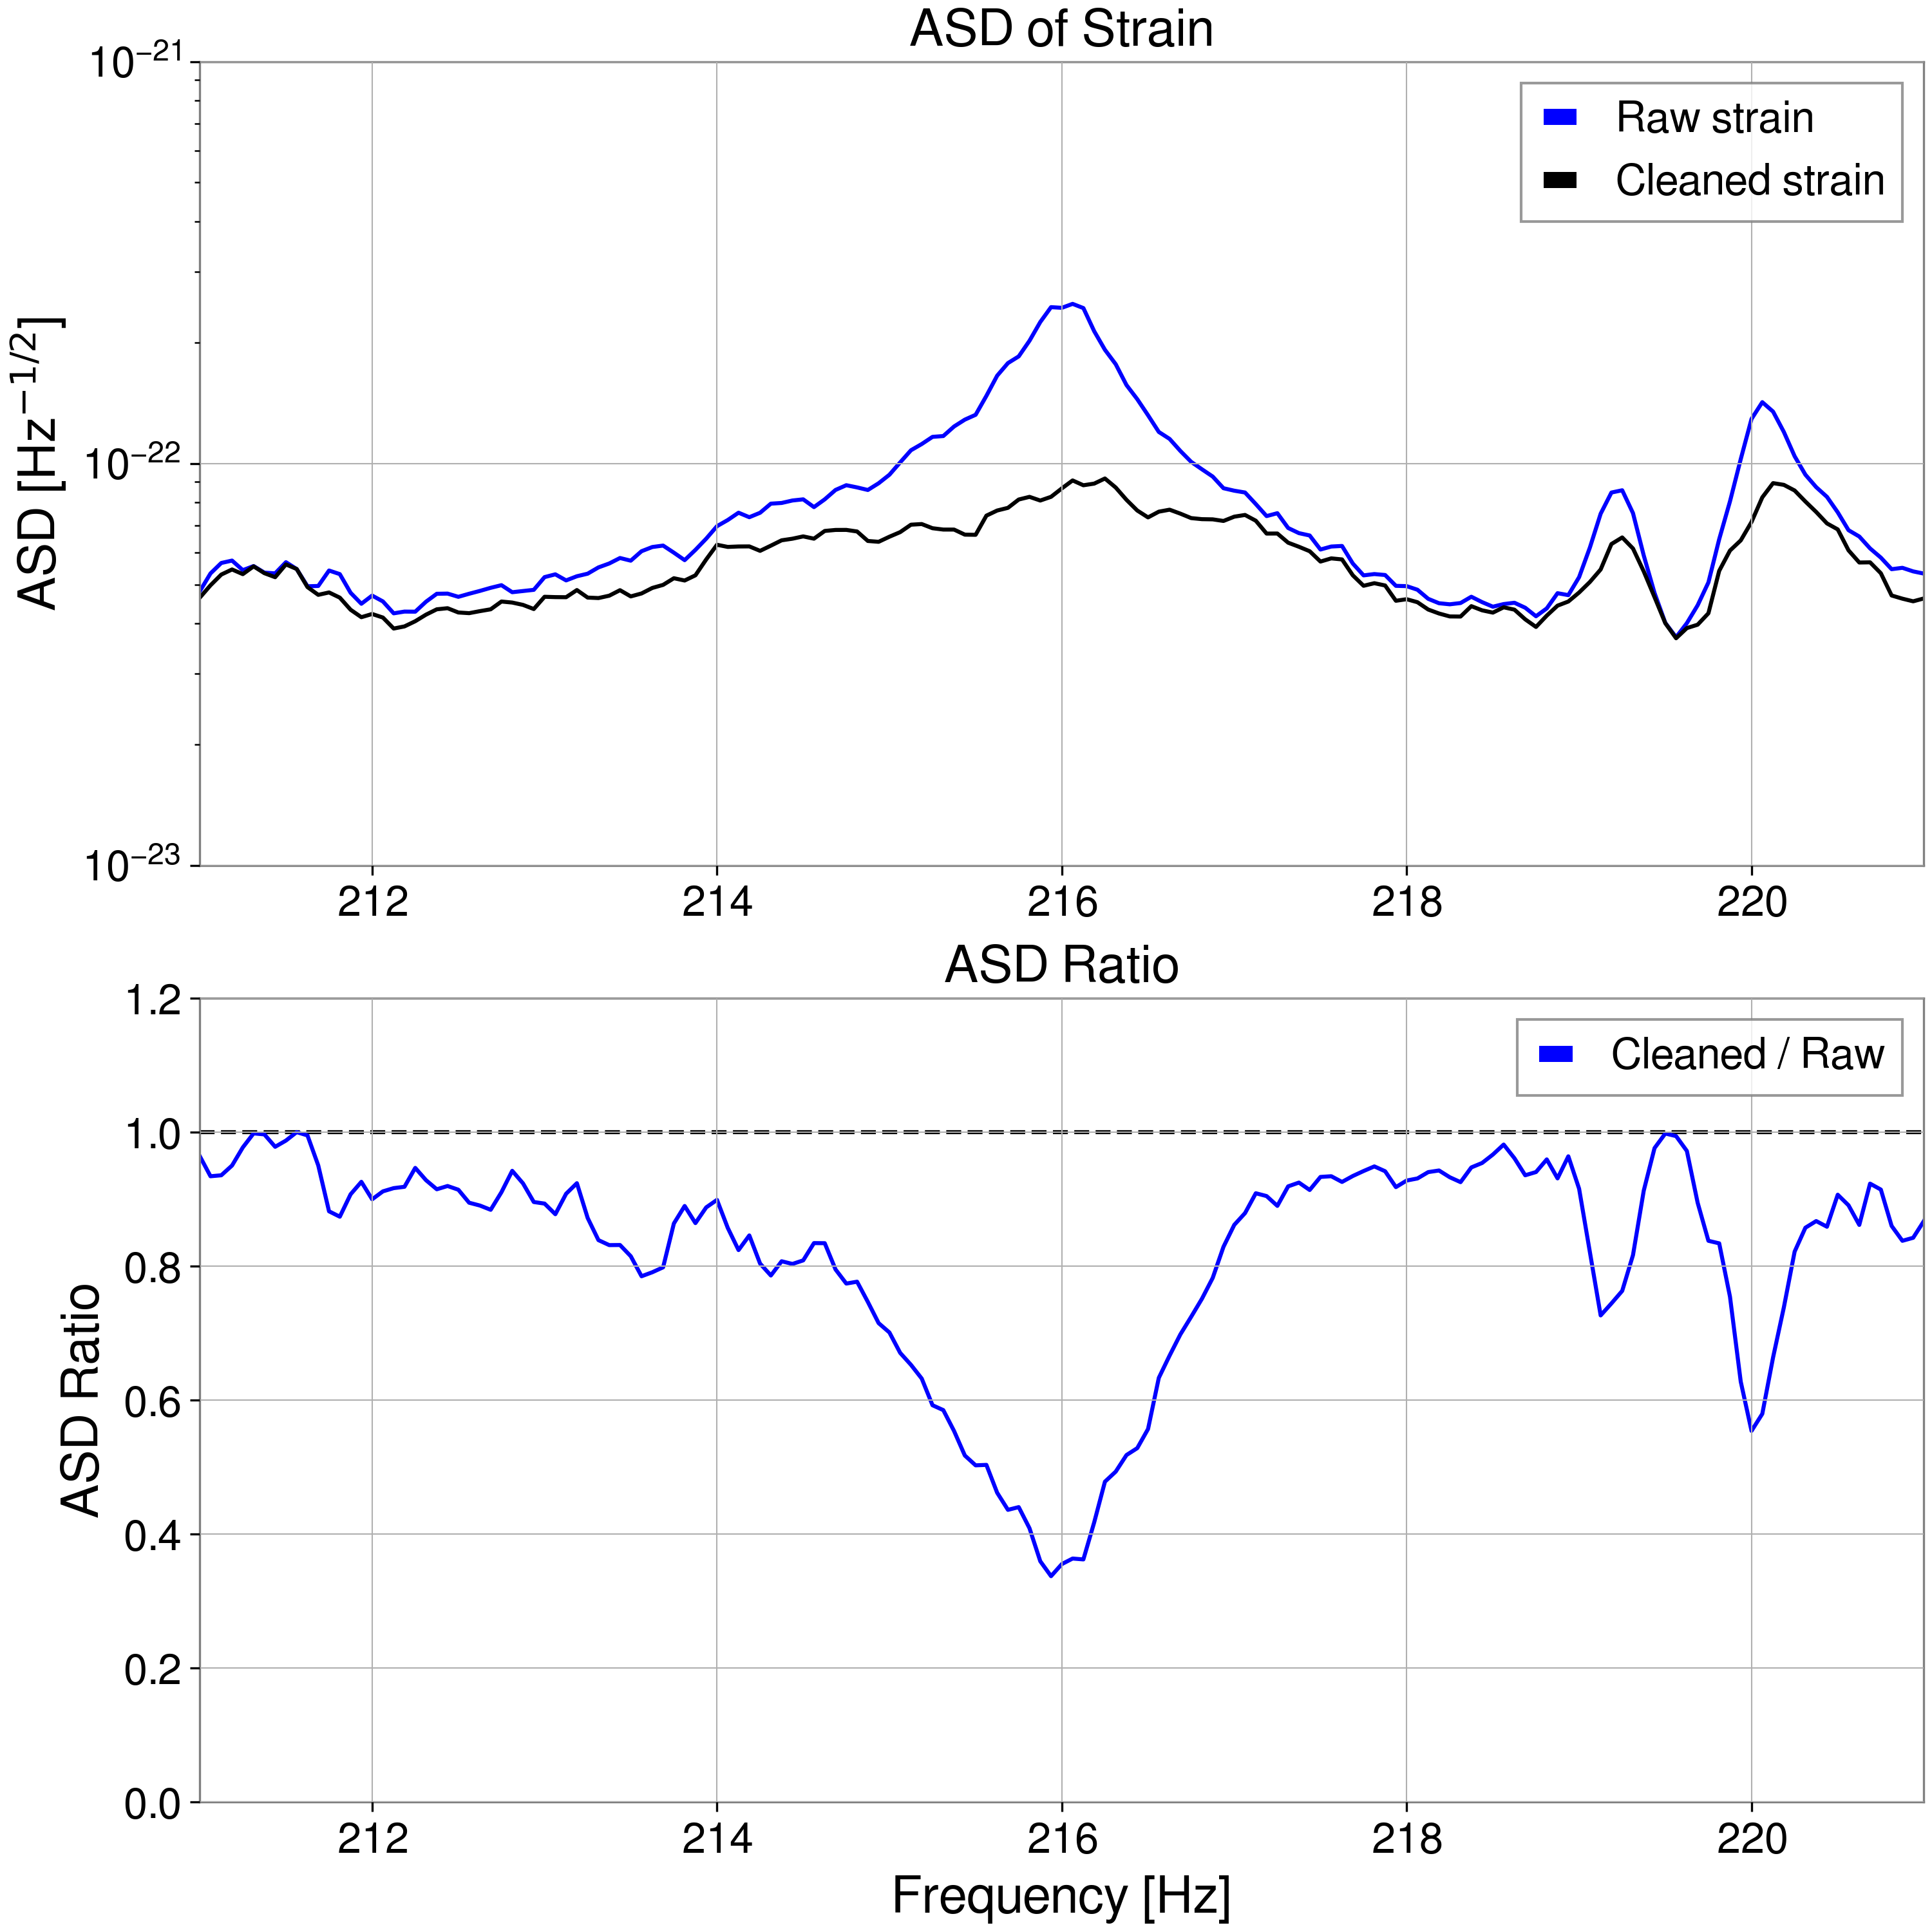
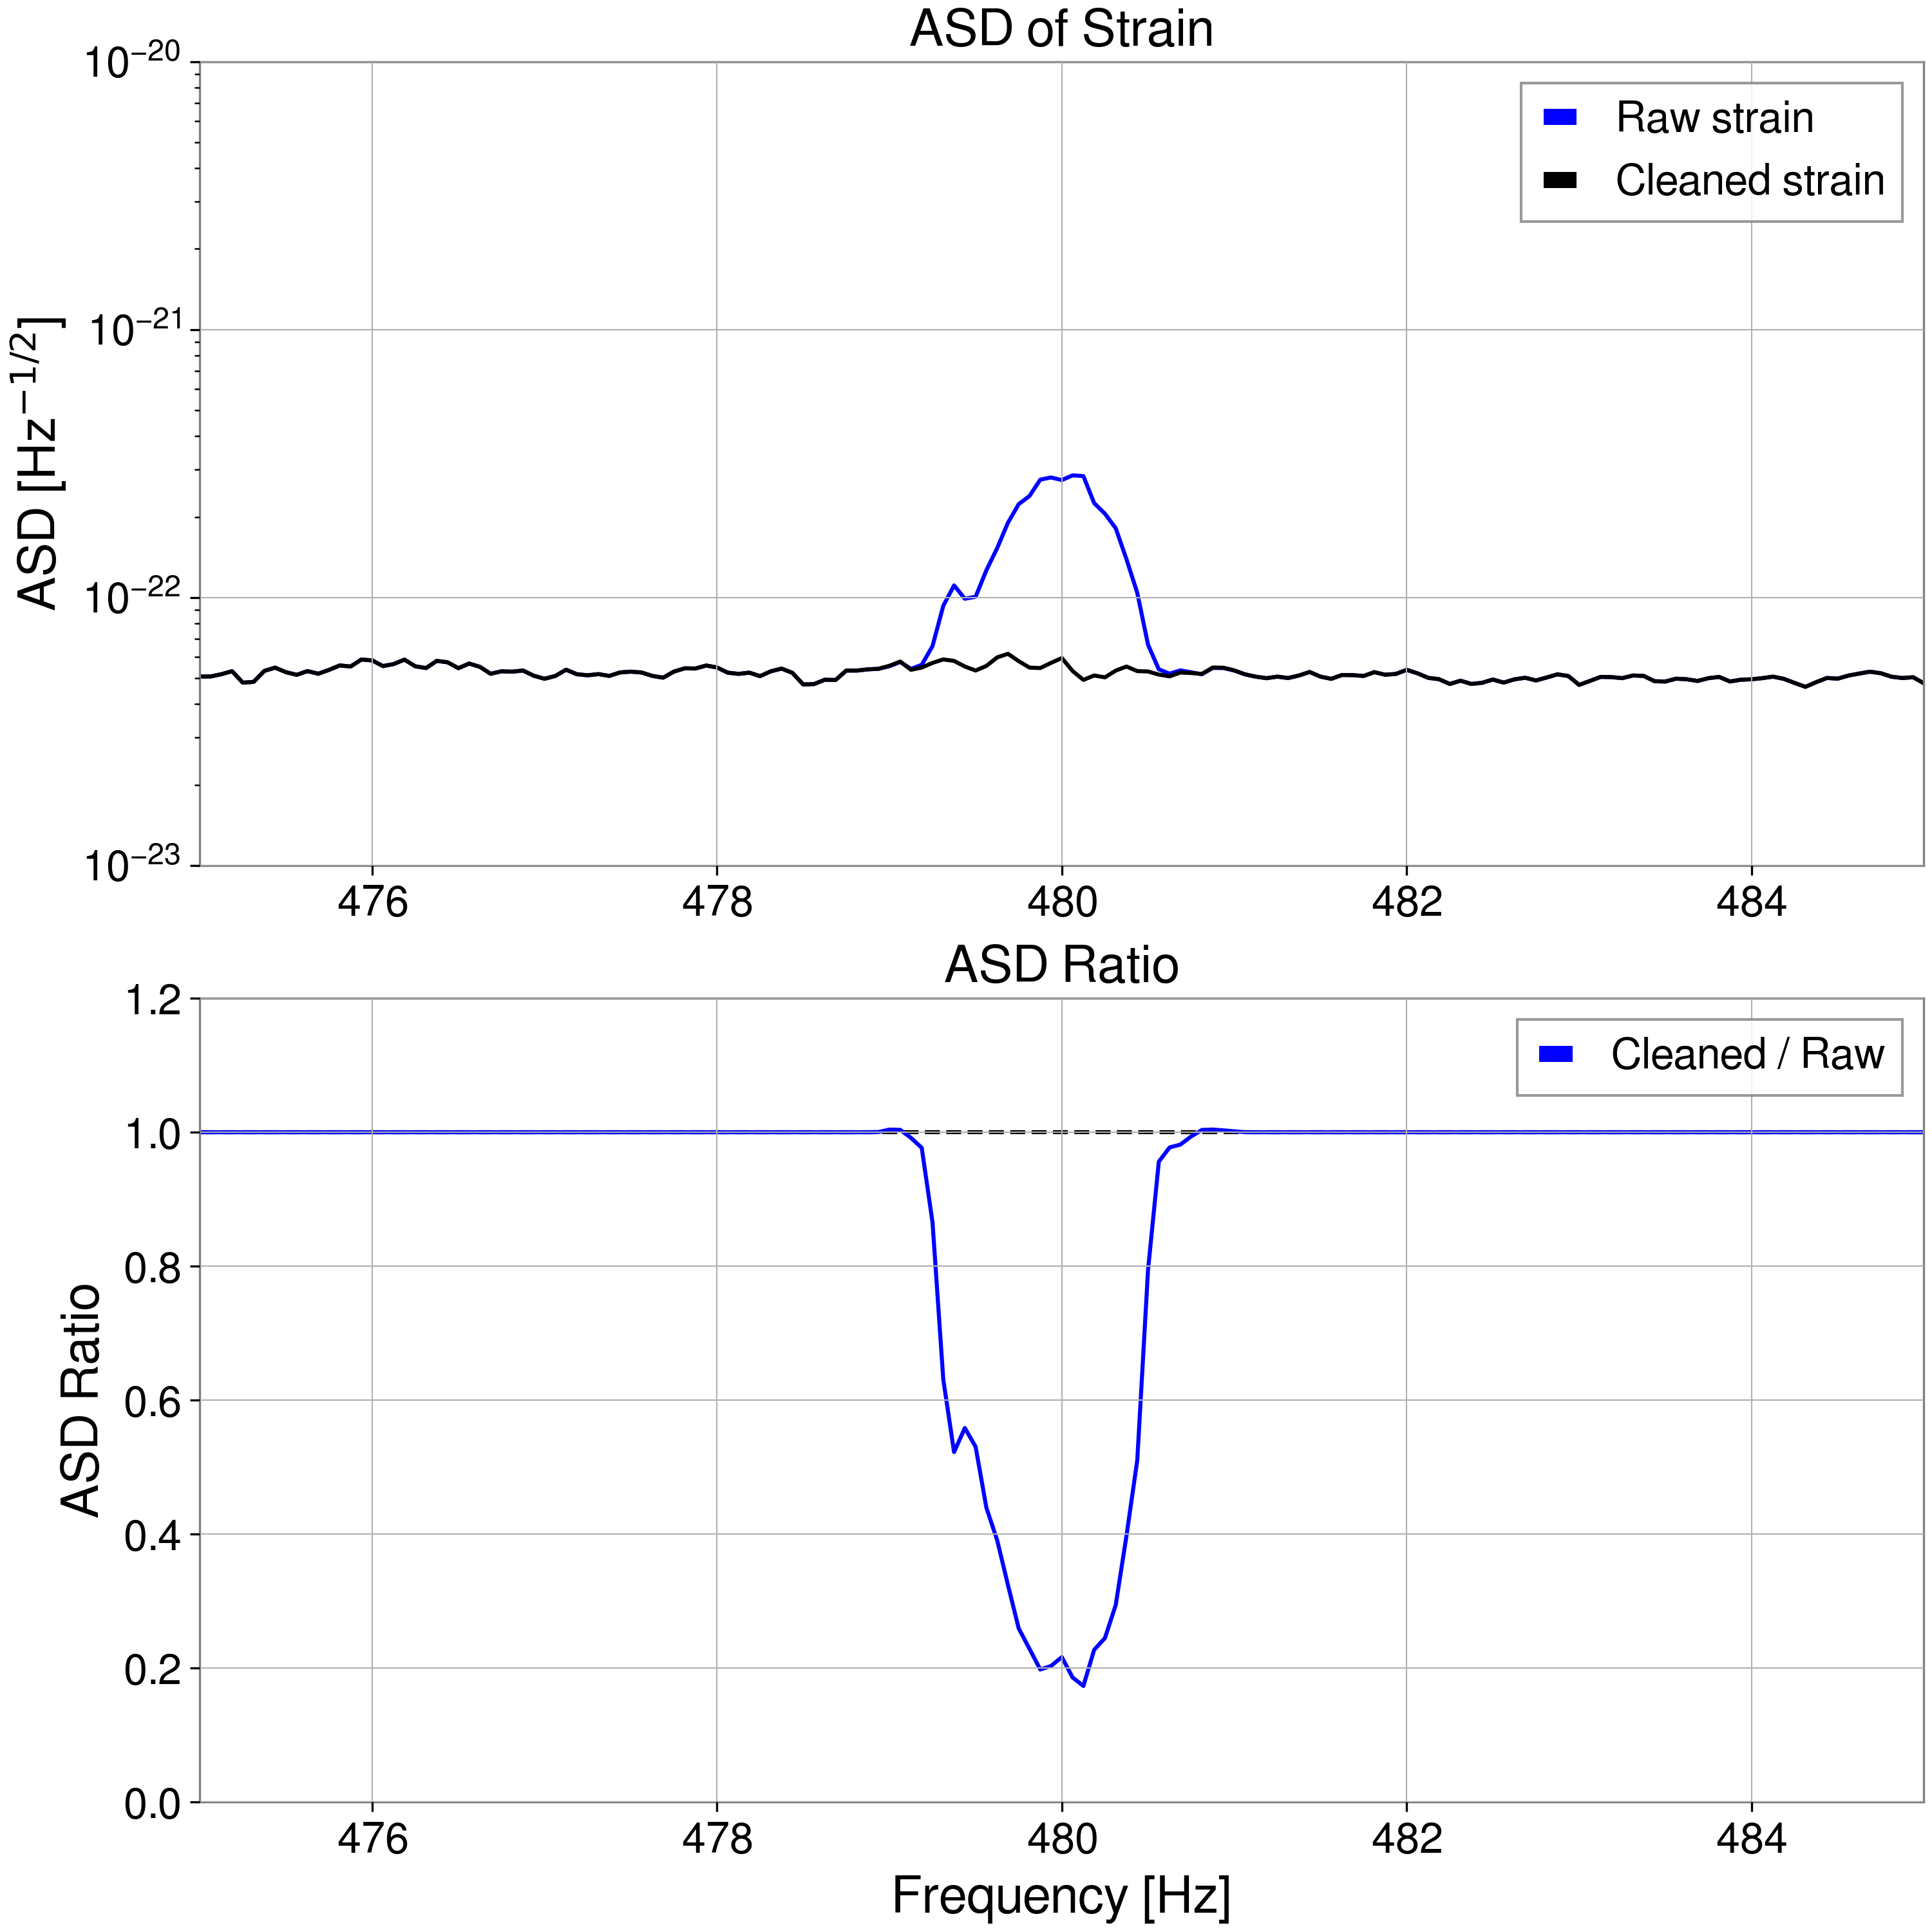
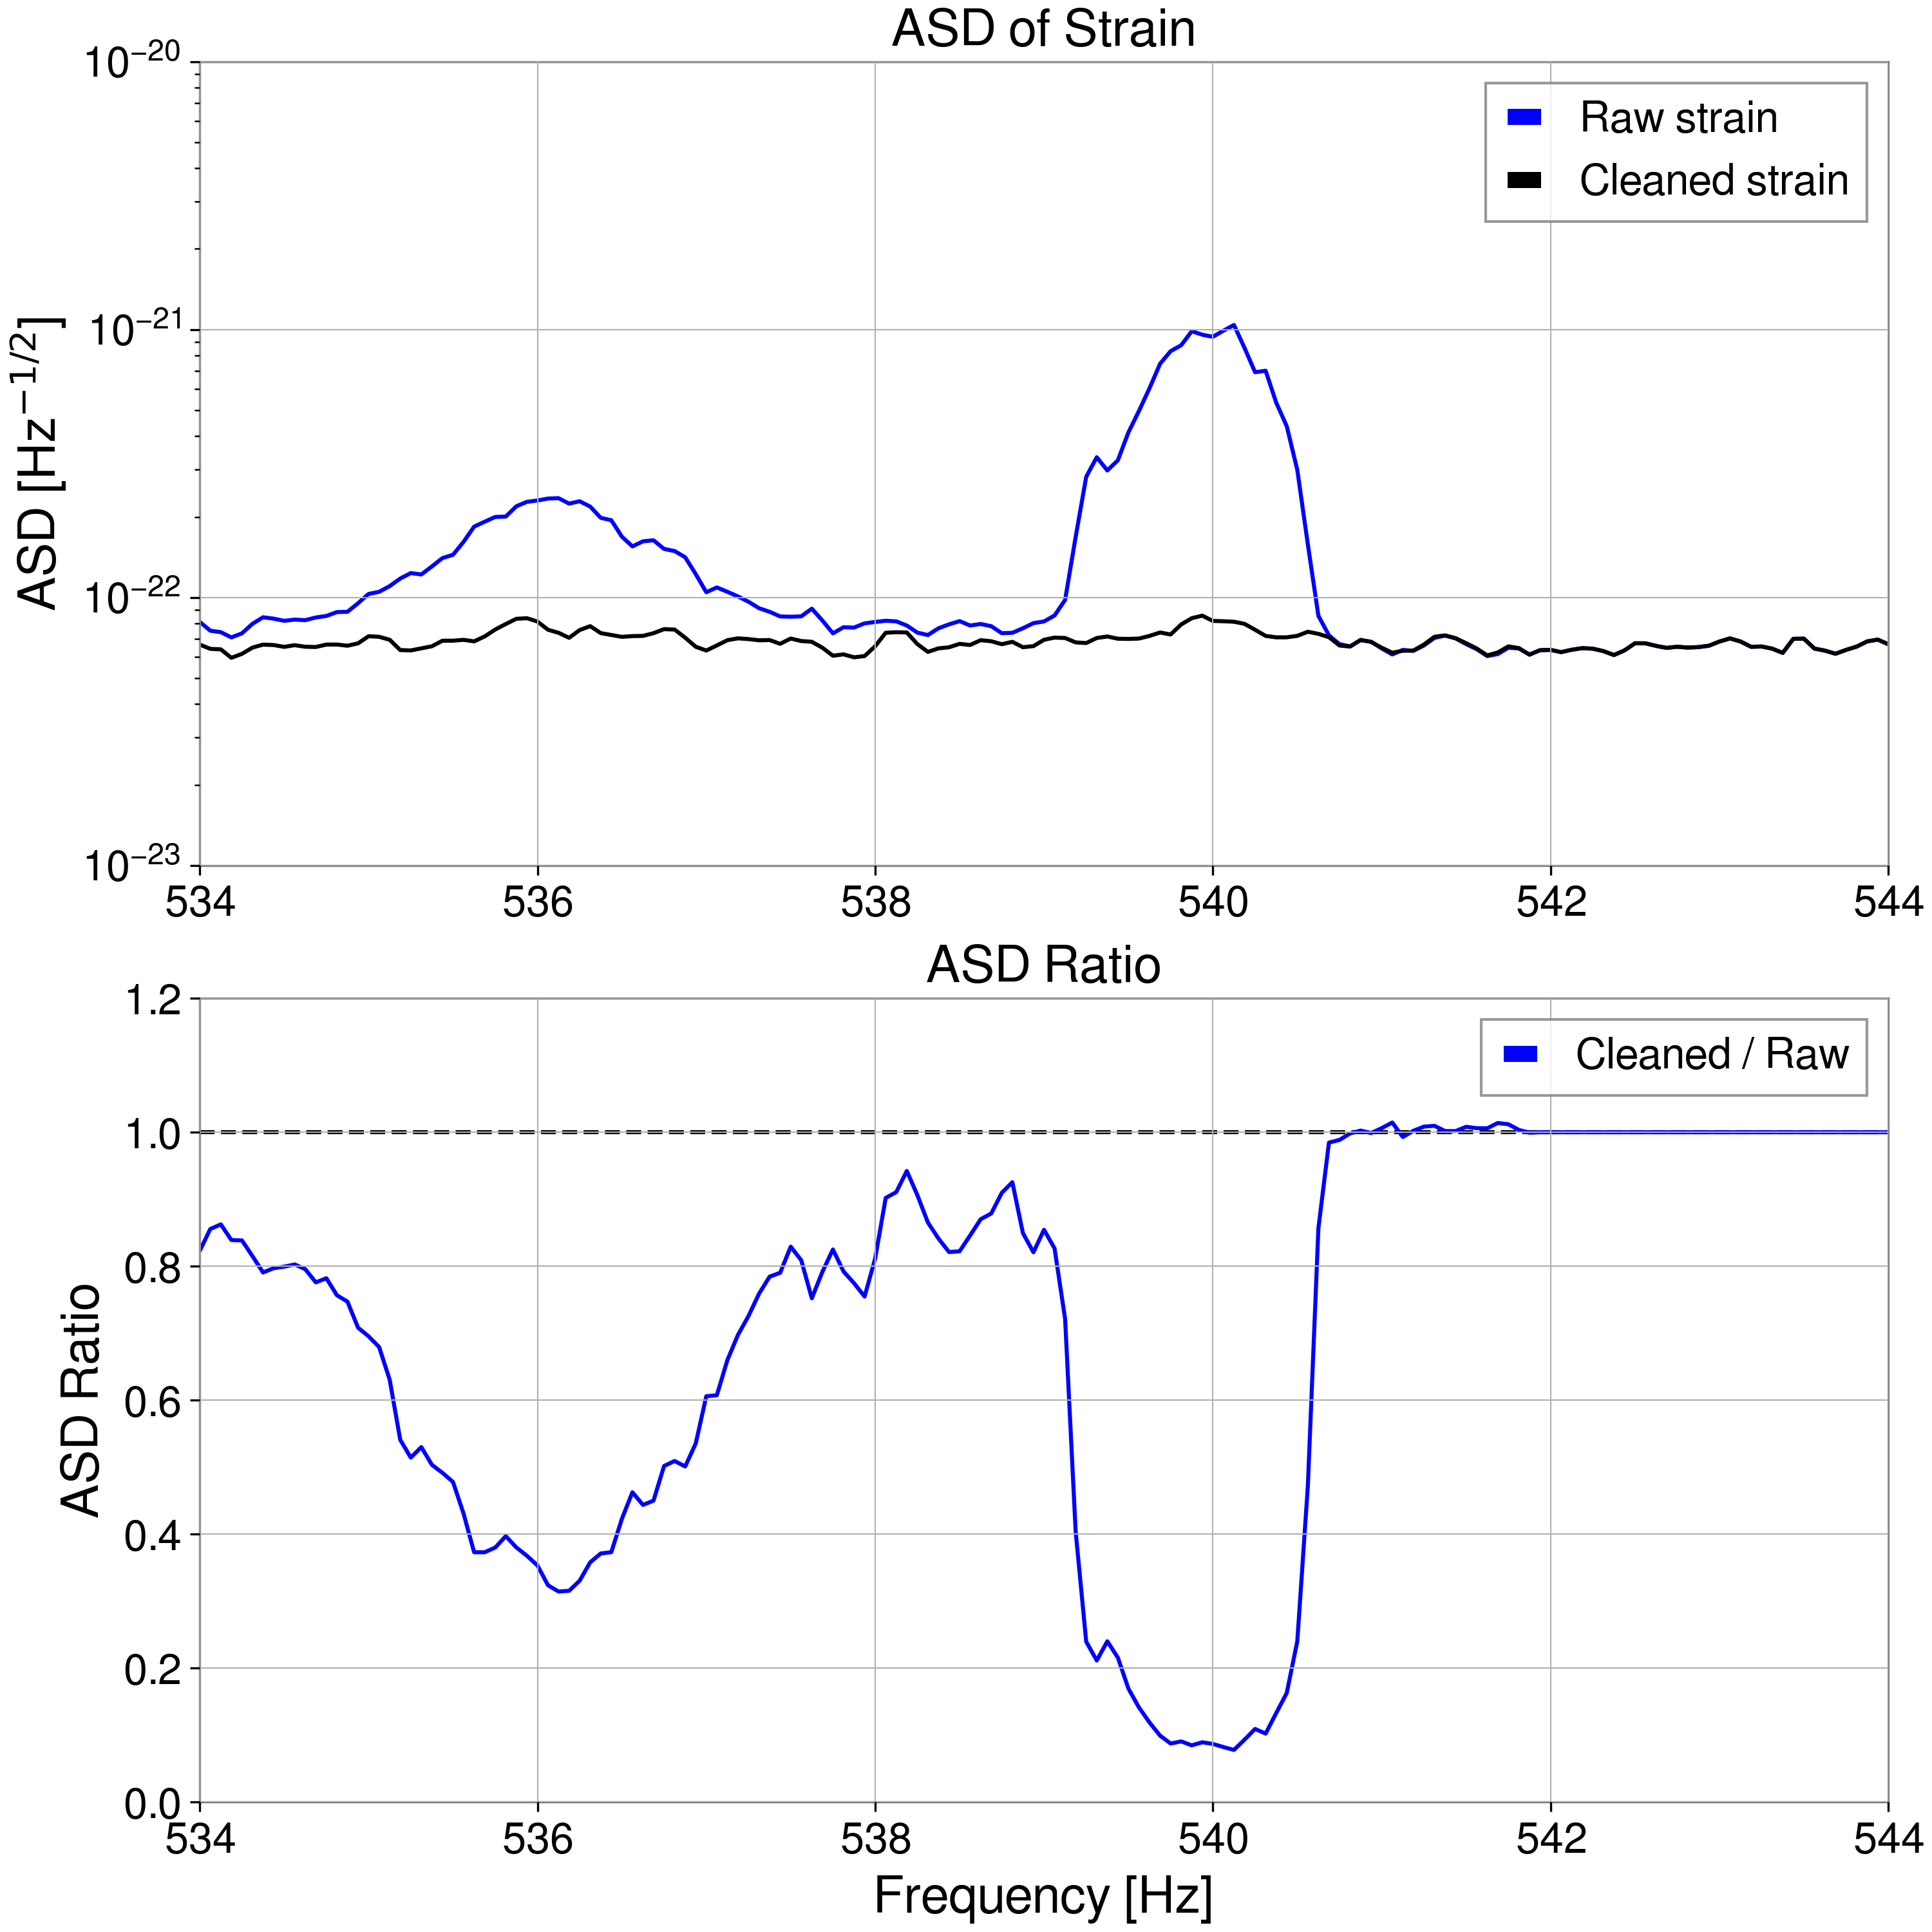
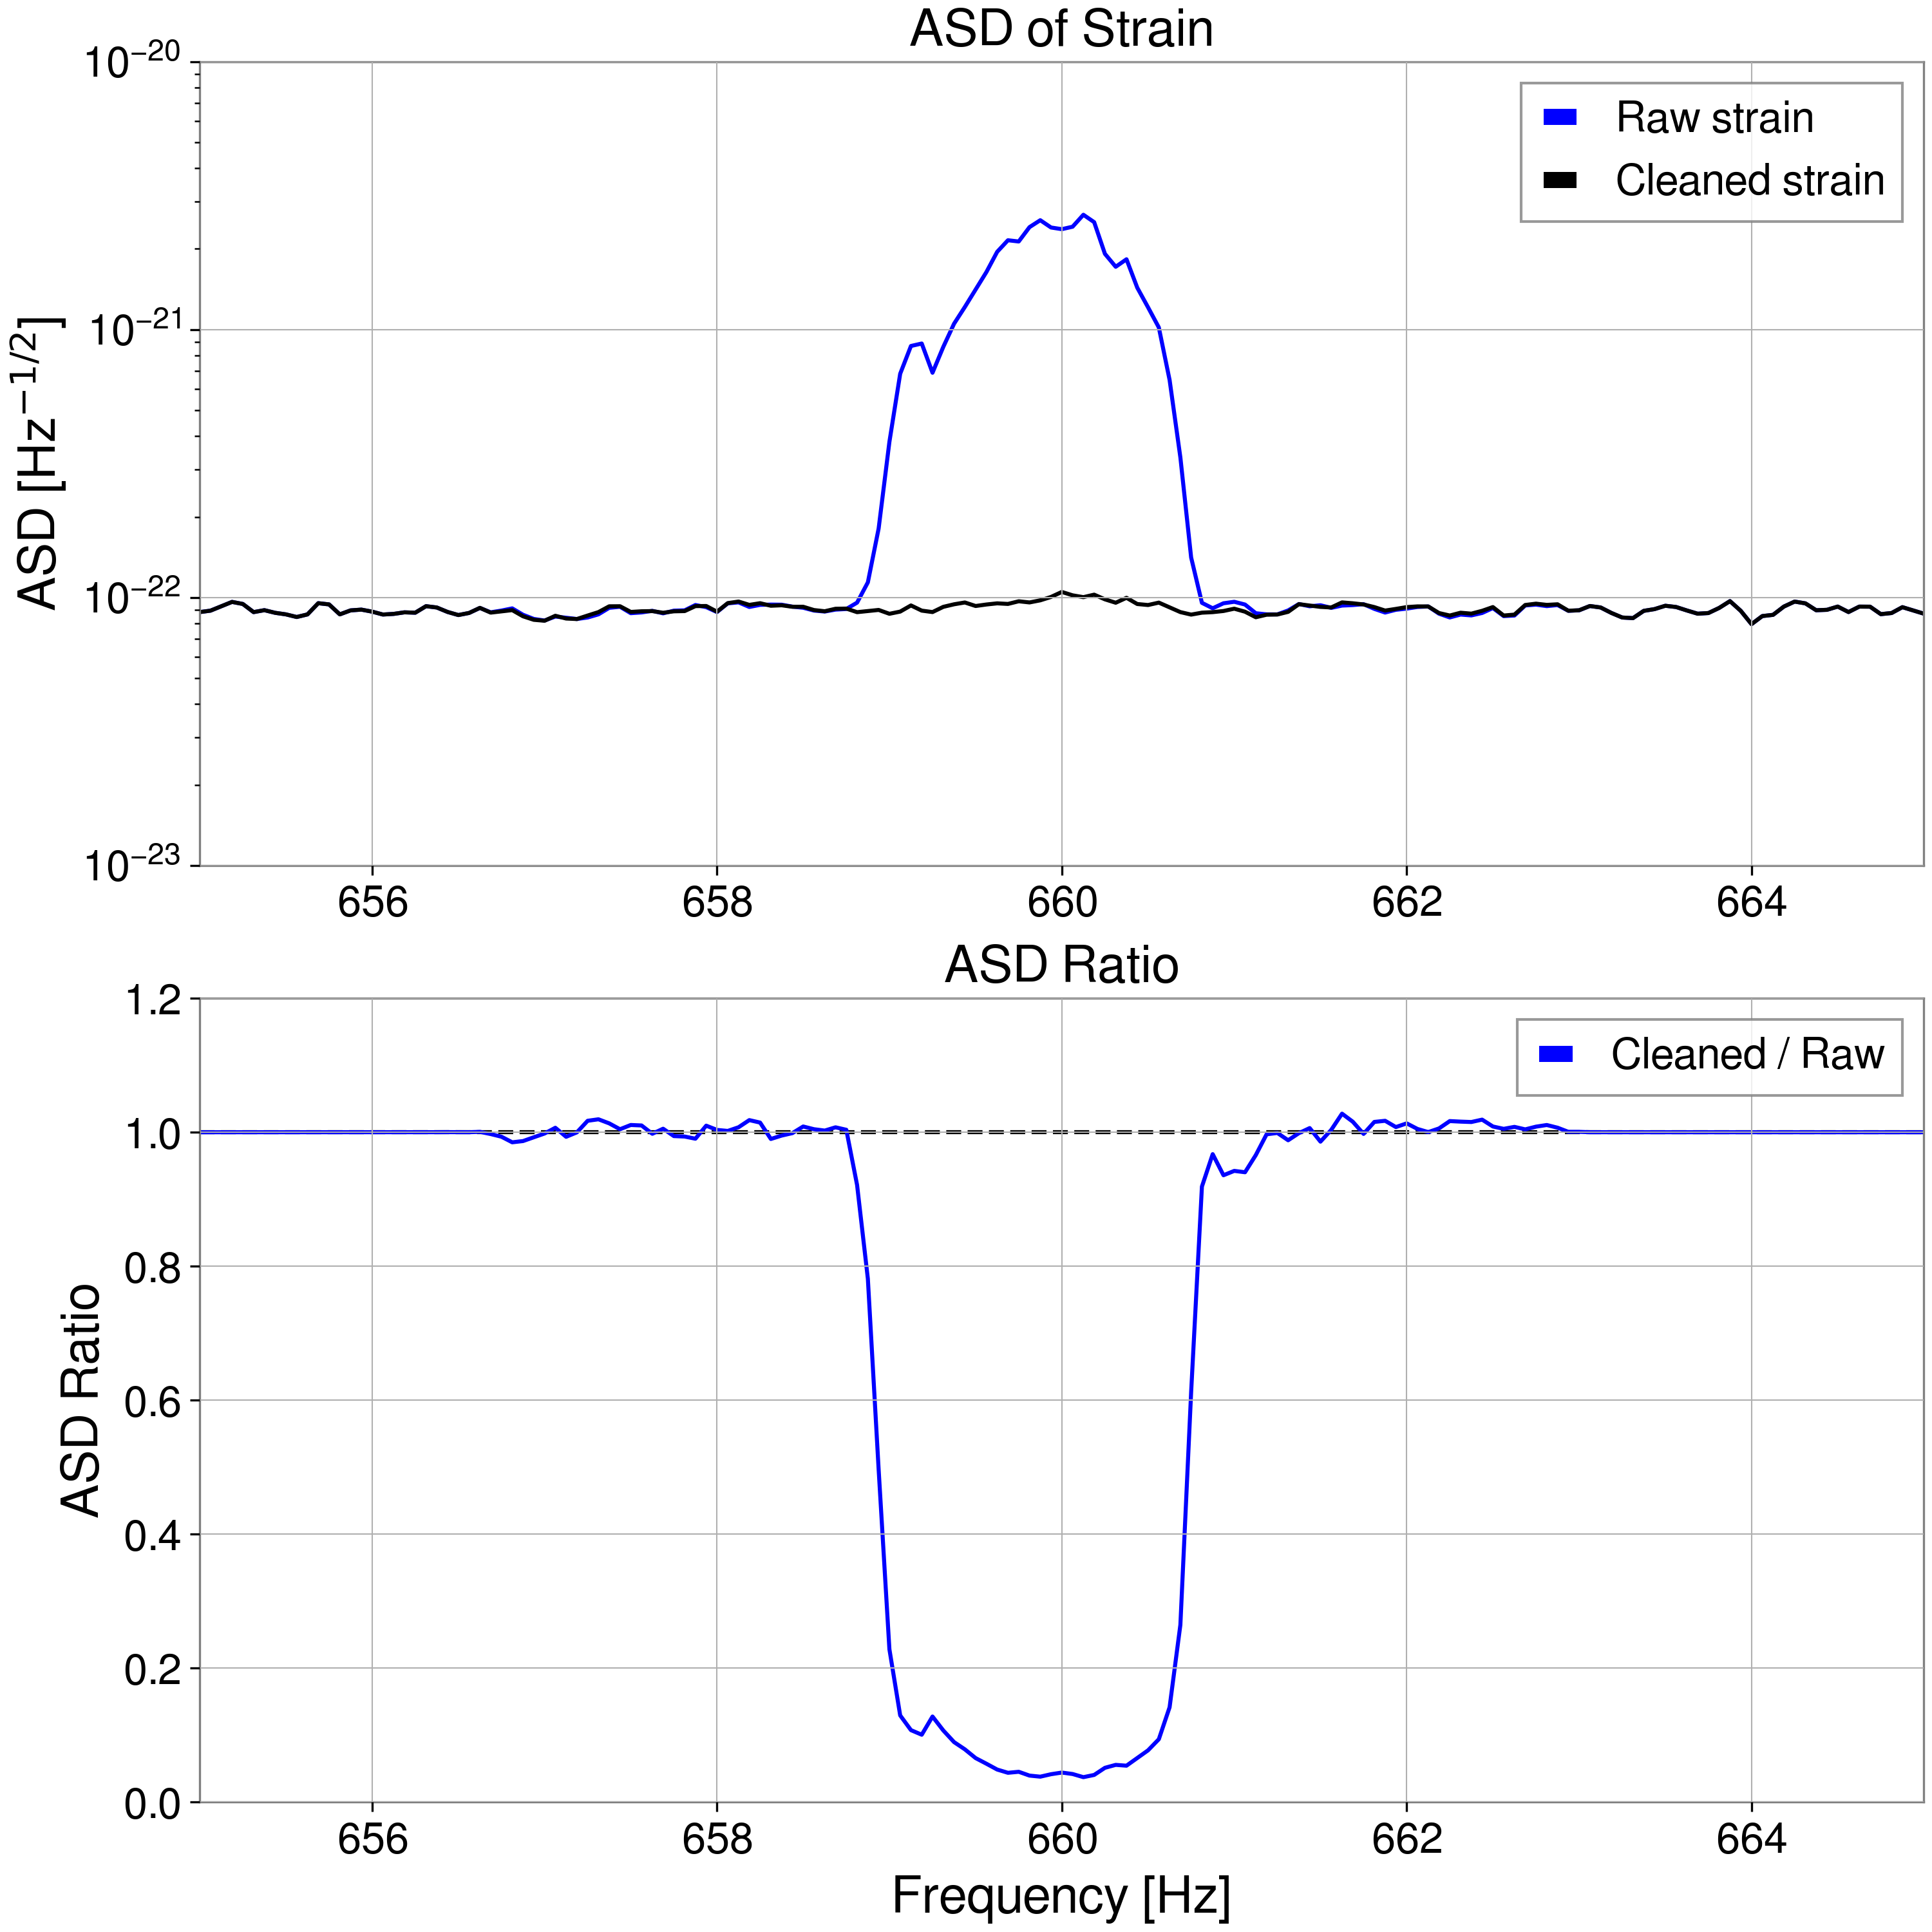
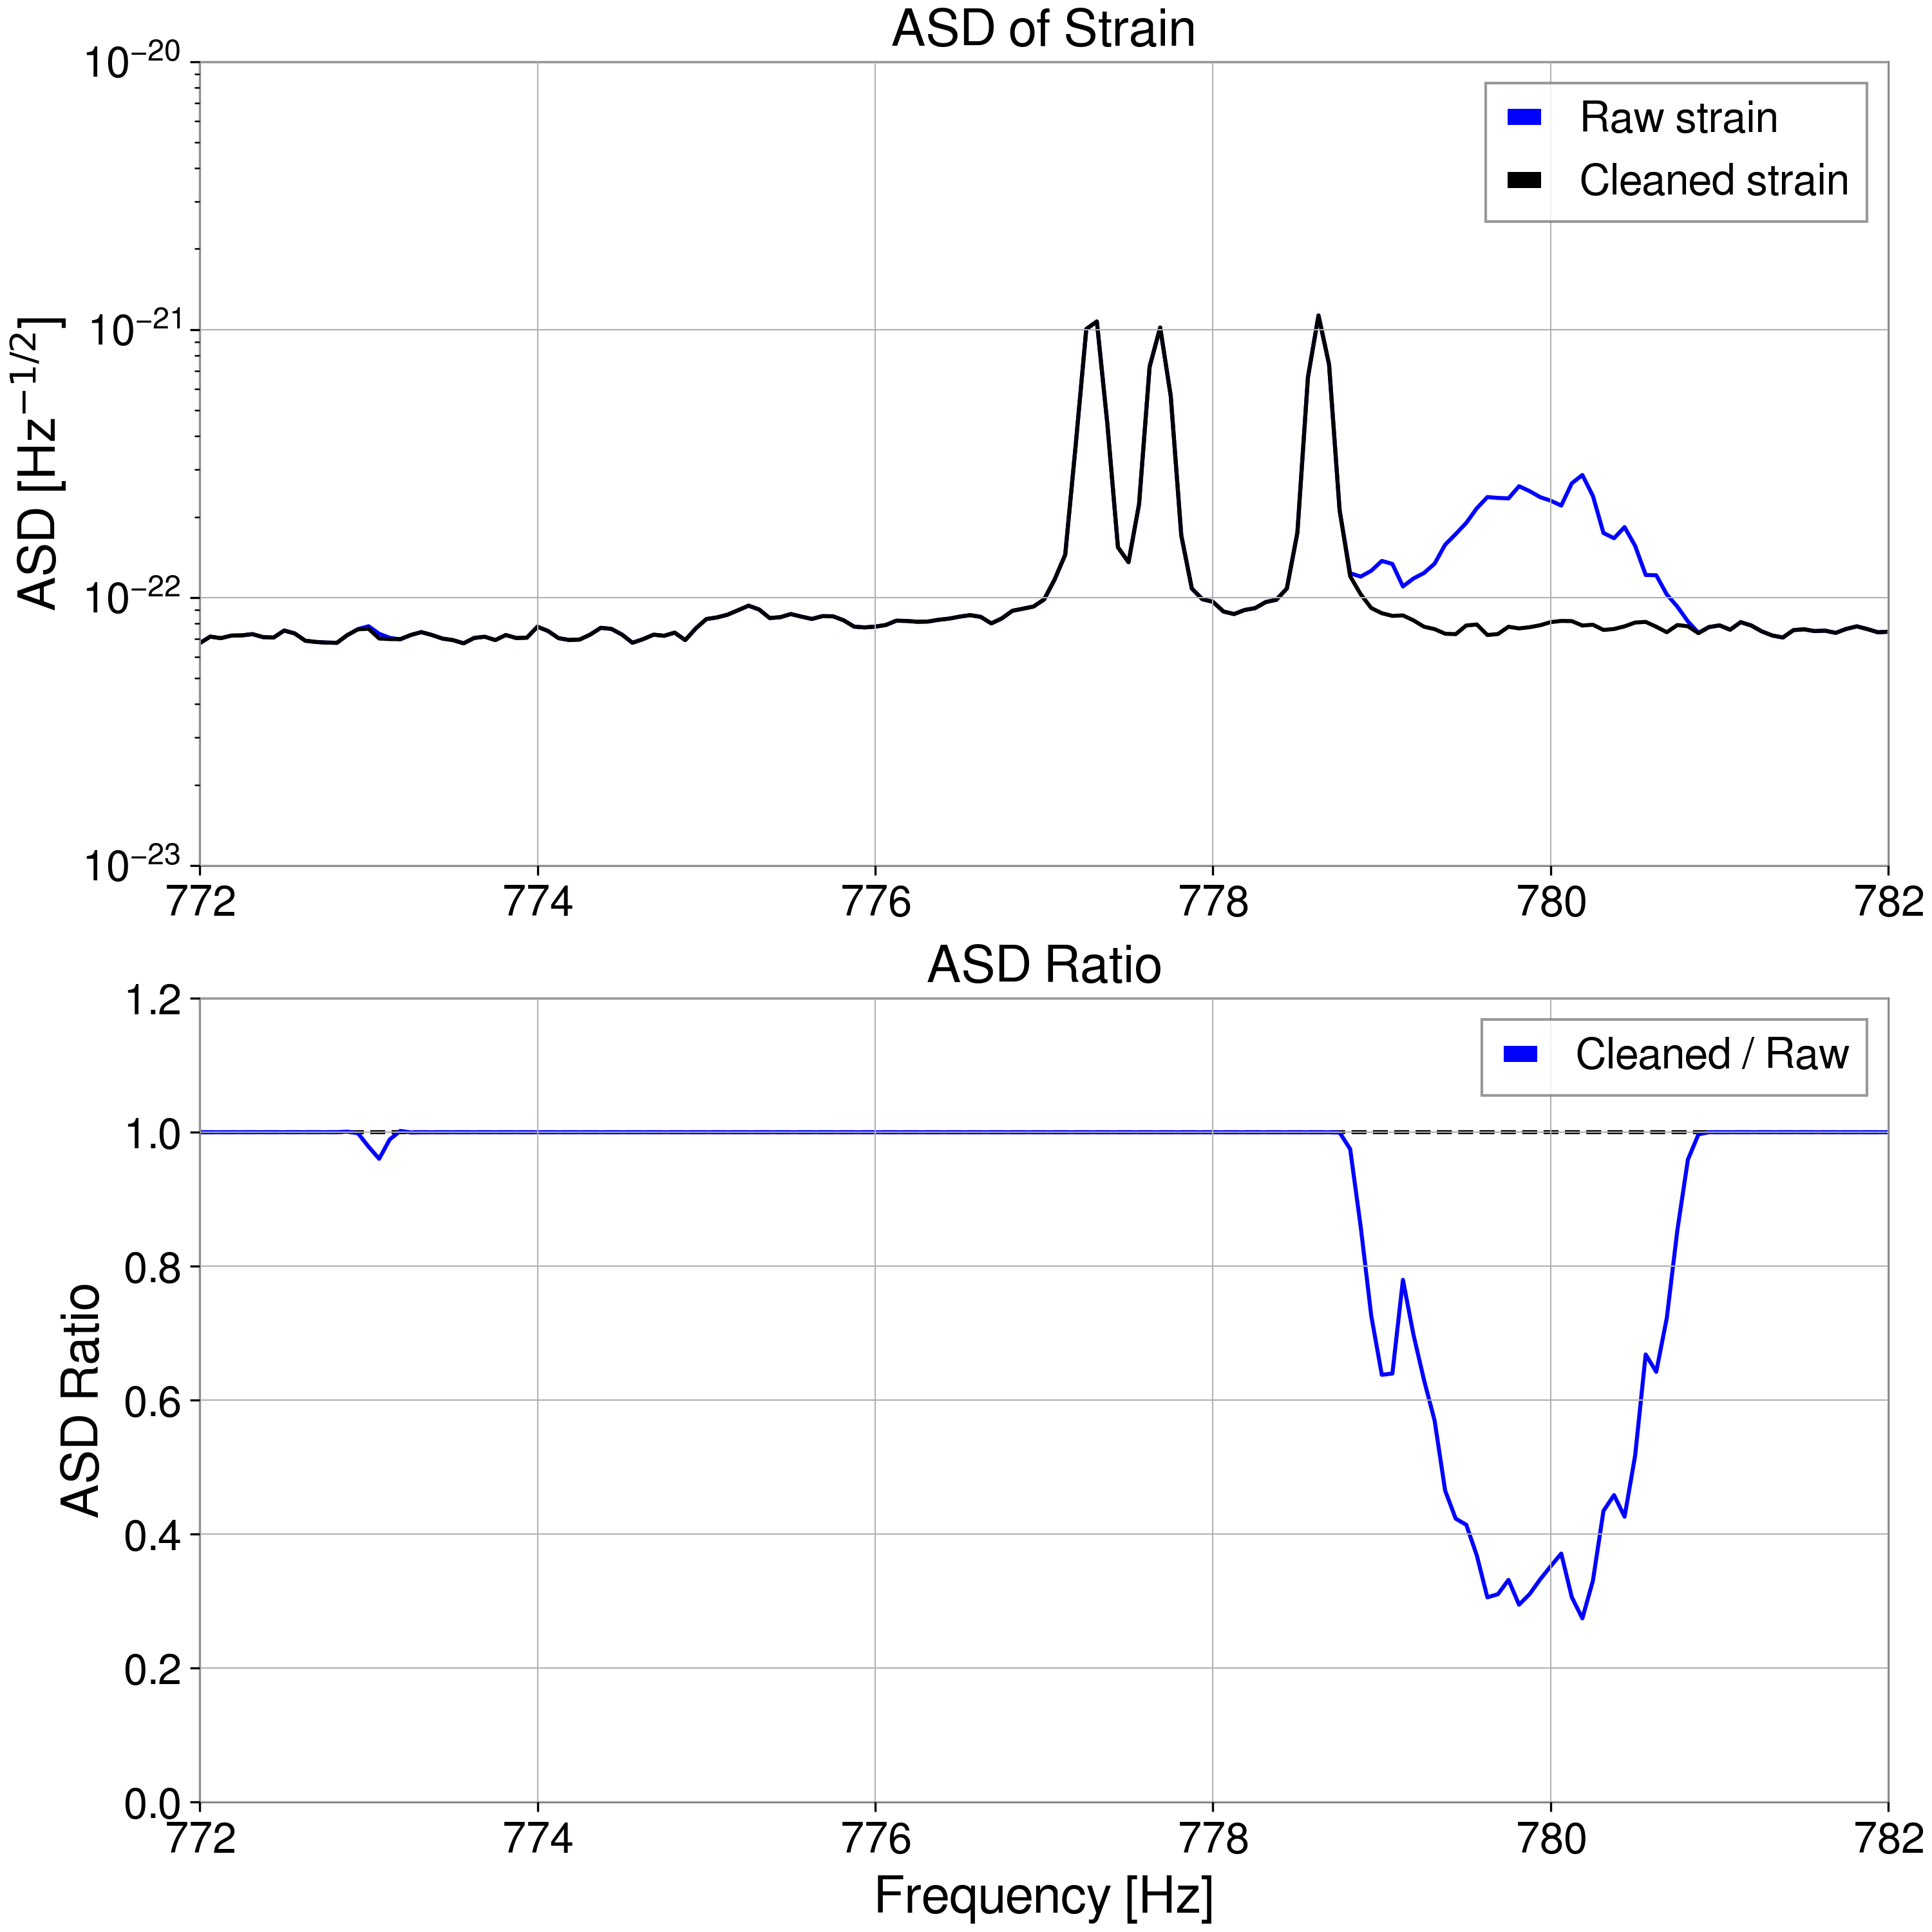
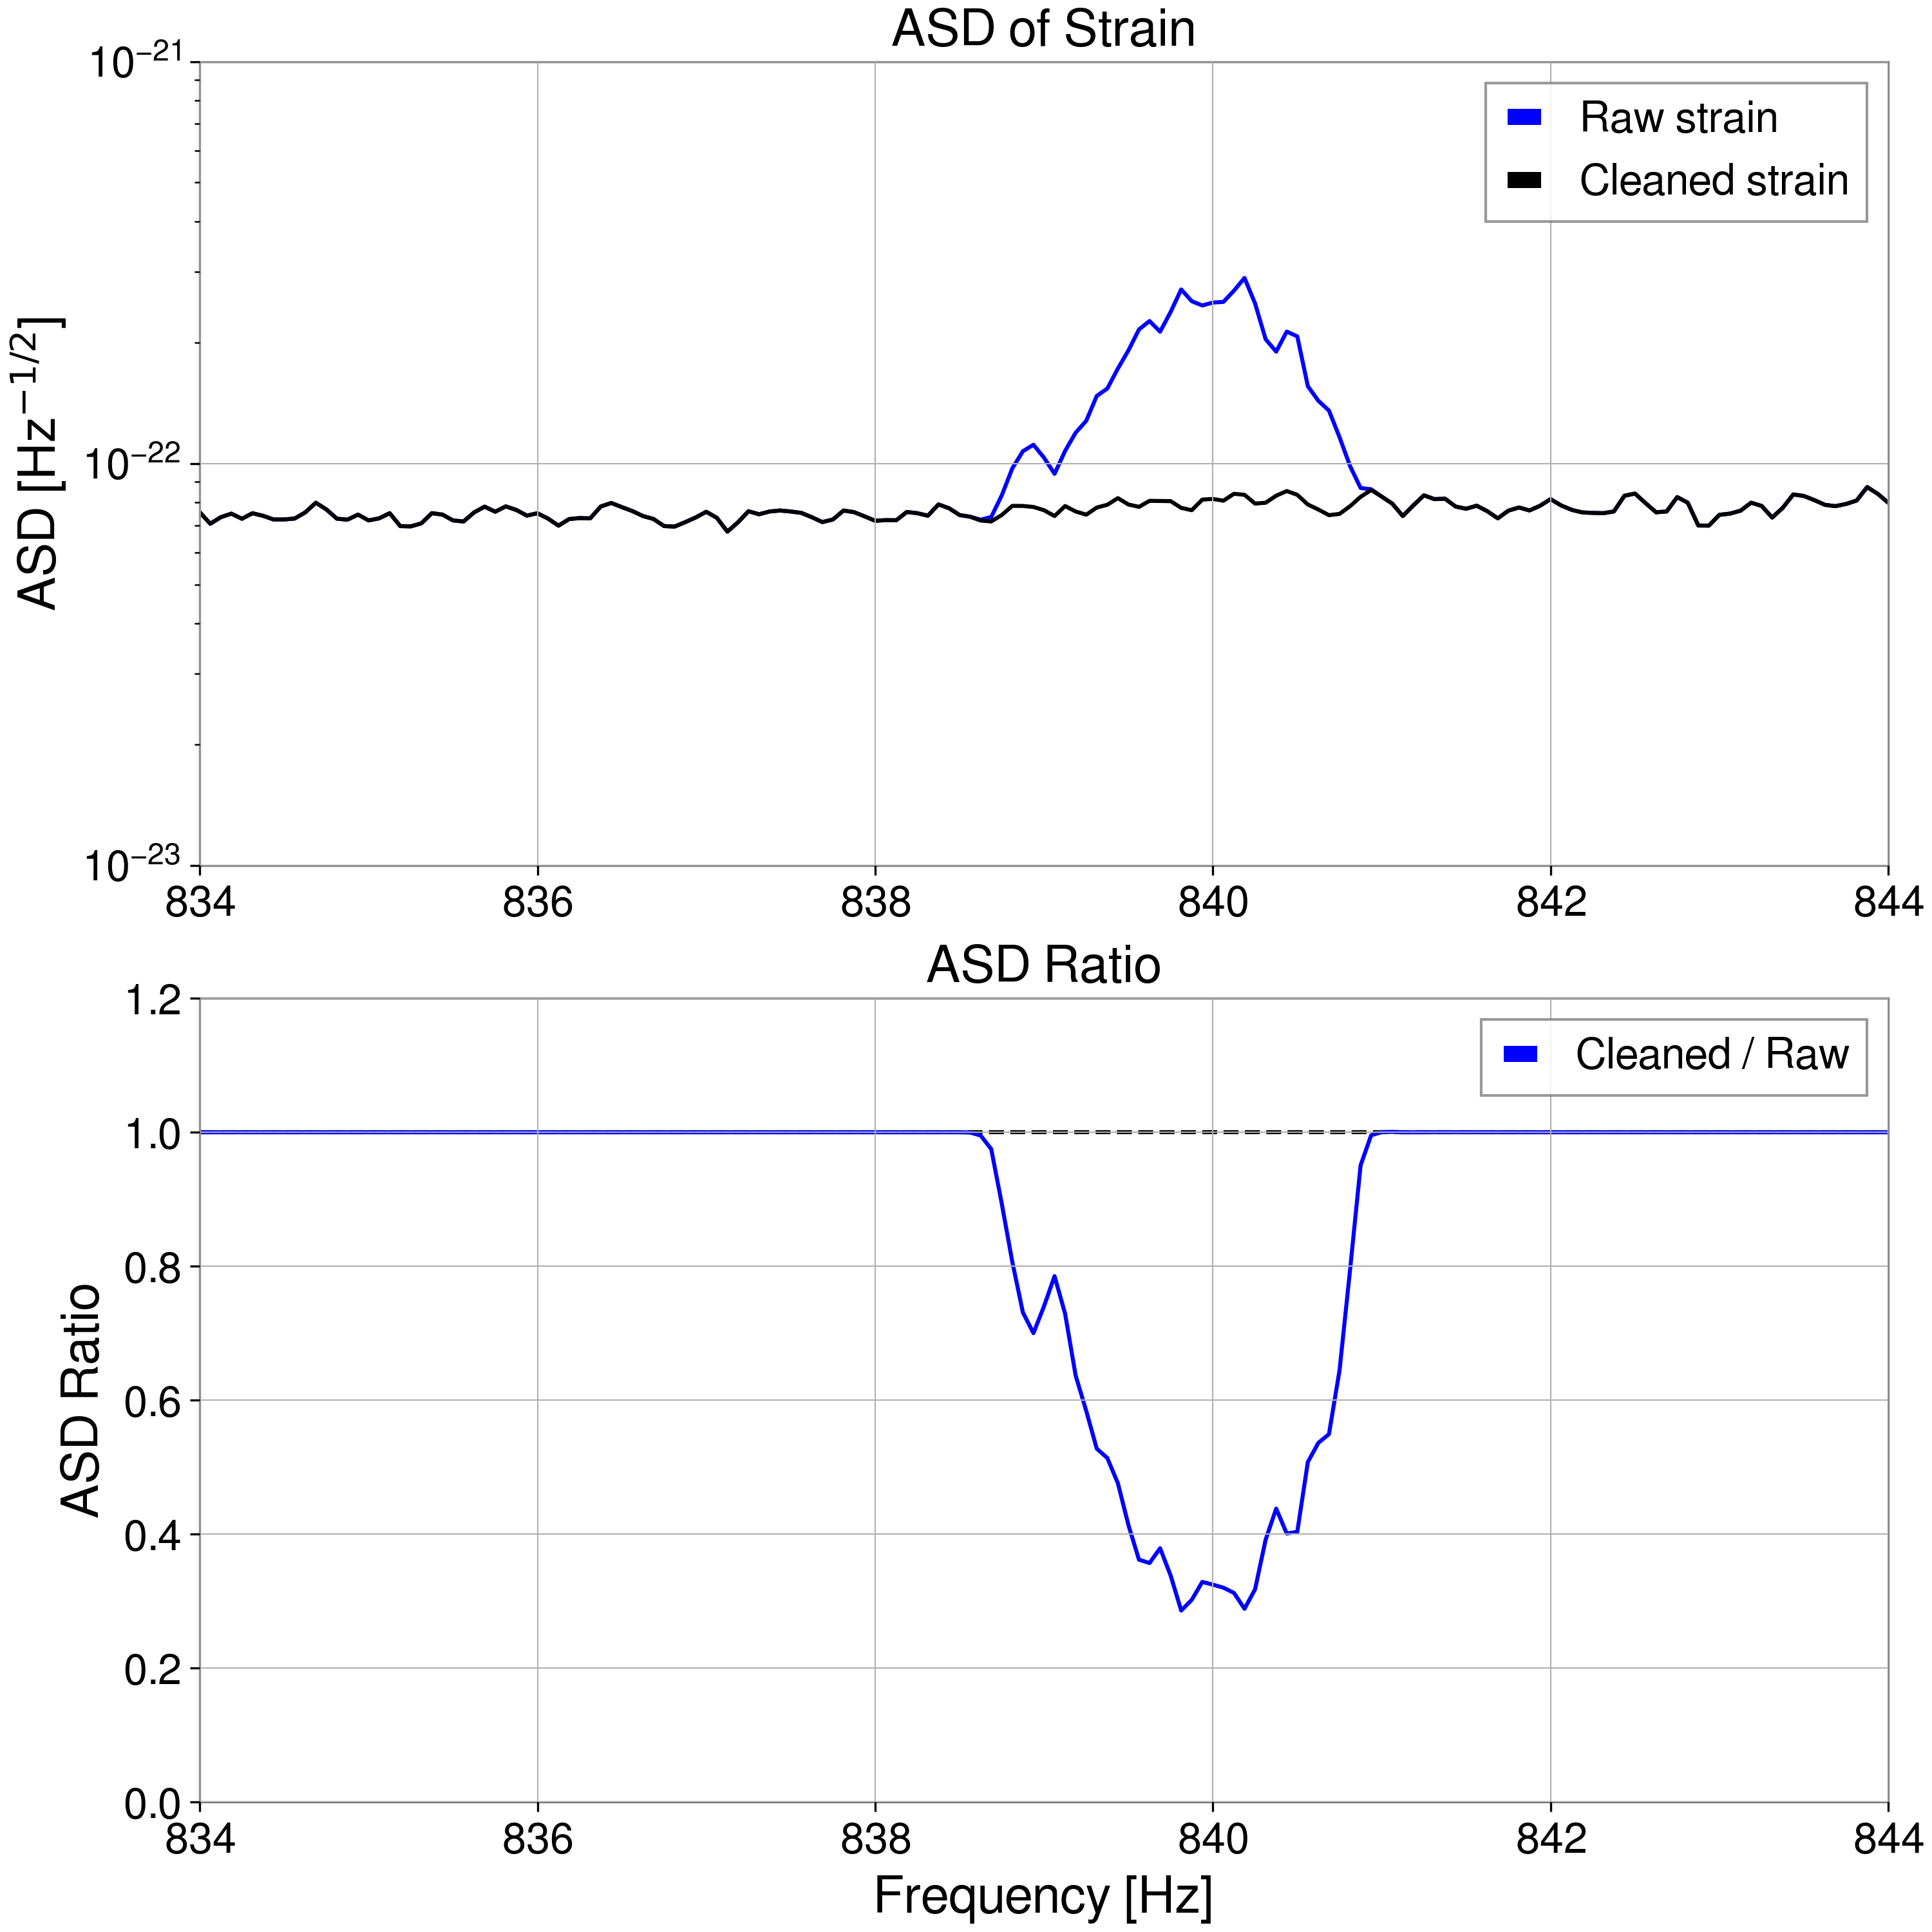
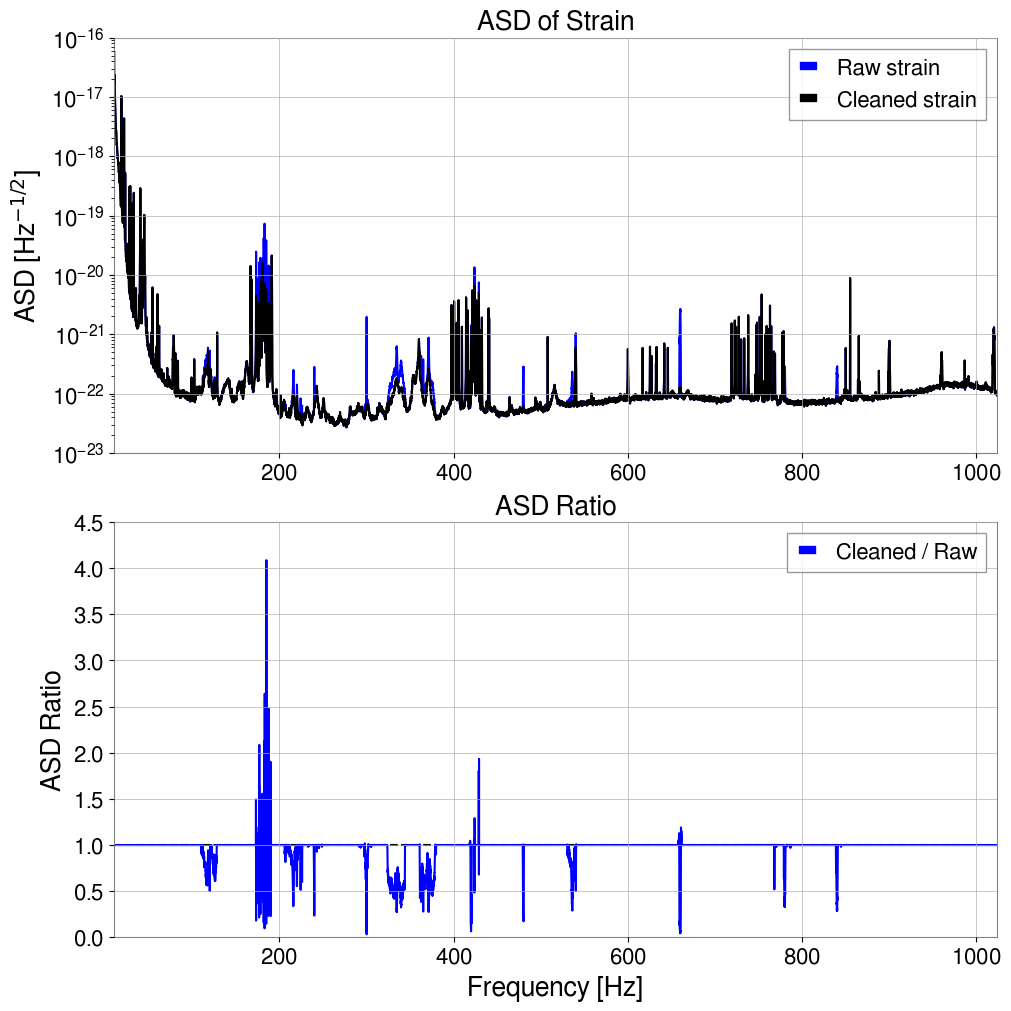
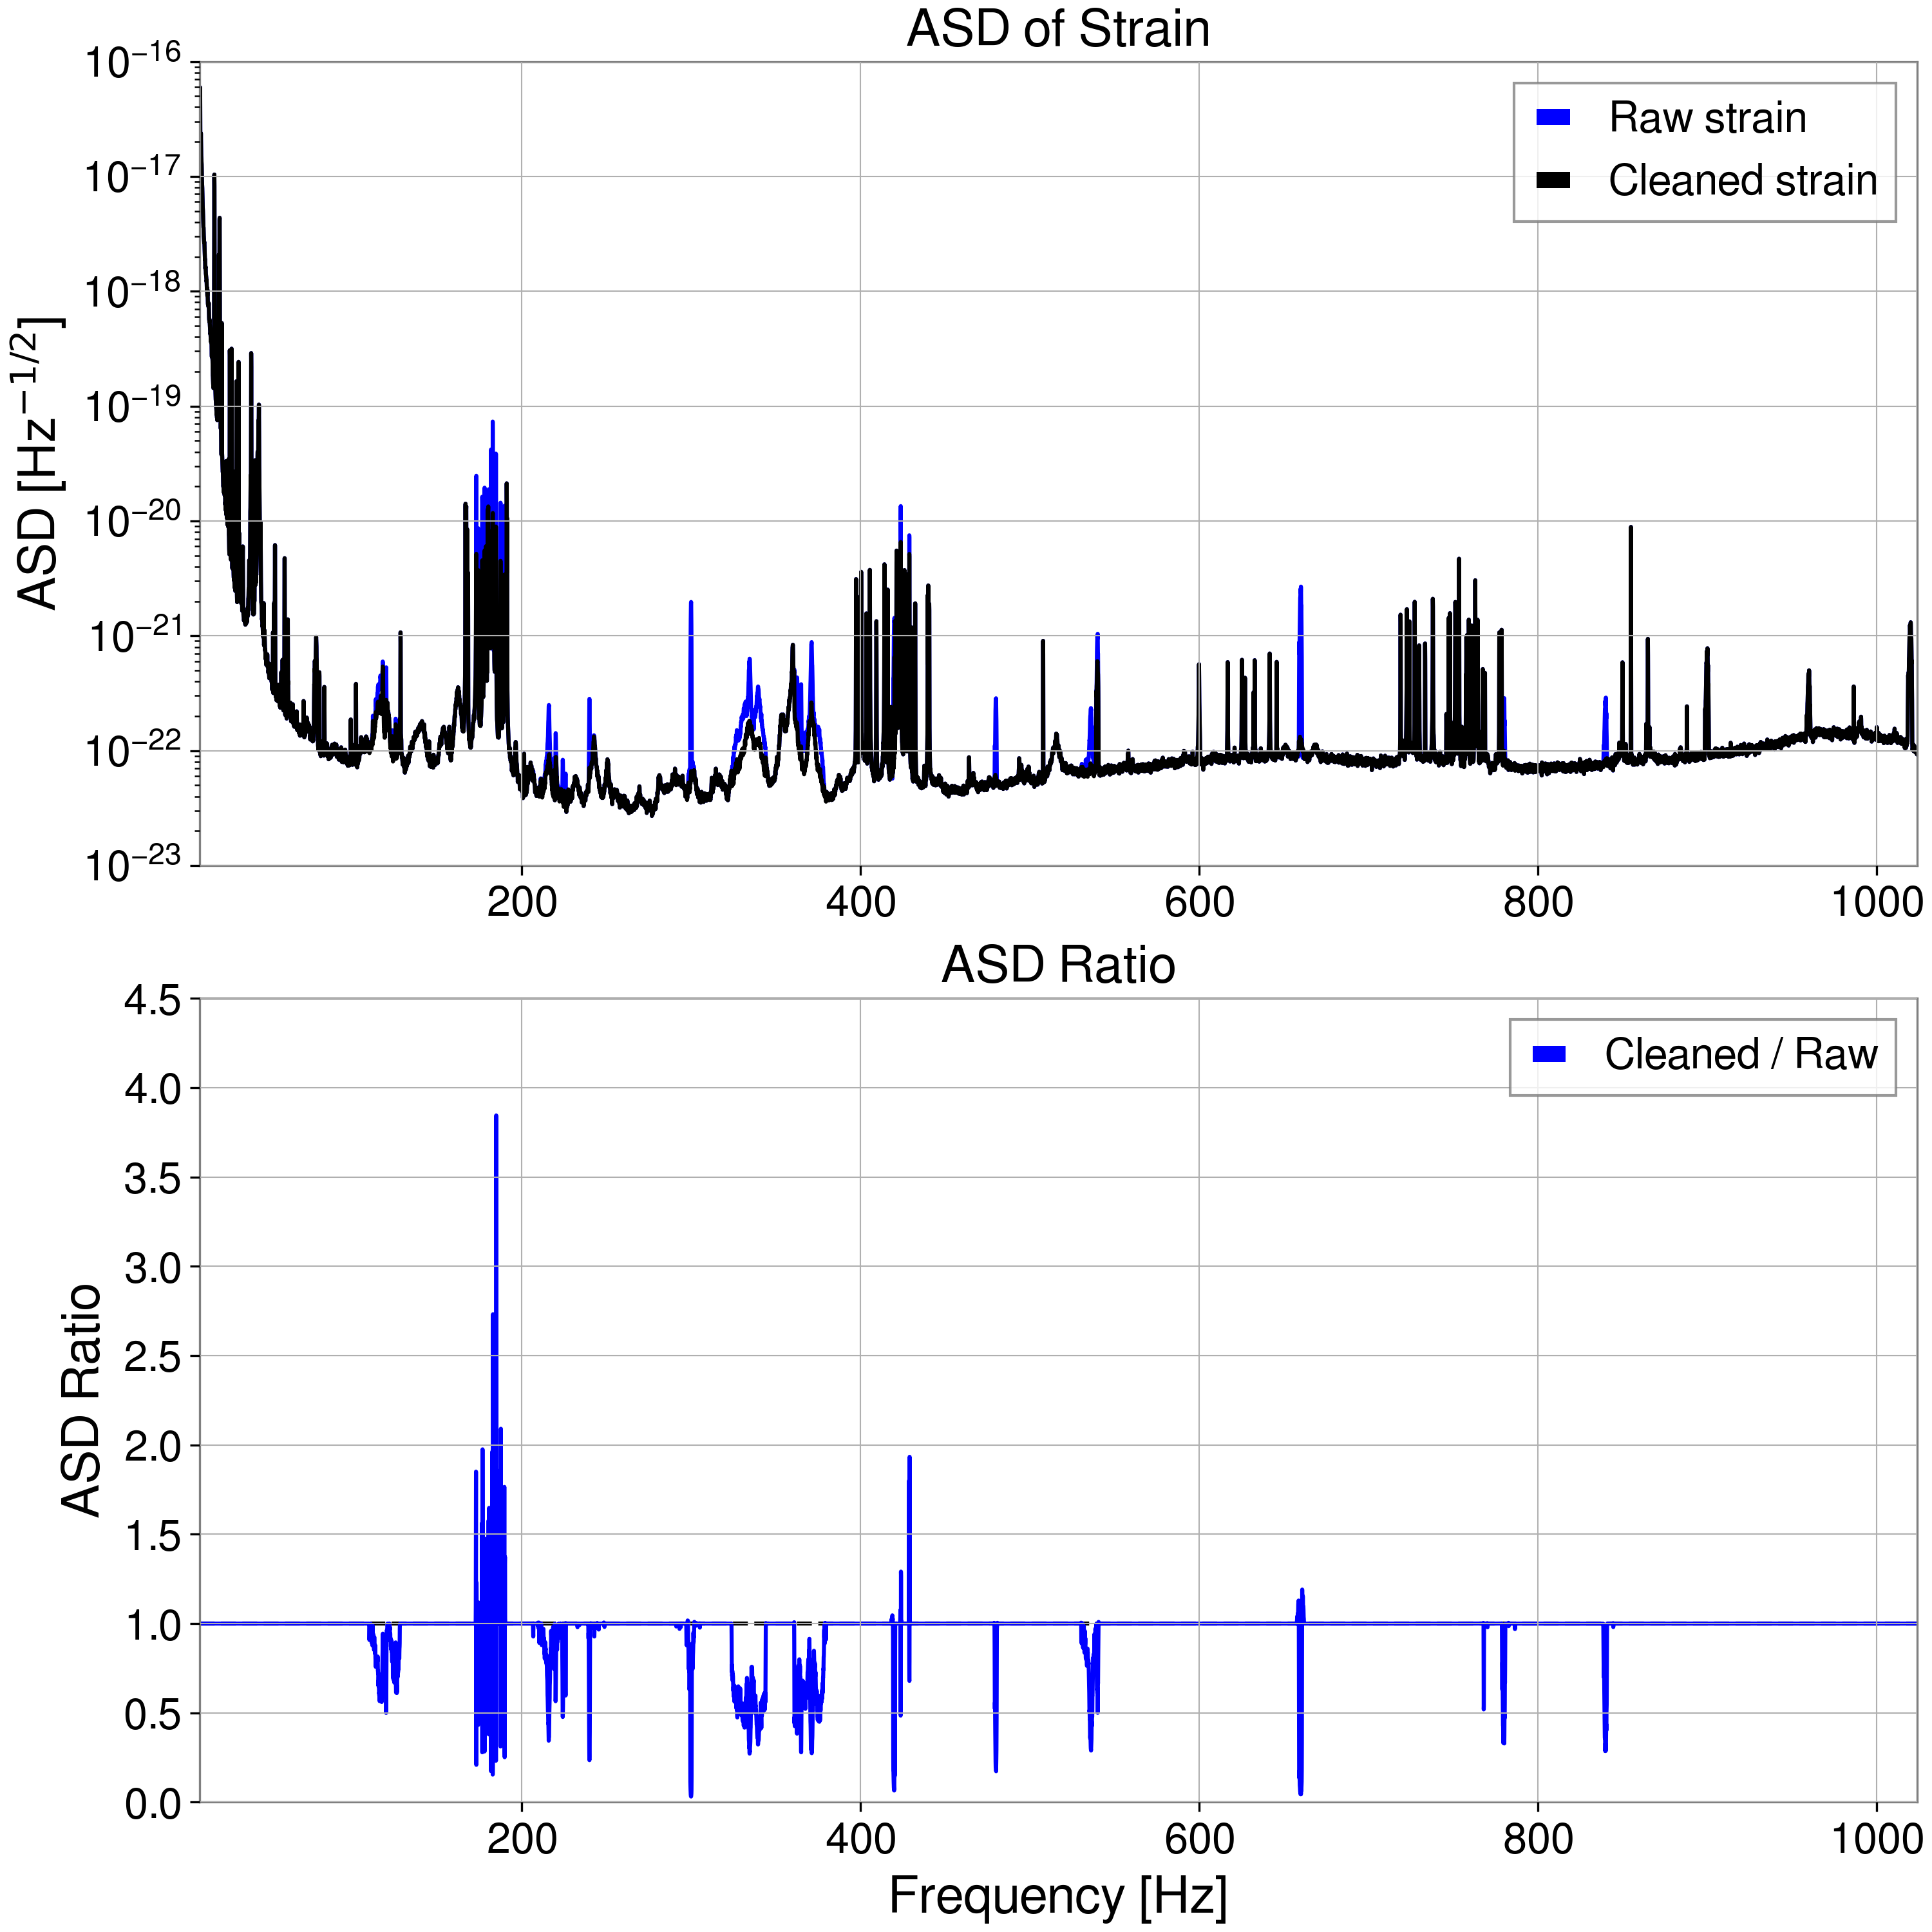
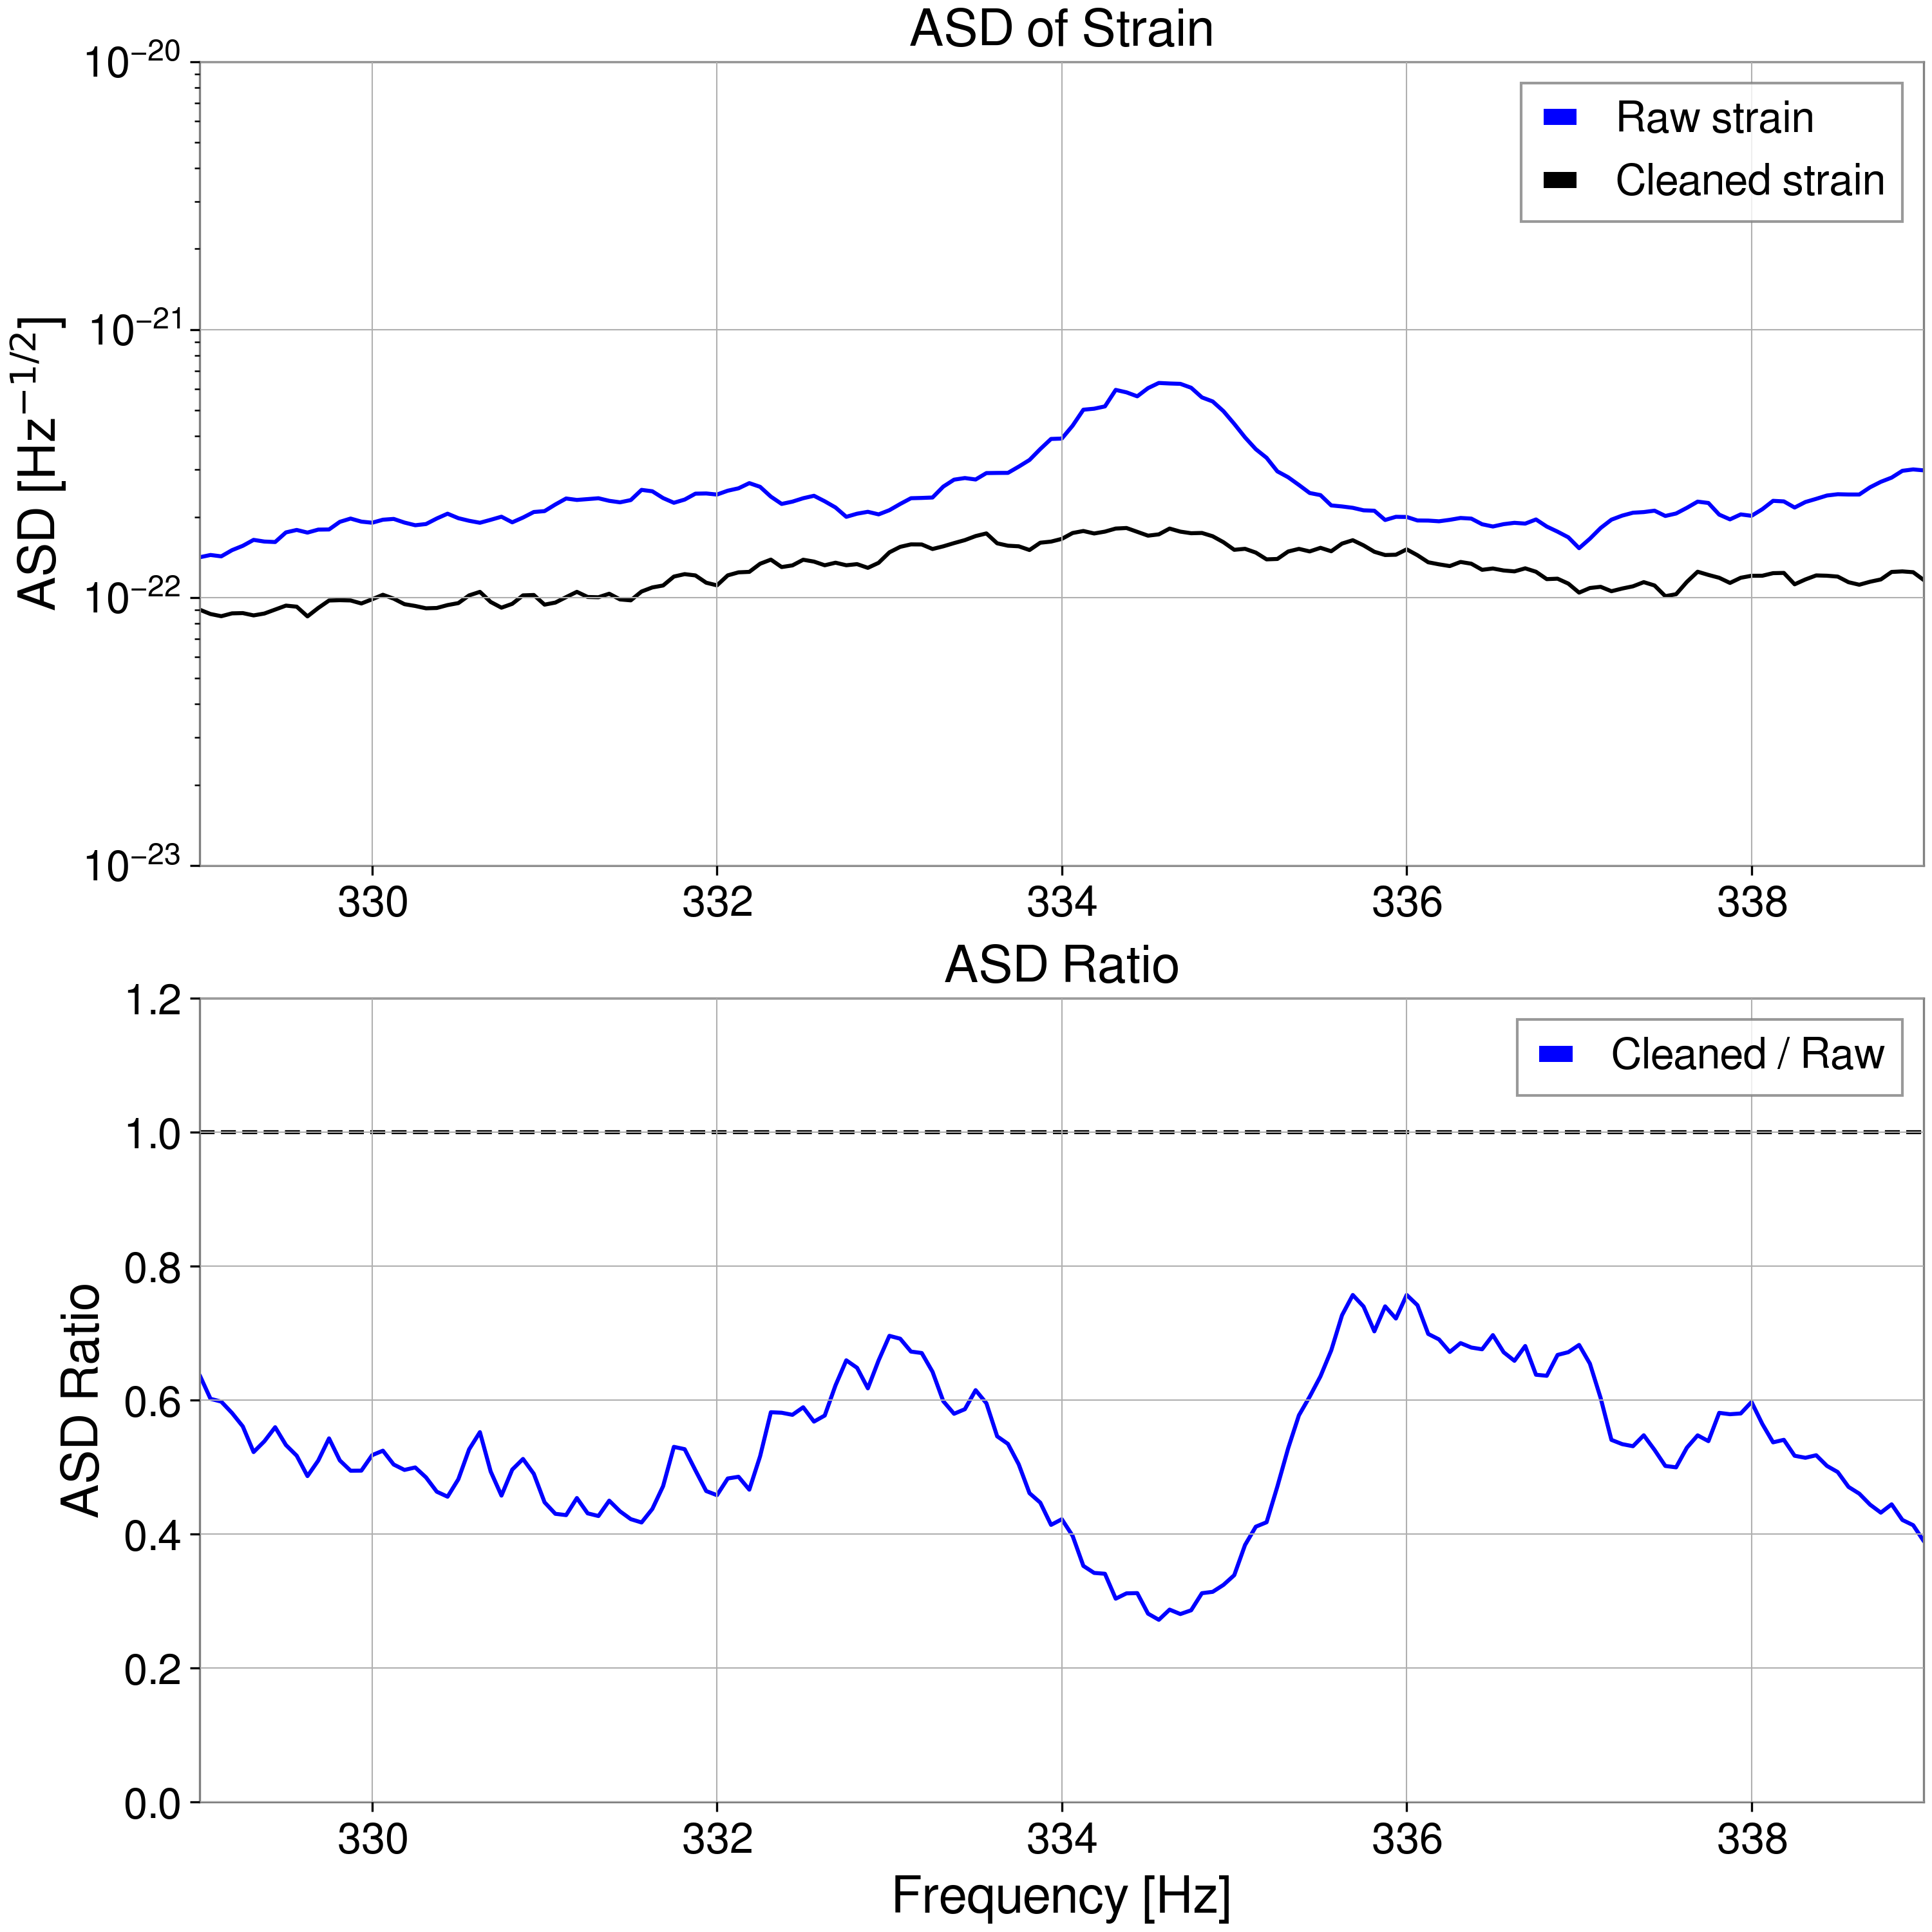
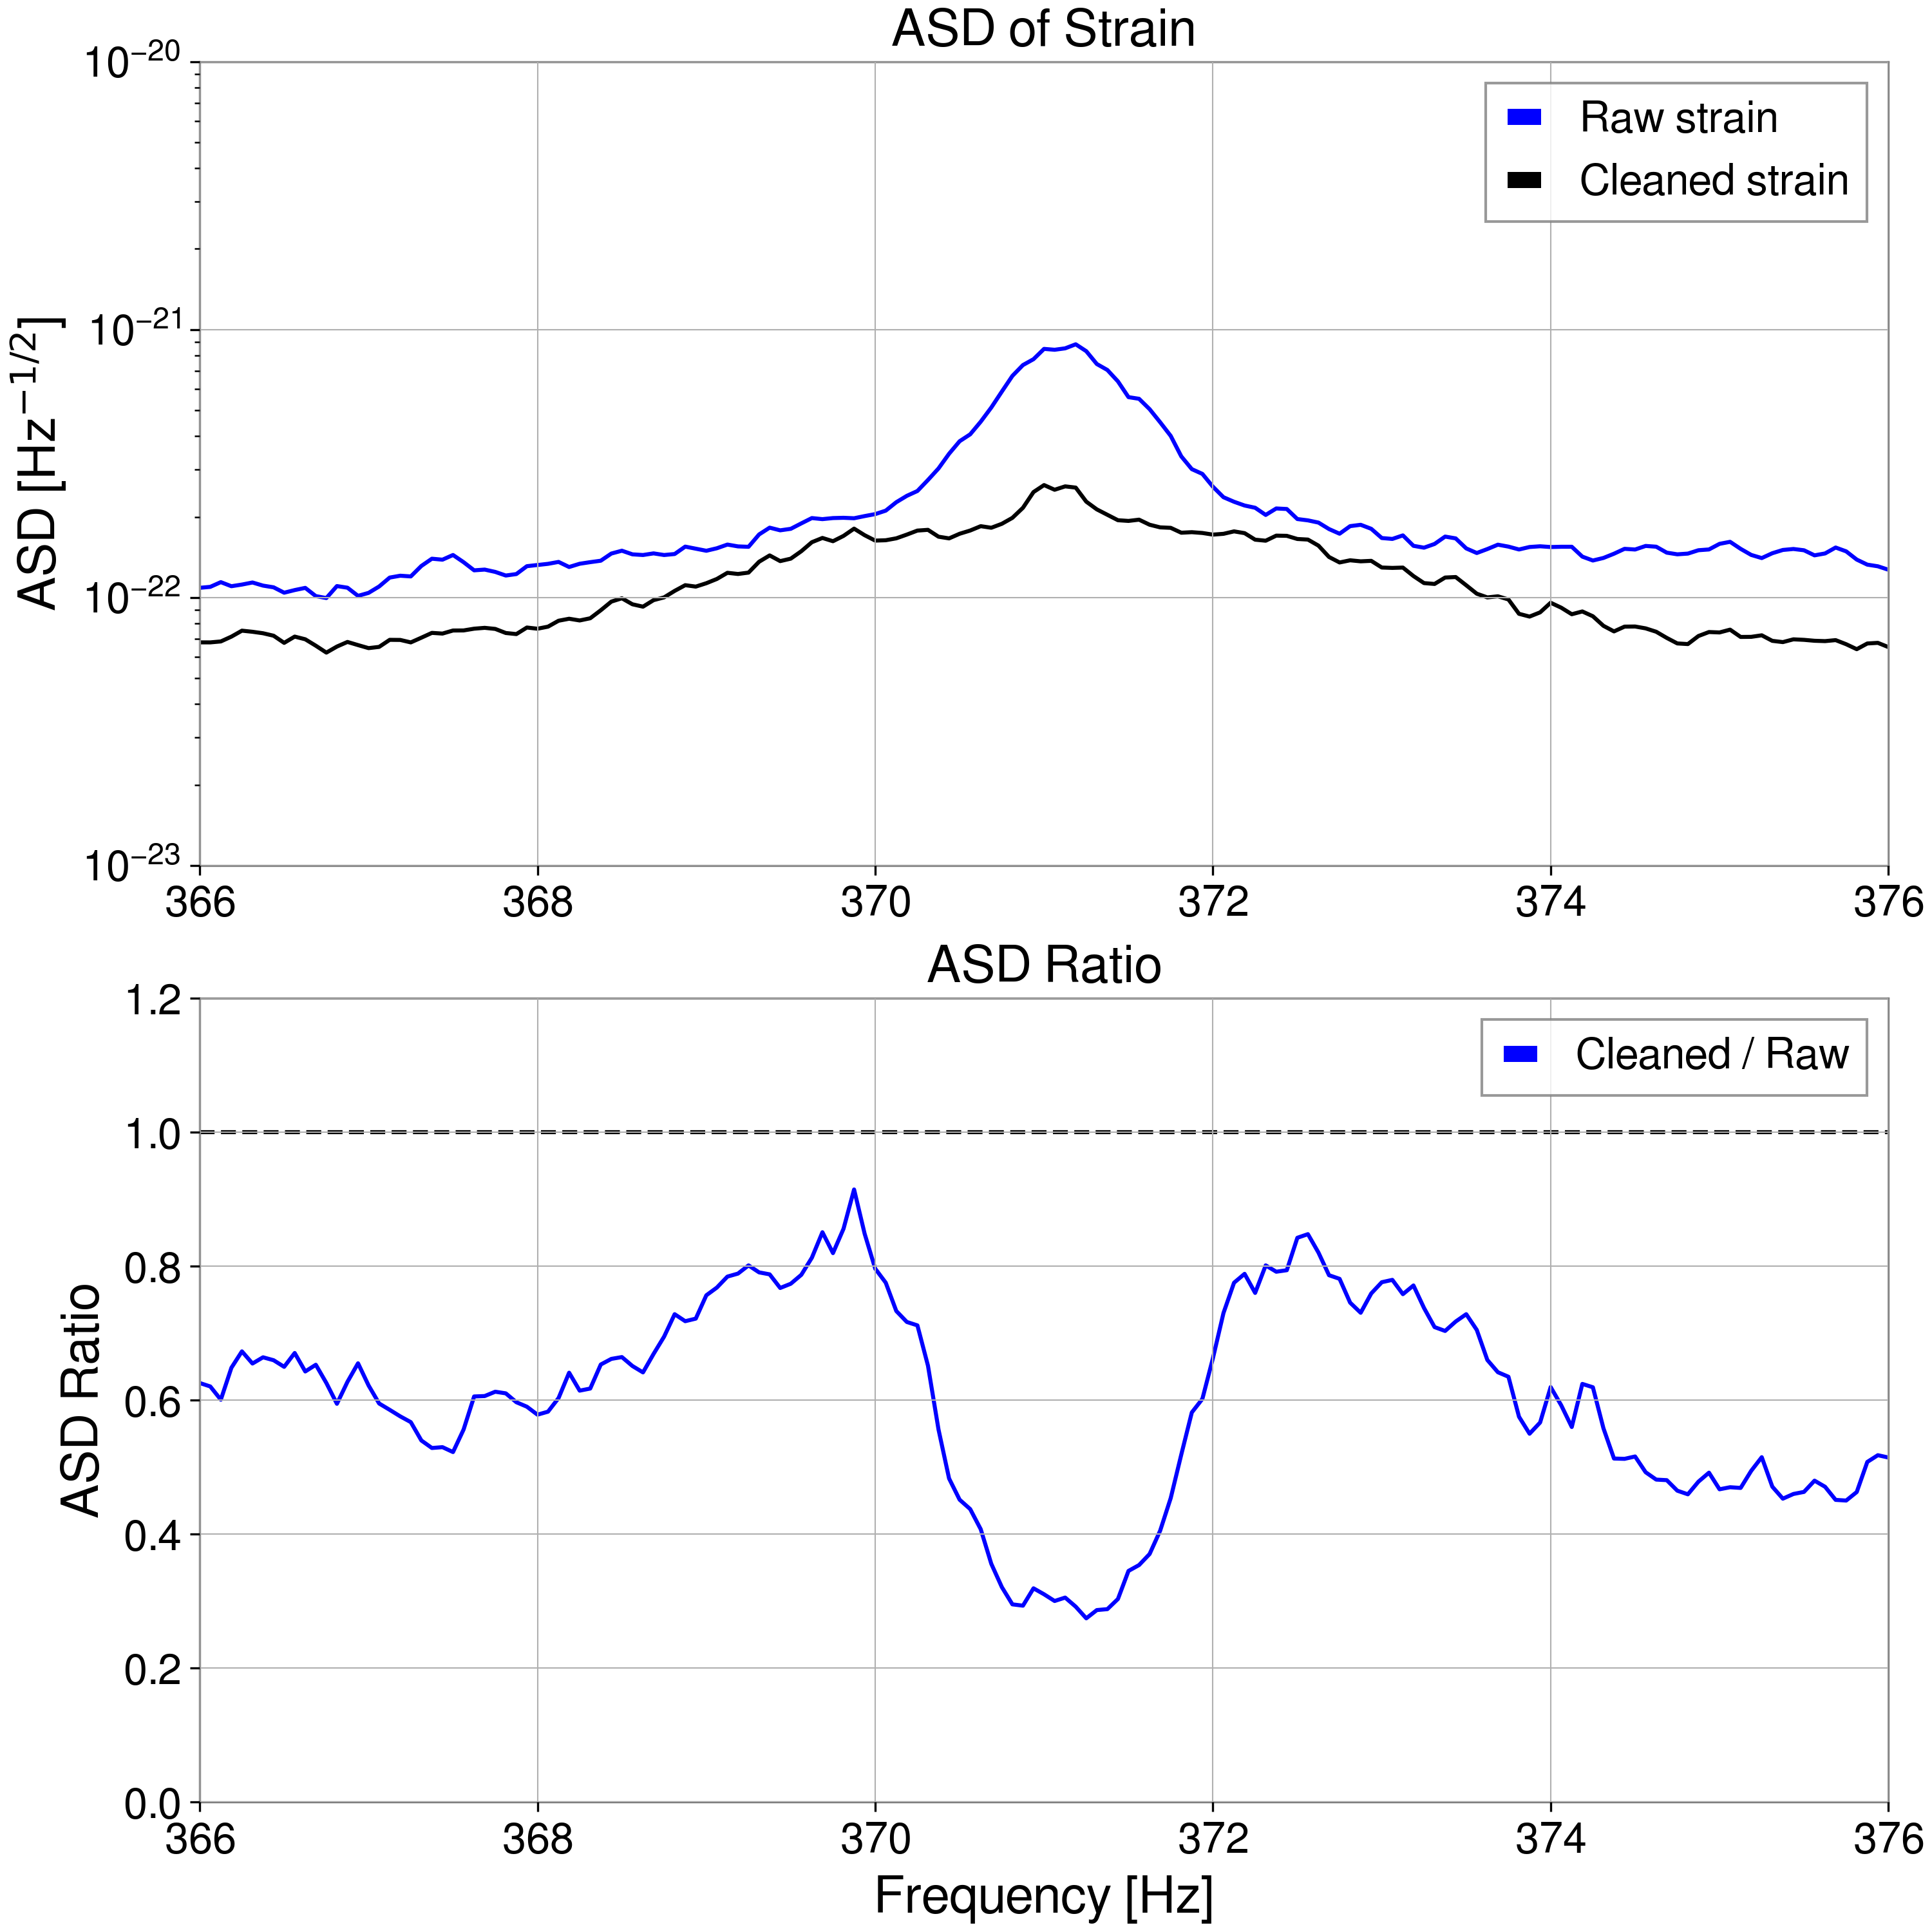
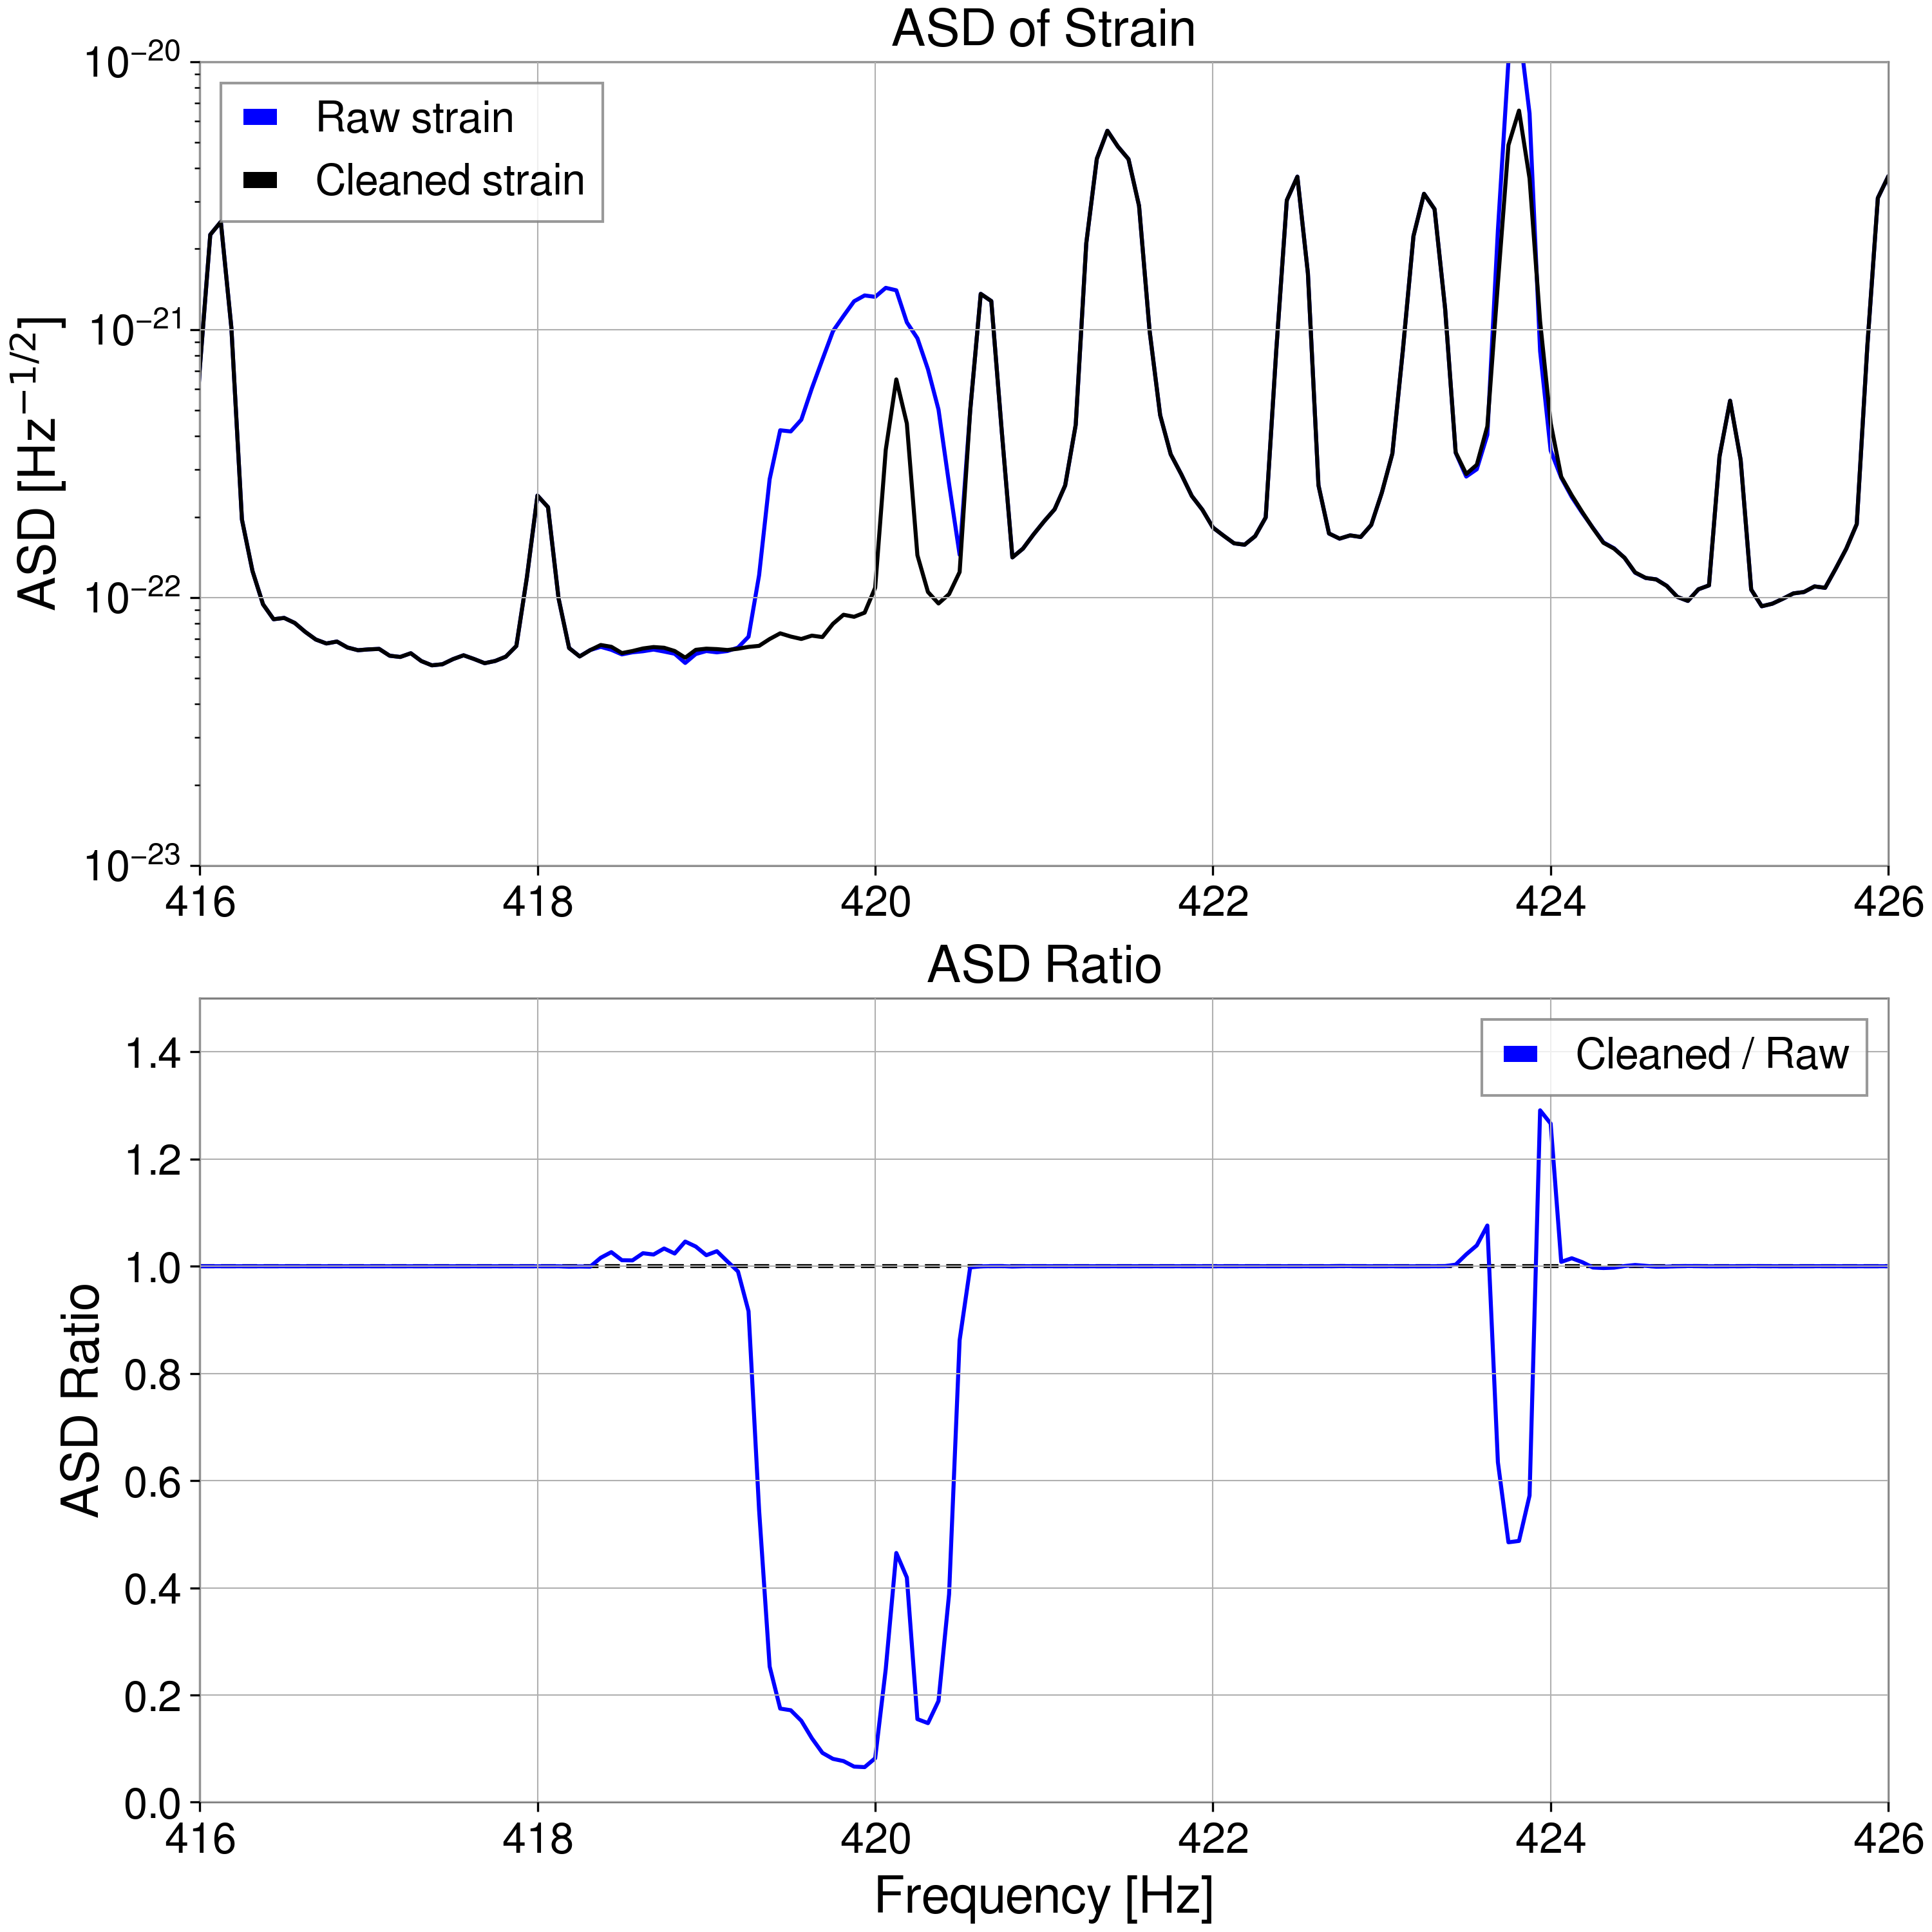
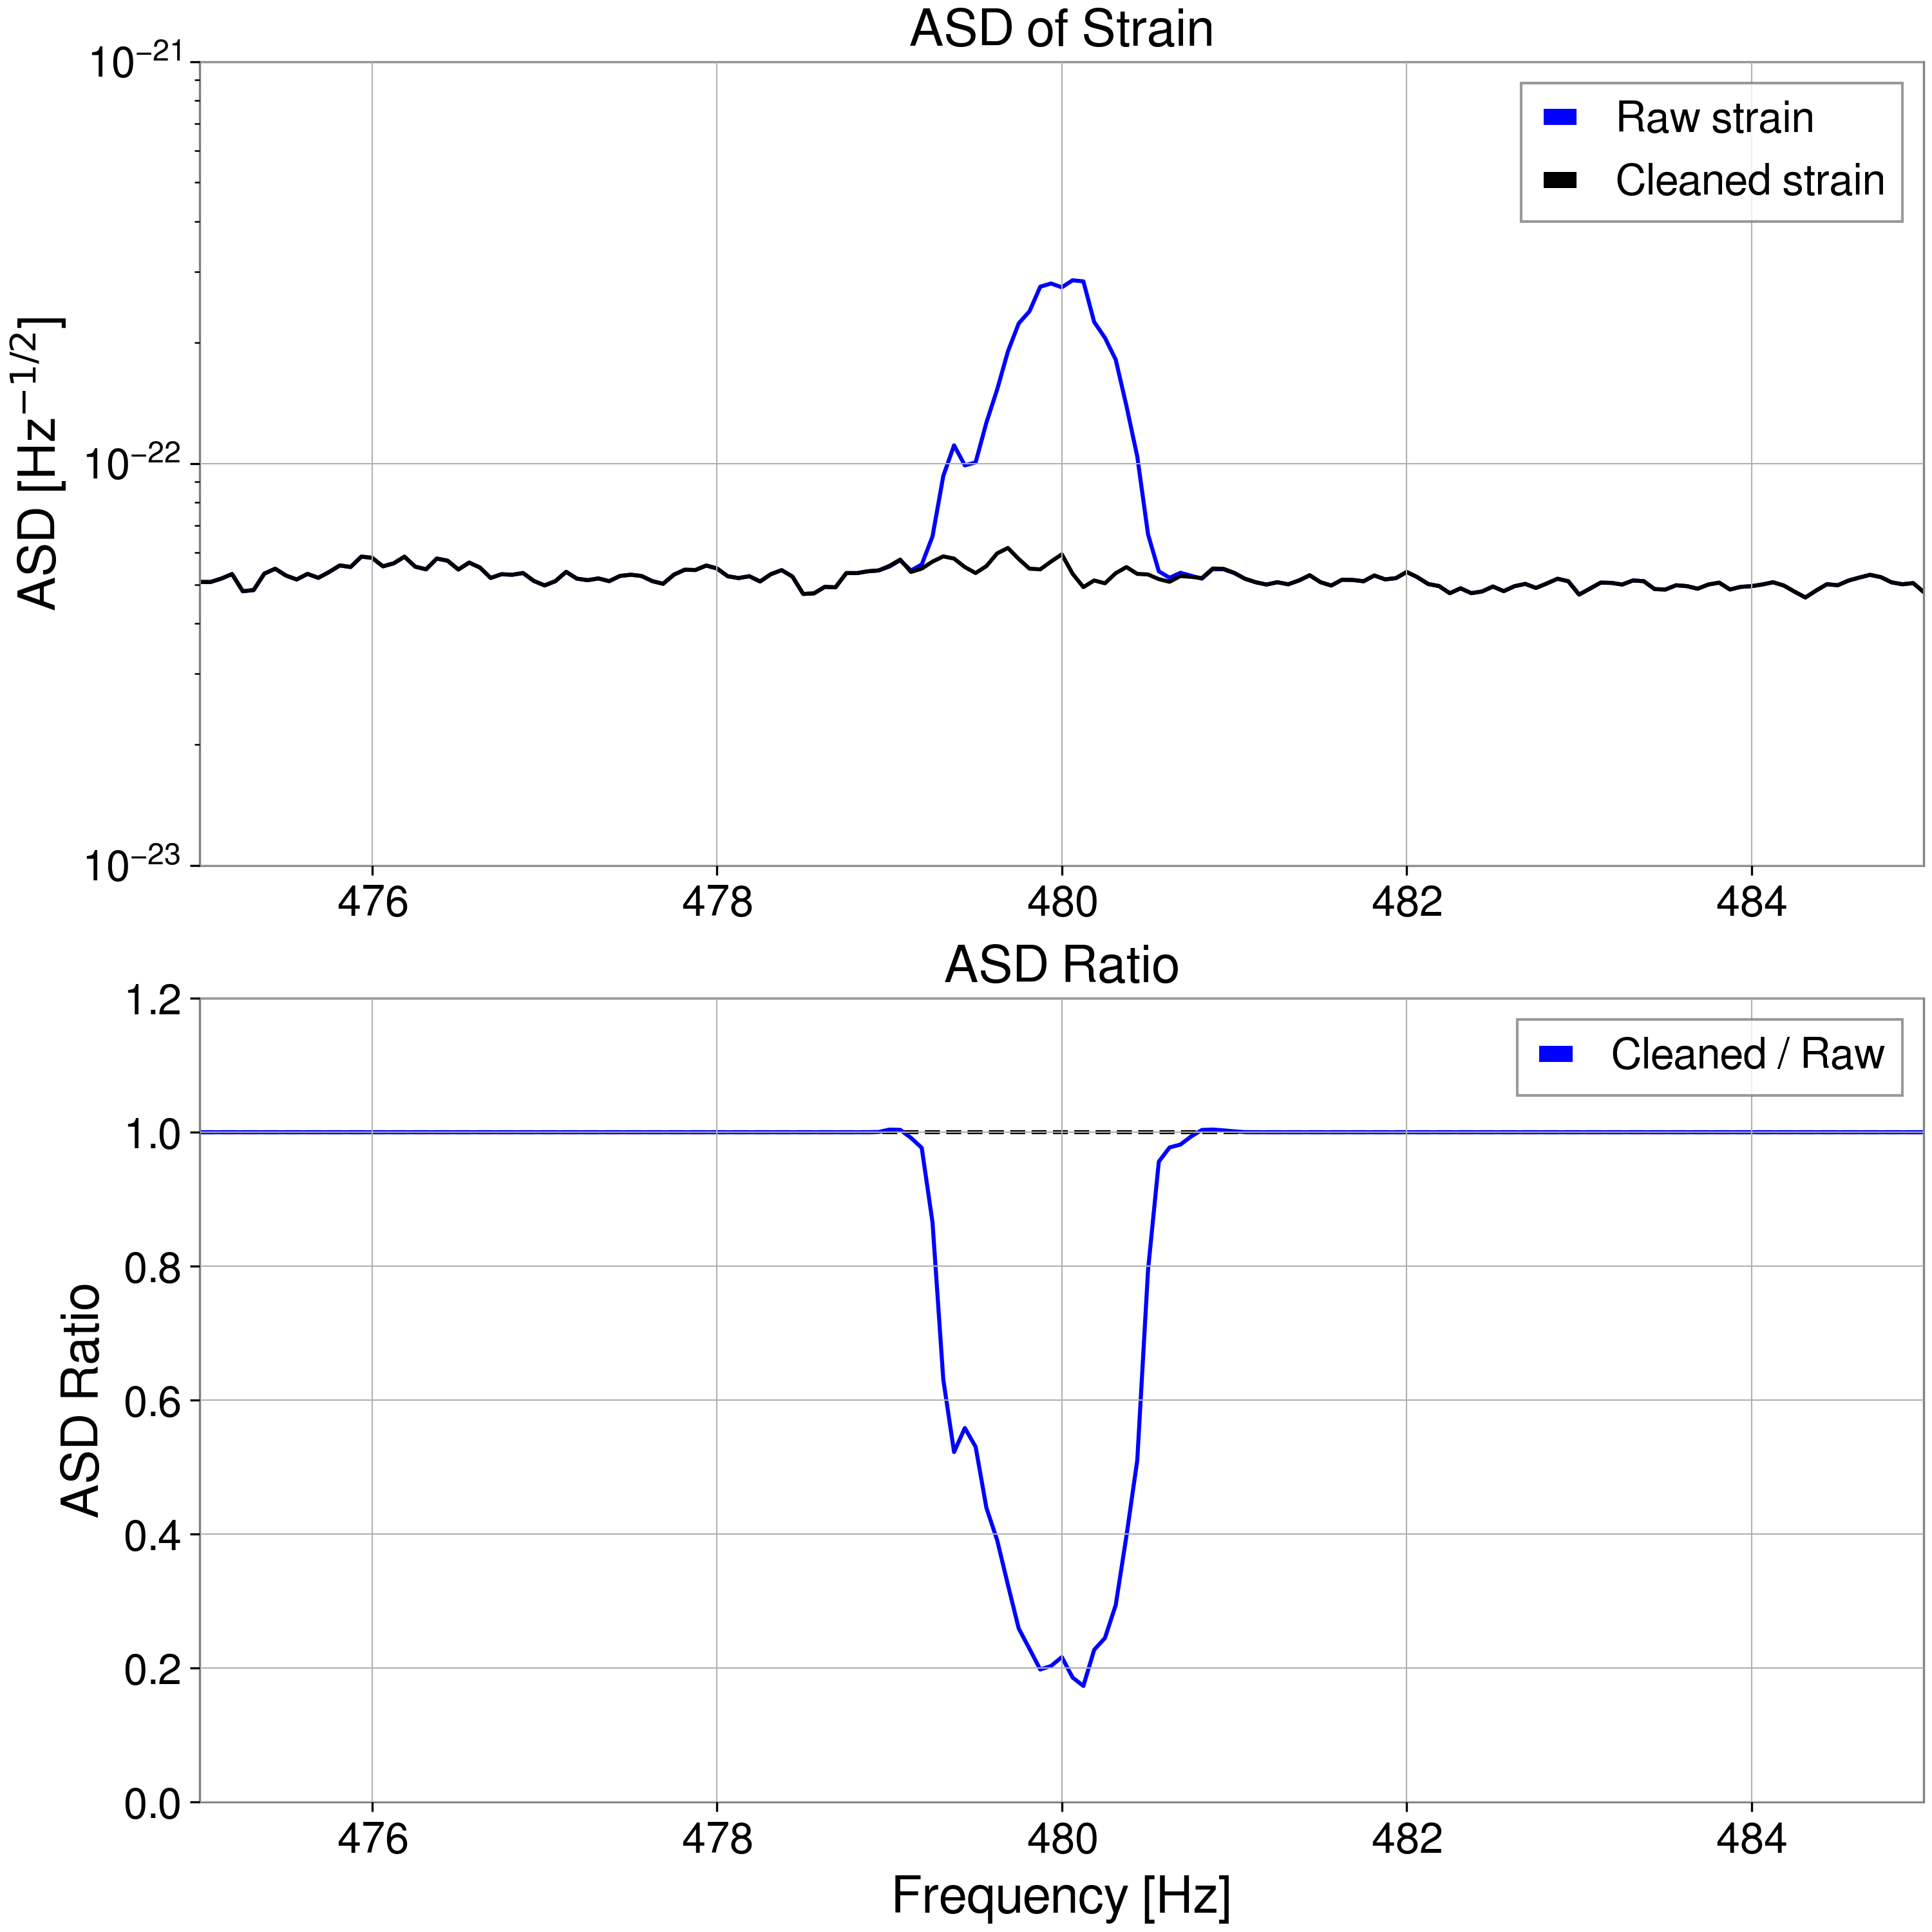
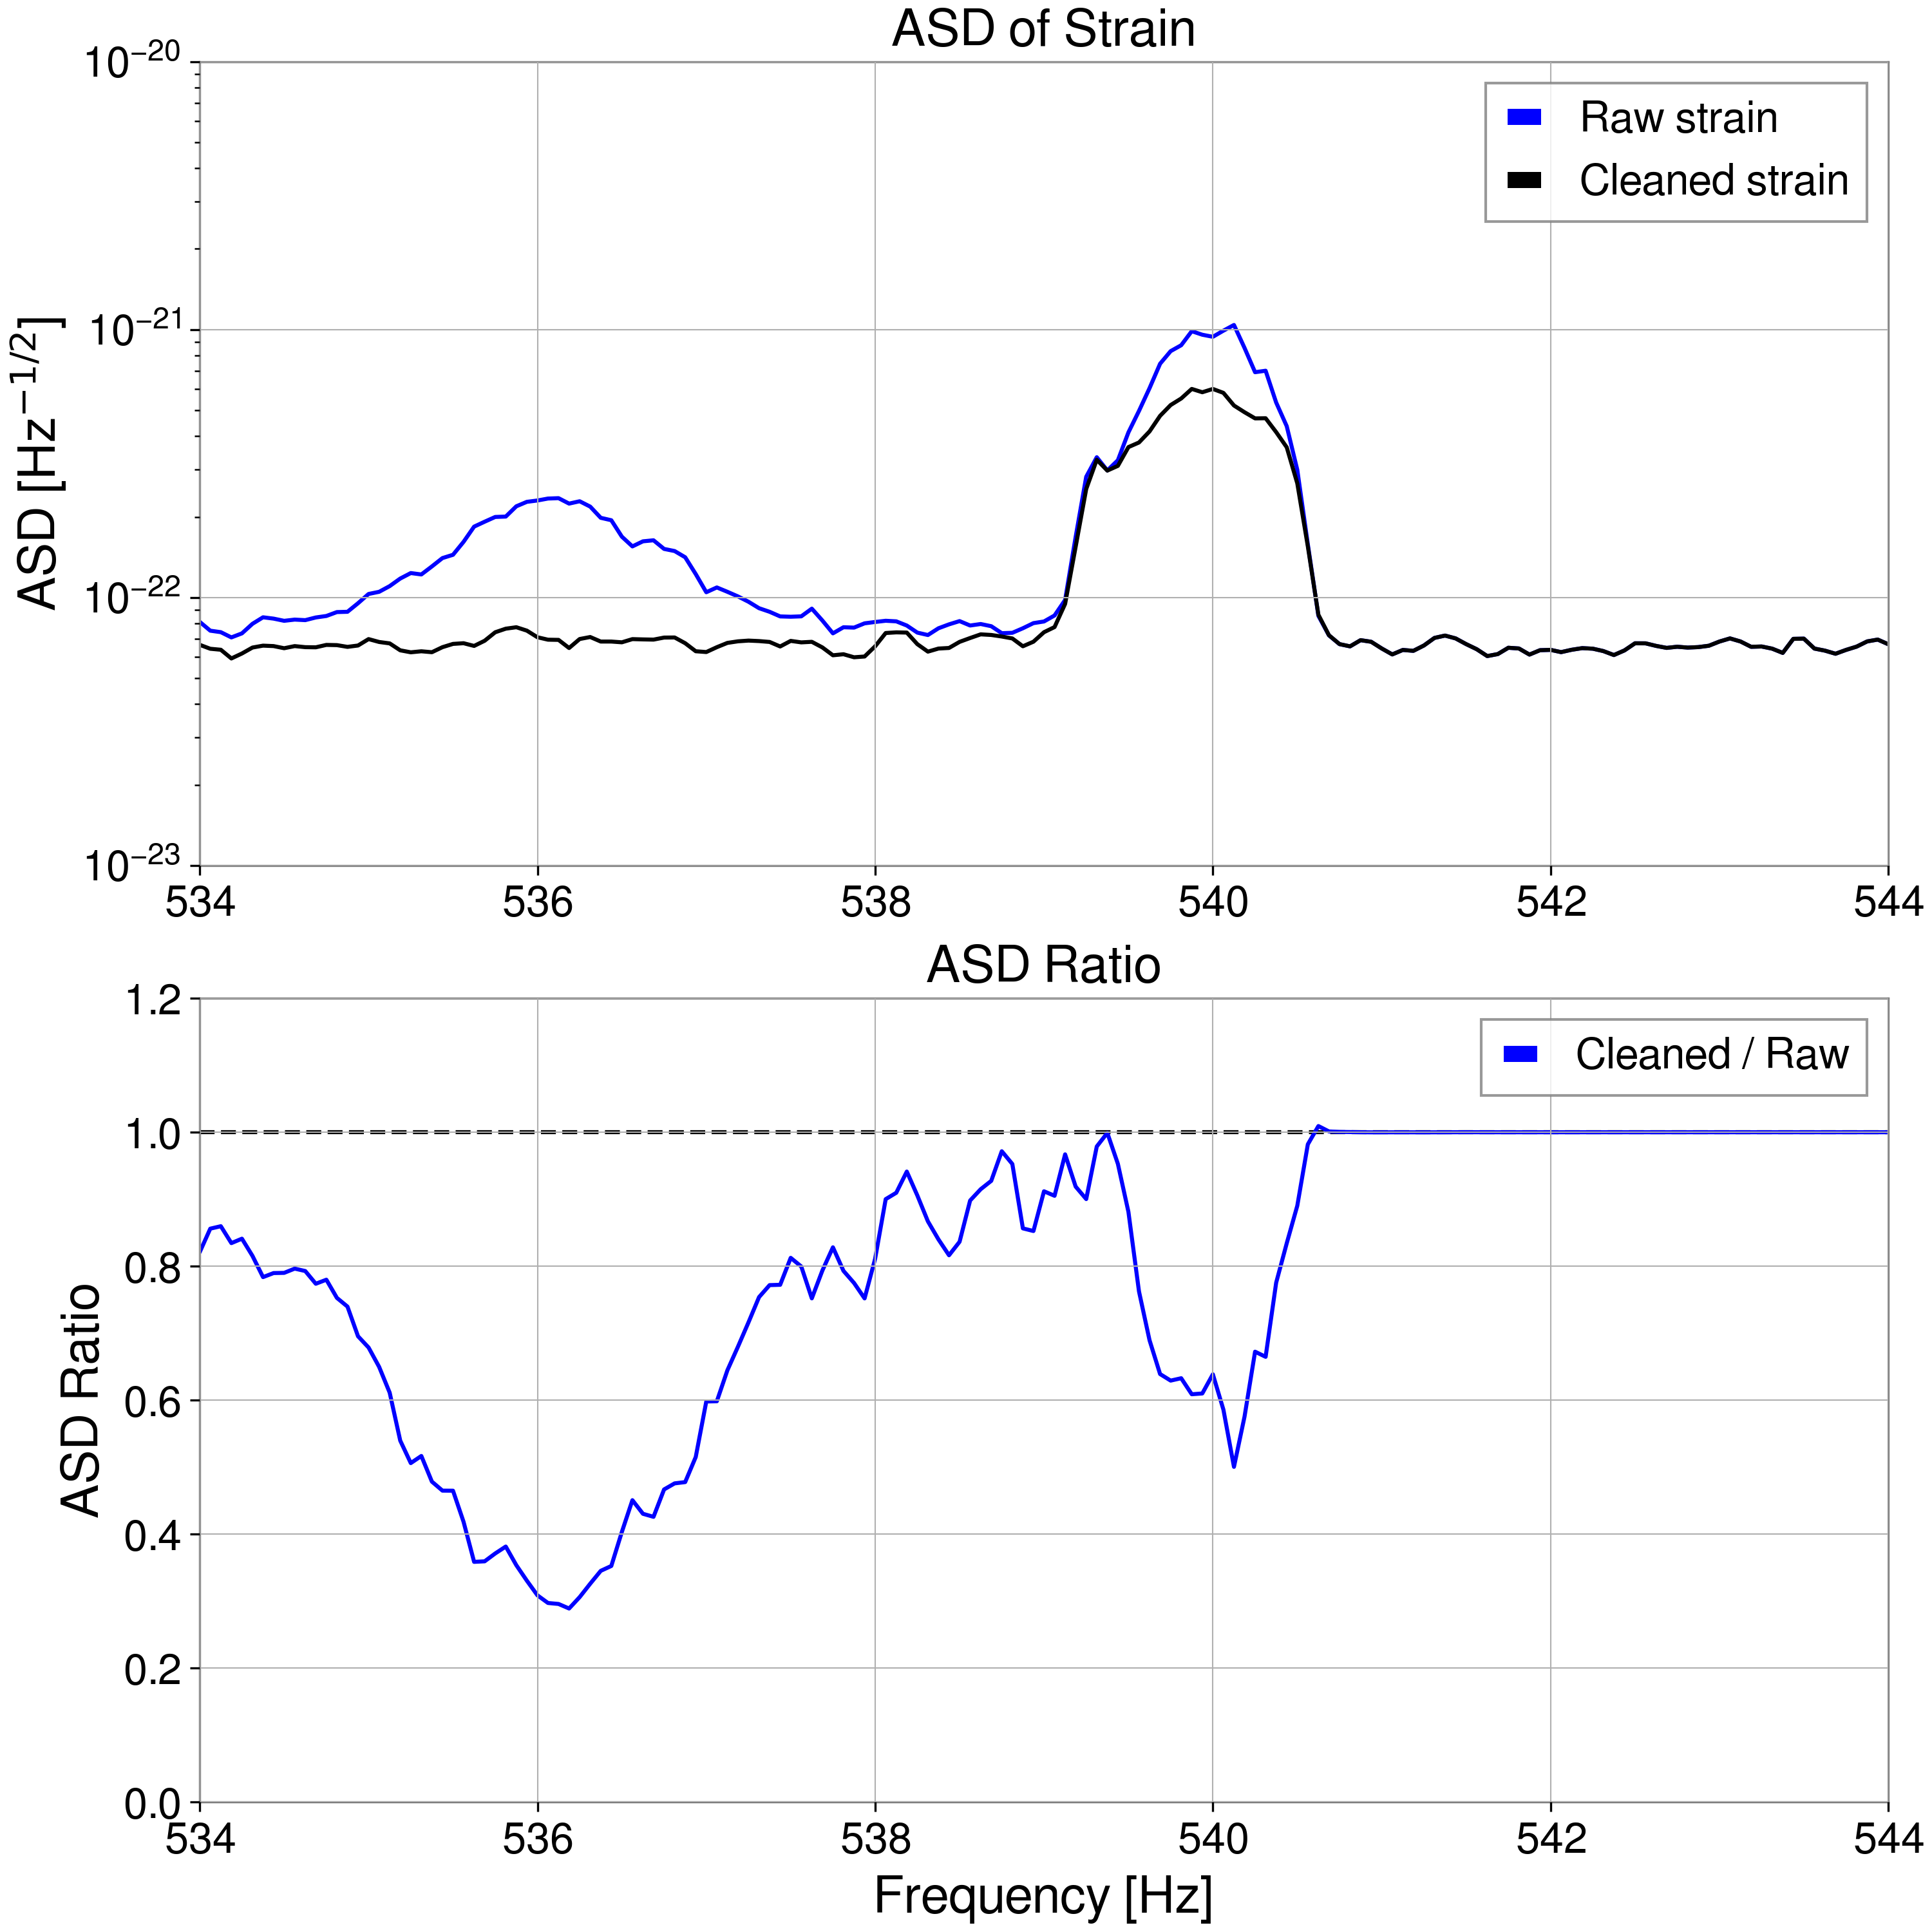
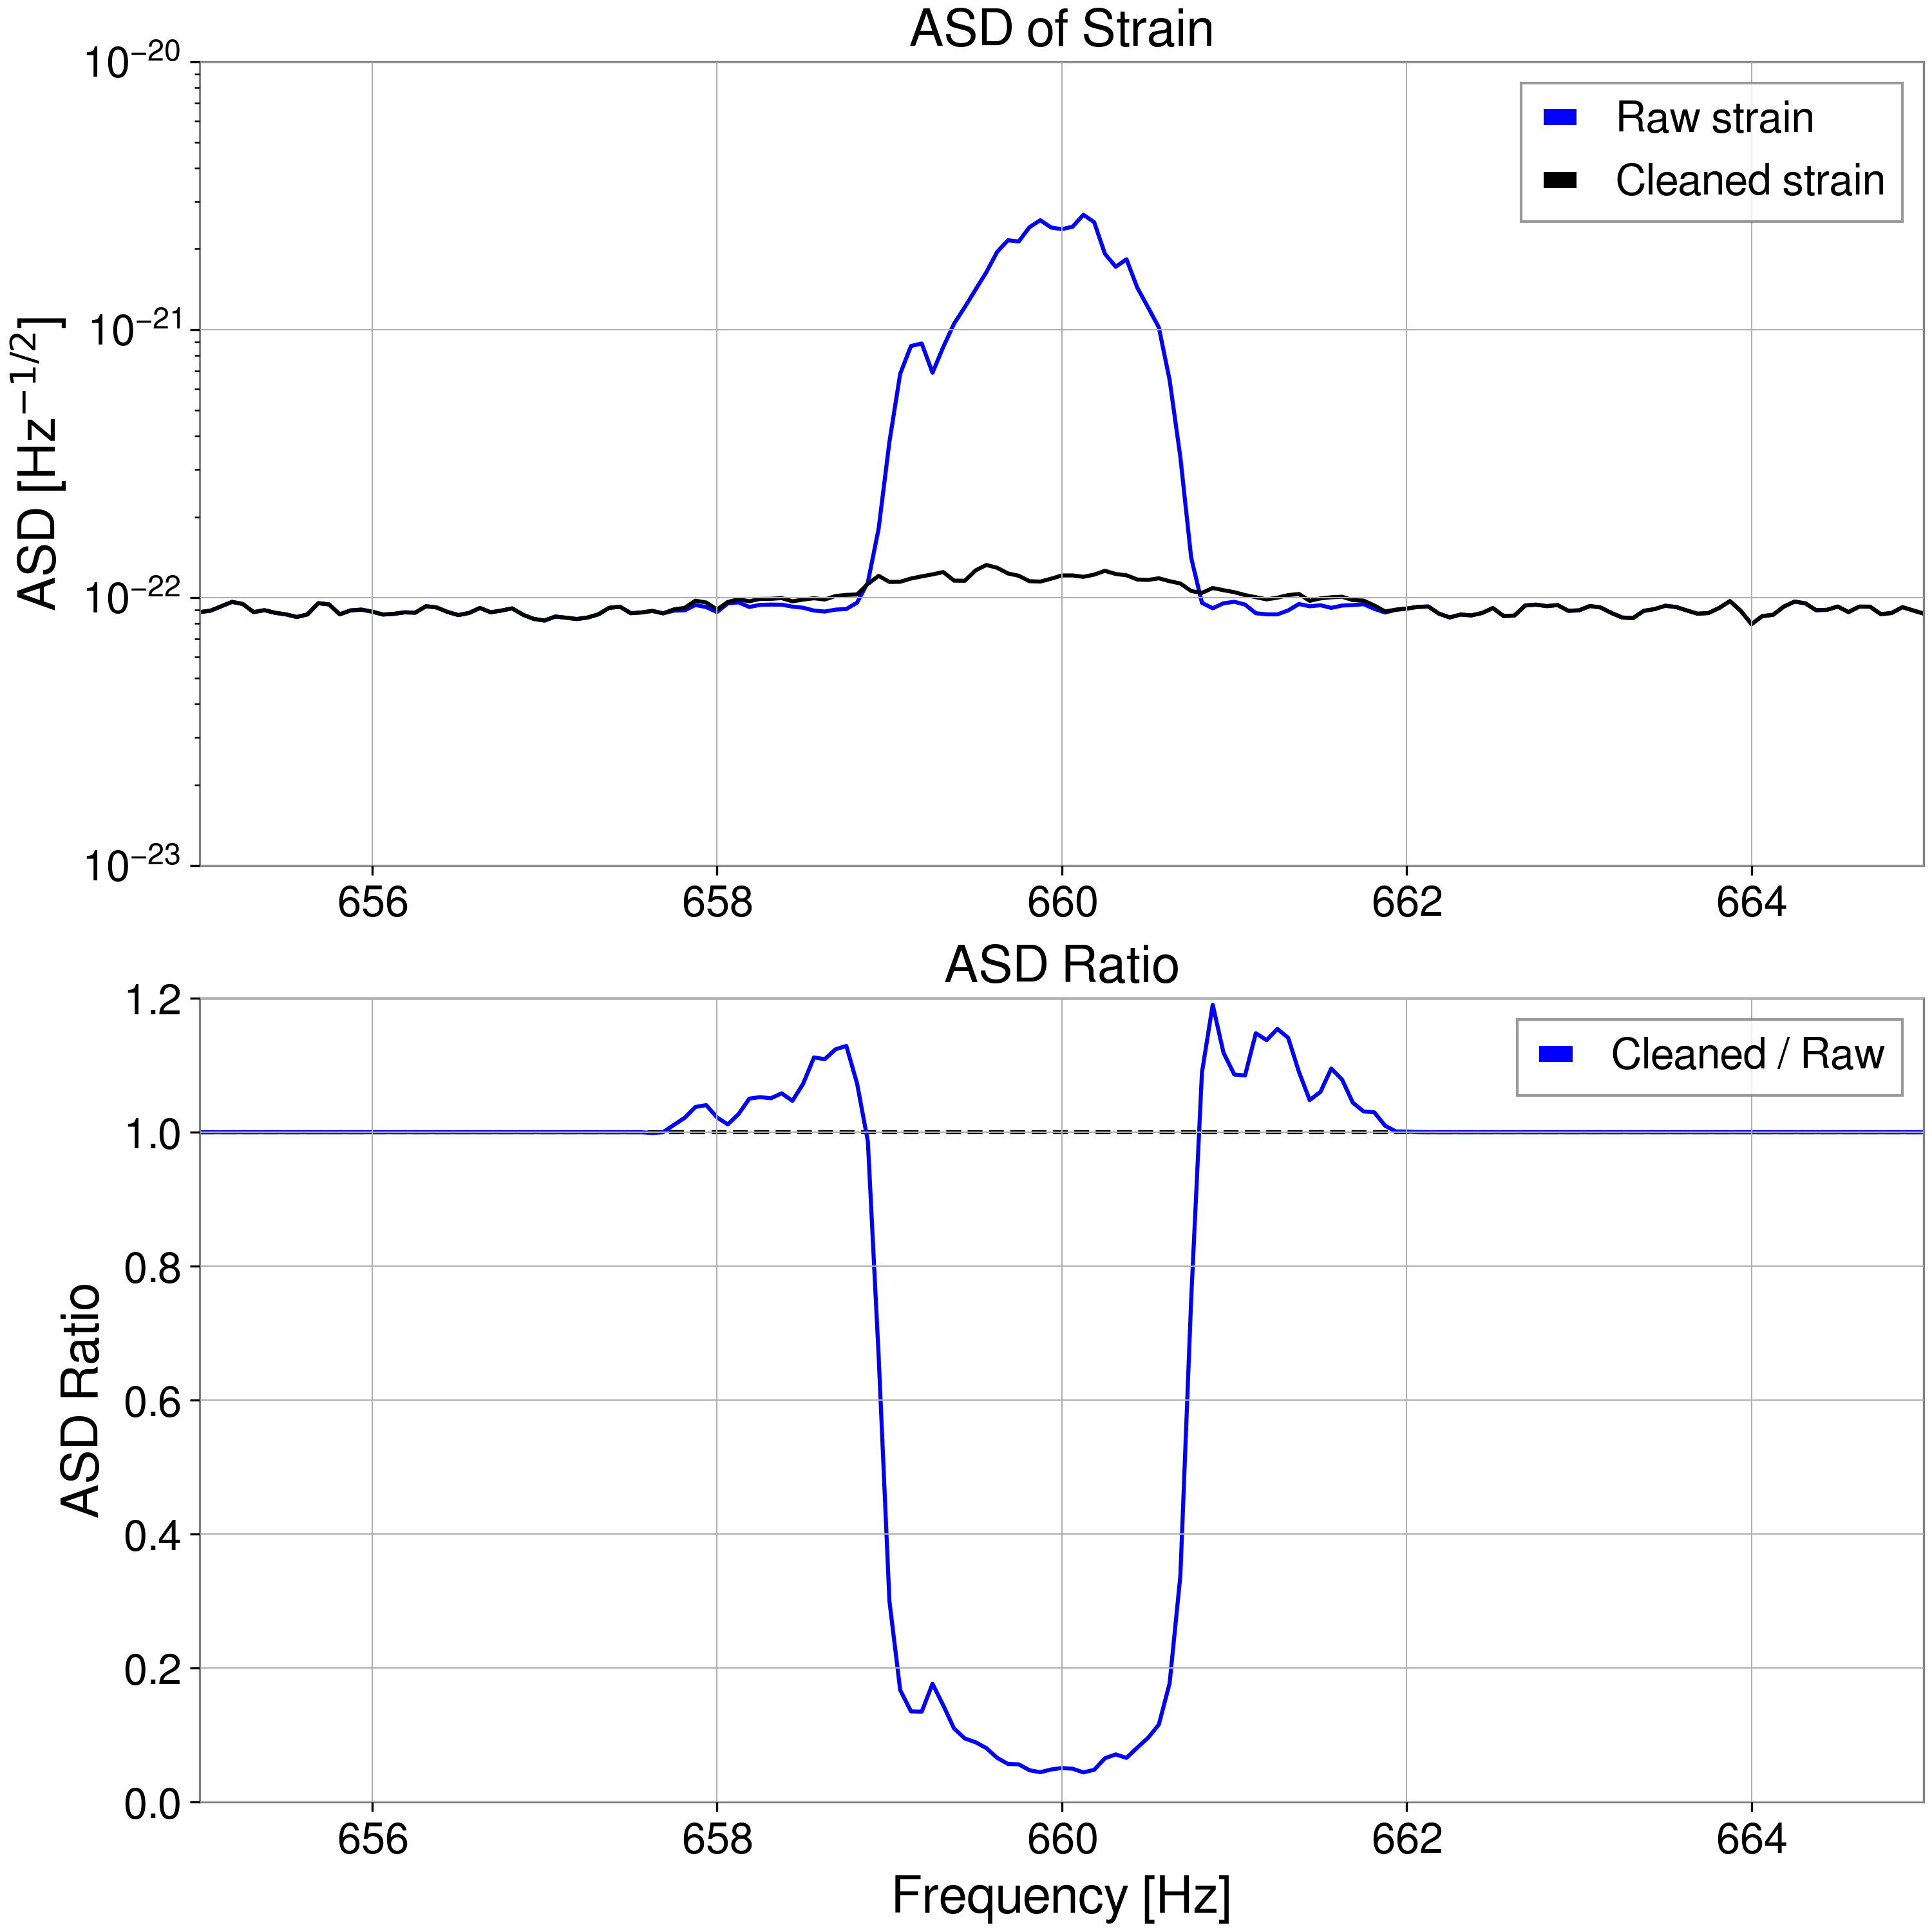
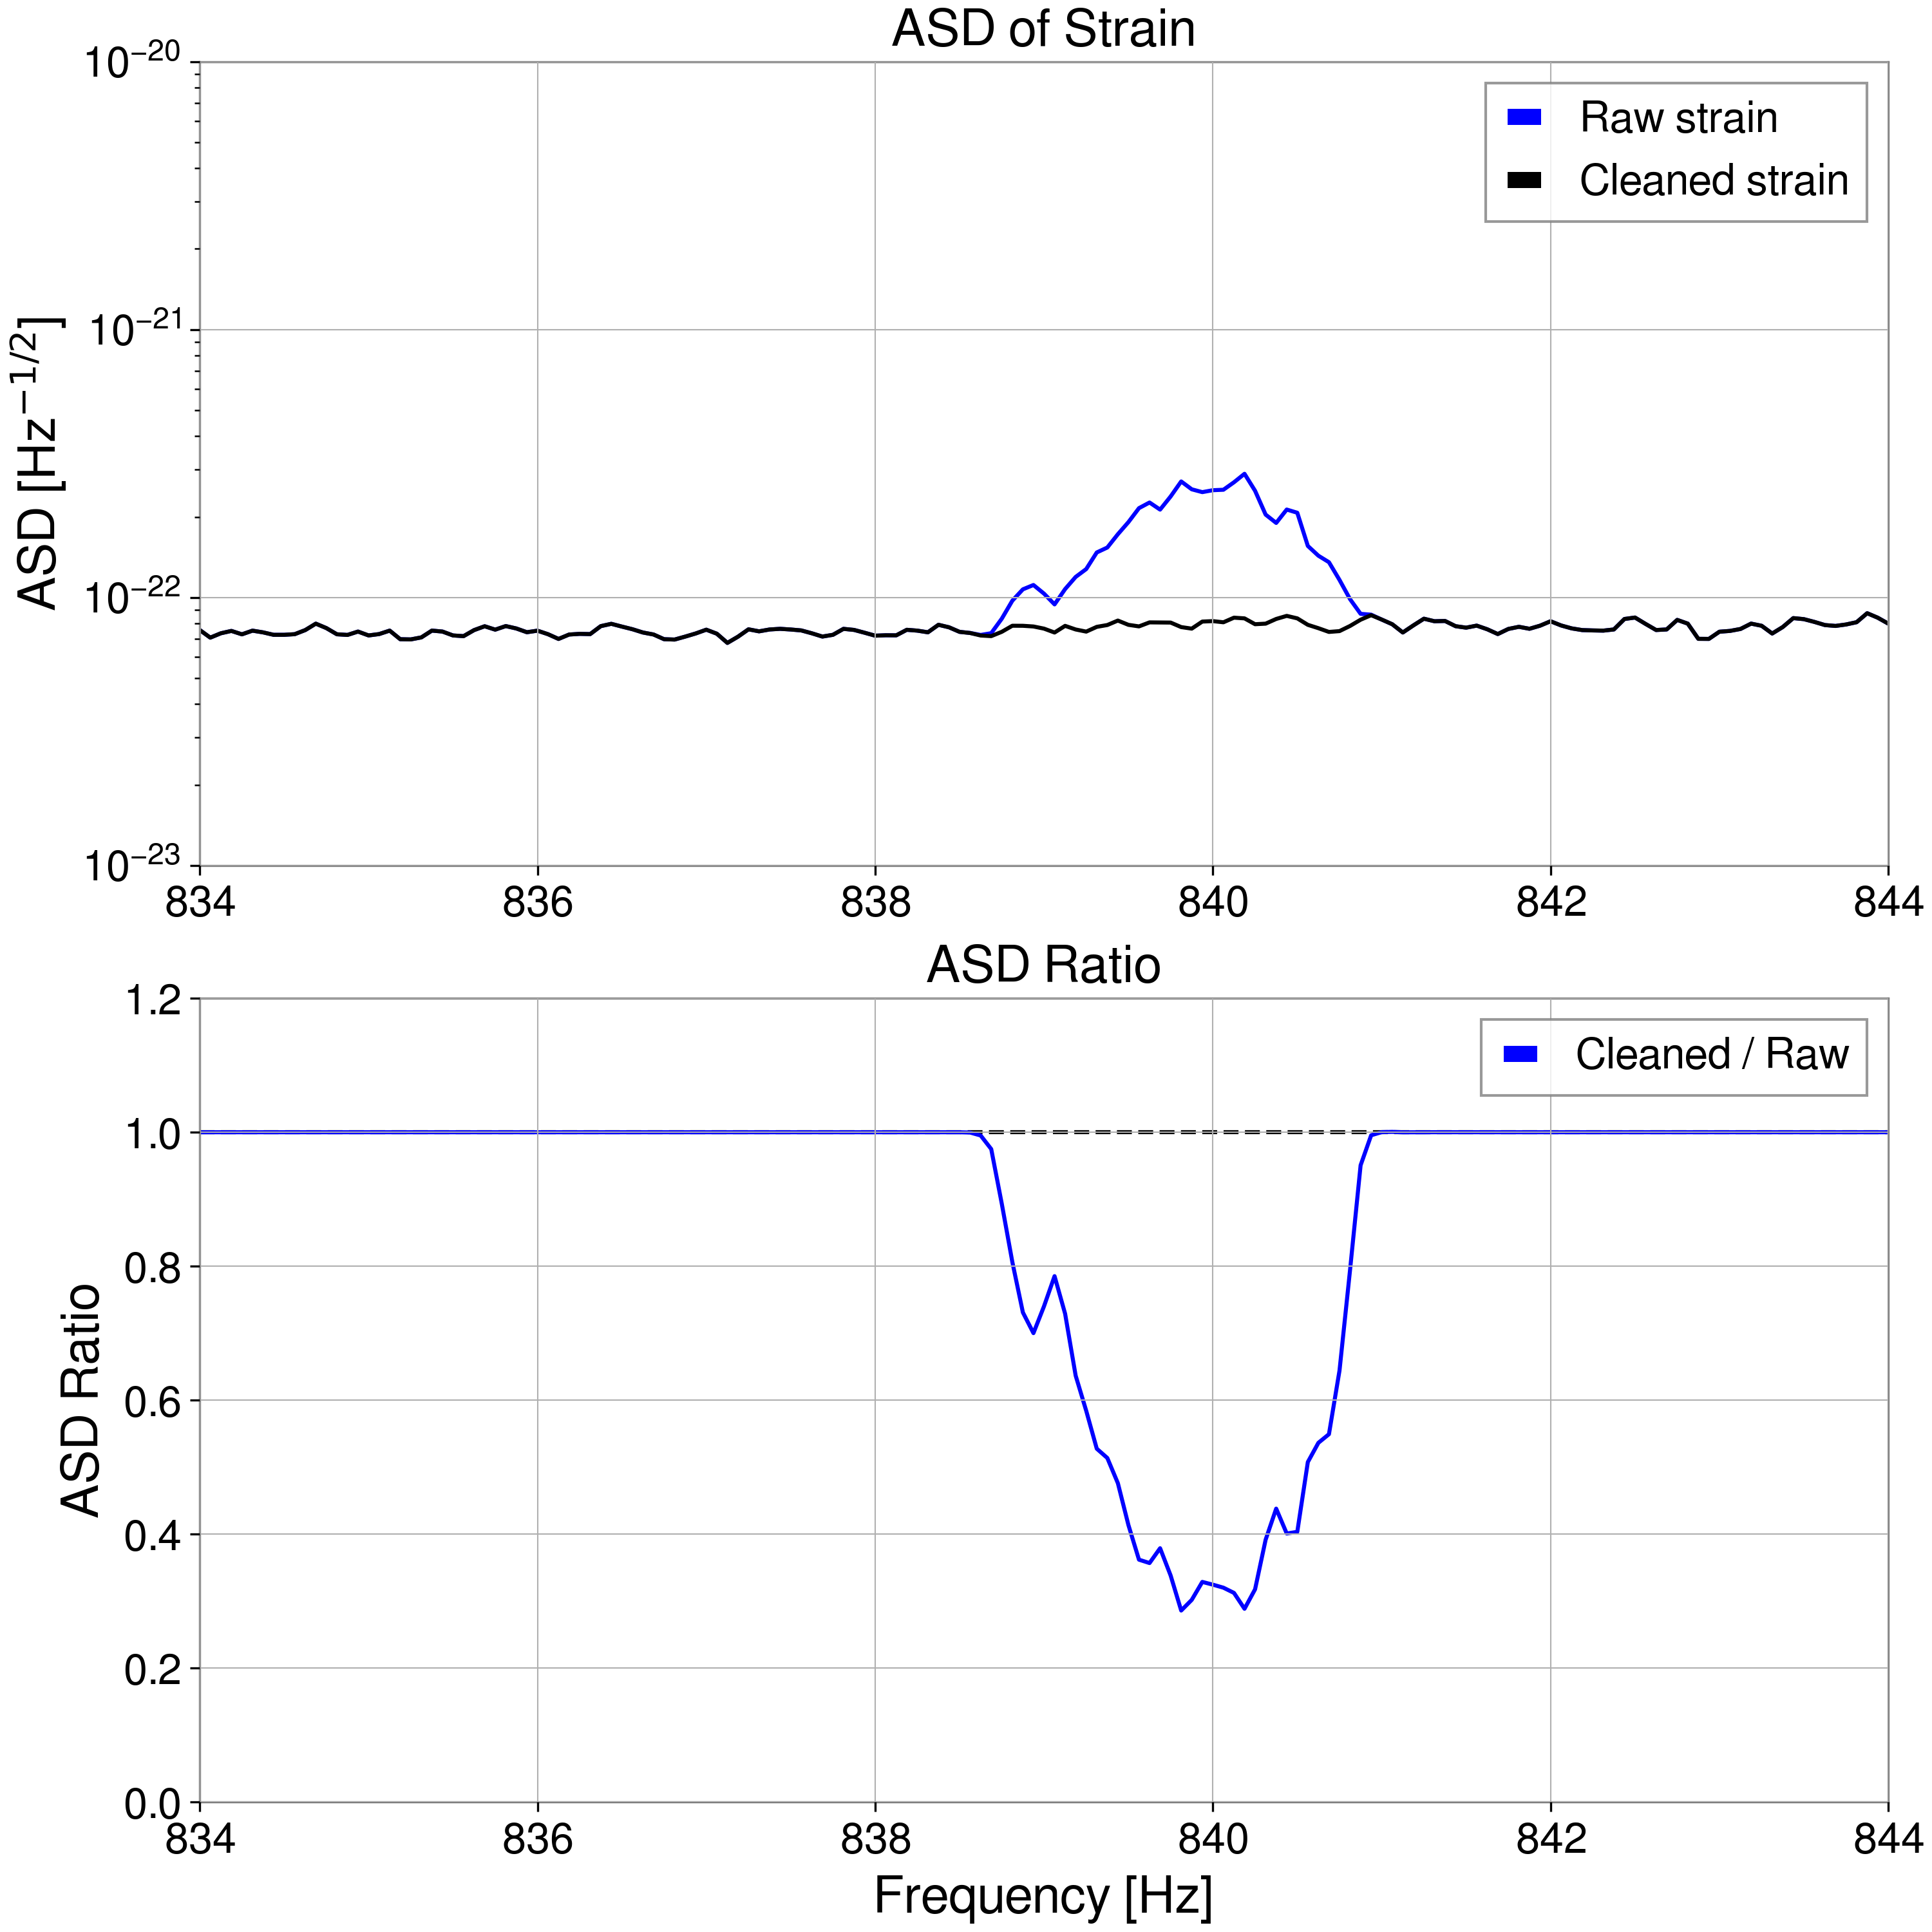
We applied Independent Component Analysis method (ICA) to clean KAGRA strain data from 1433707218 s to 1433708418 s (20:00:00, Jun 11, 2025 UTC ~ 20:20:00, Jun 11, 2025 UTC).

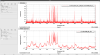
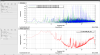
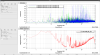
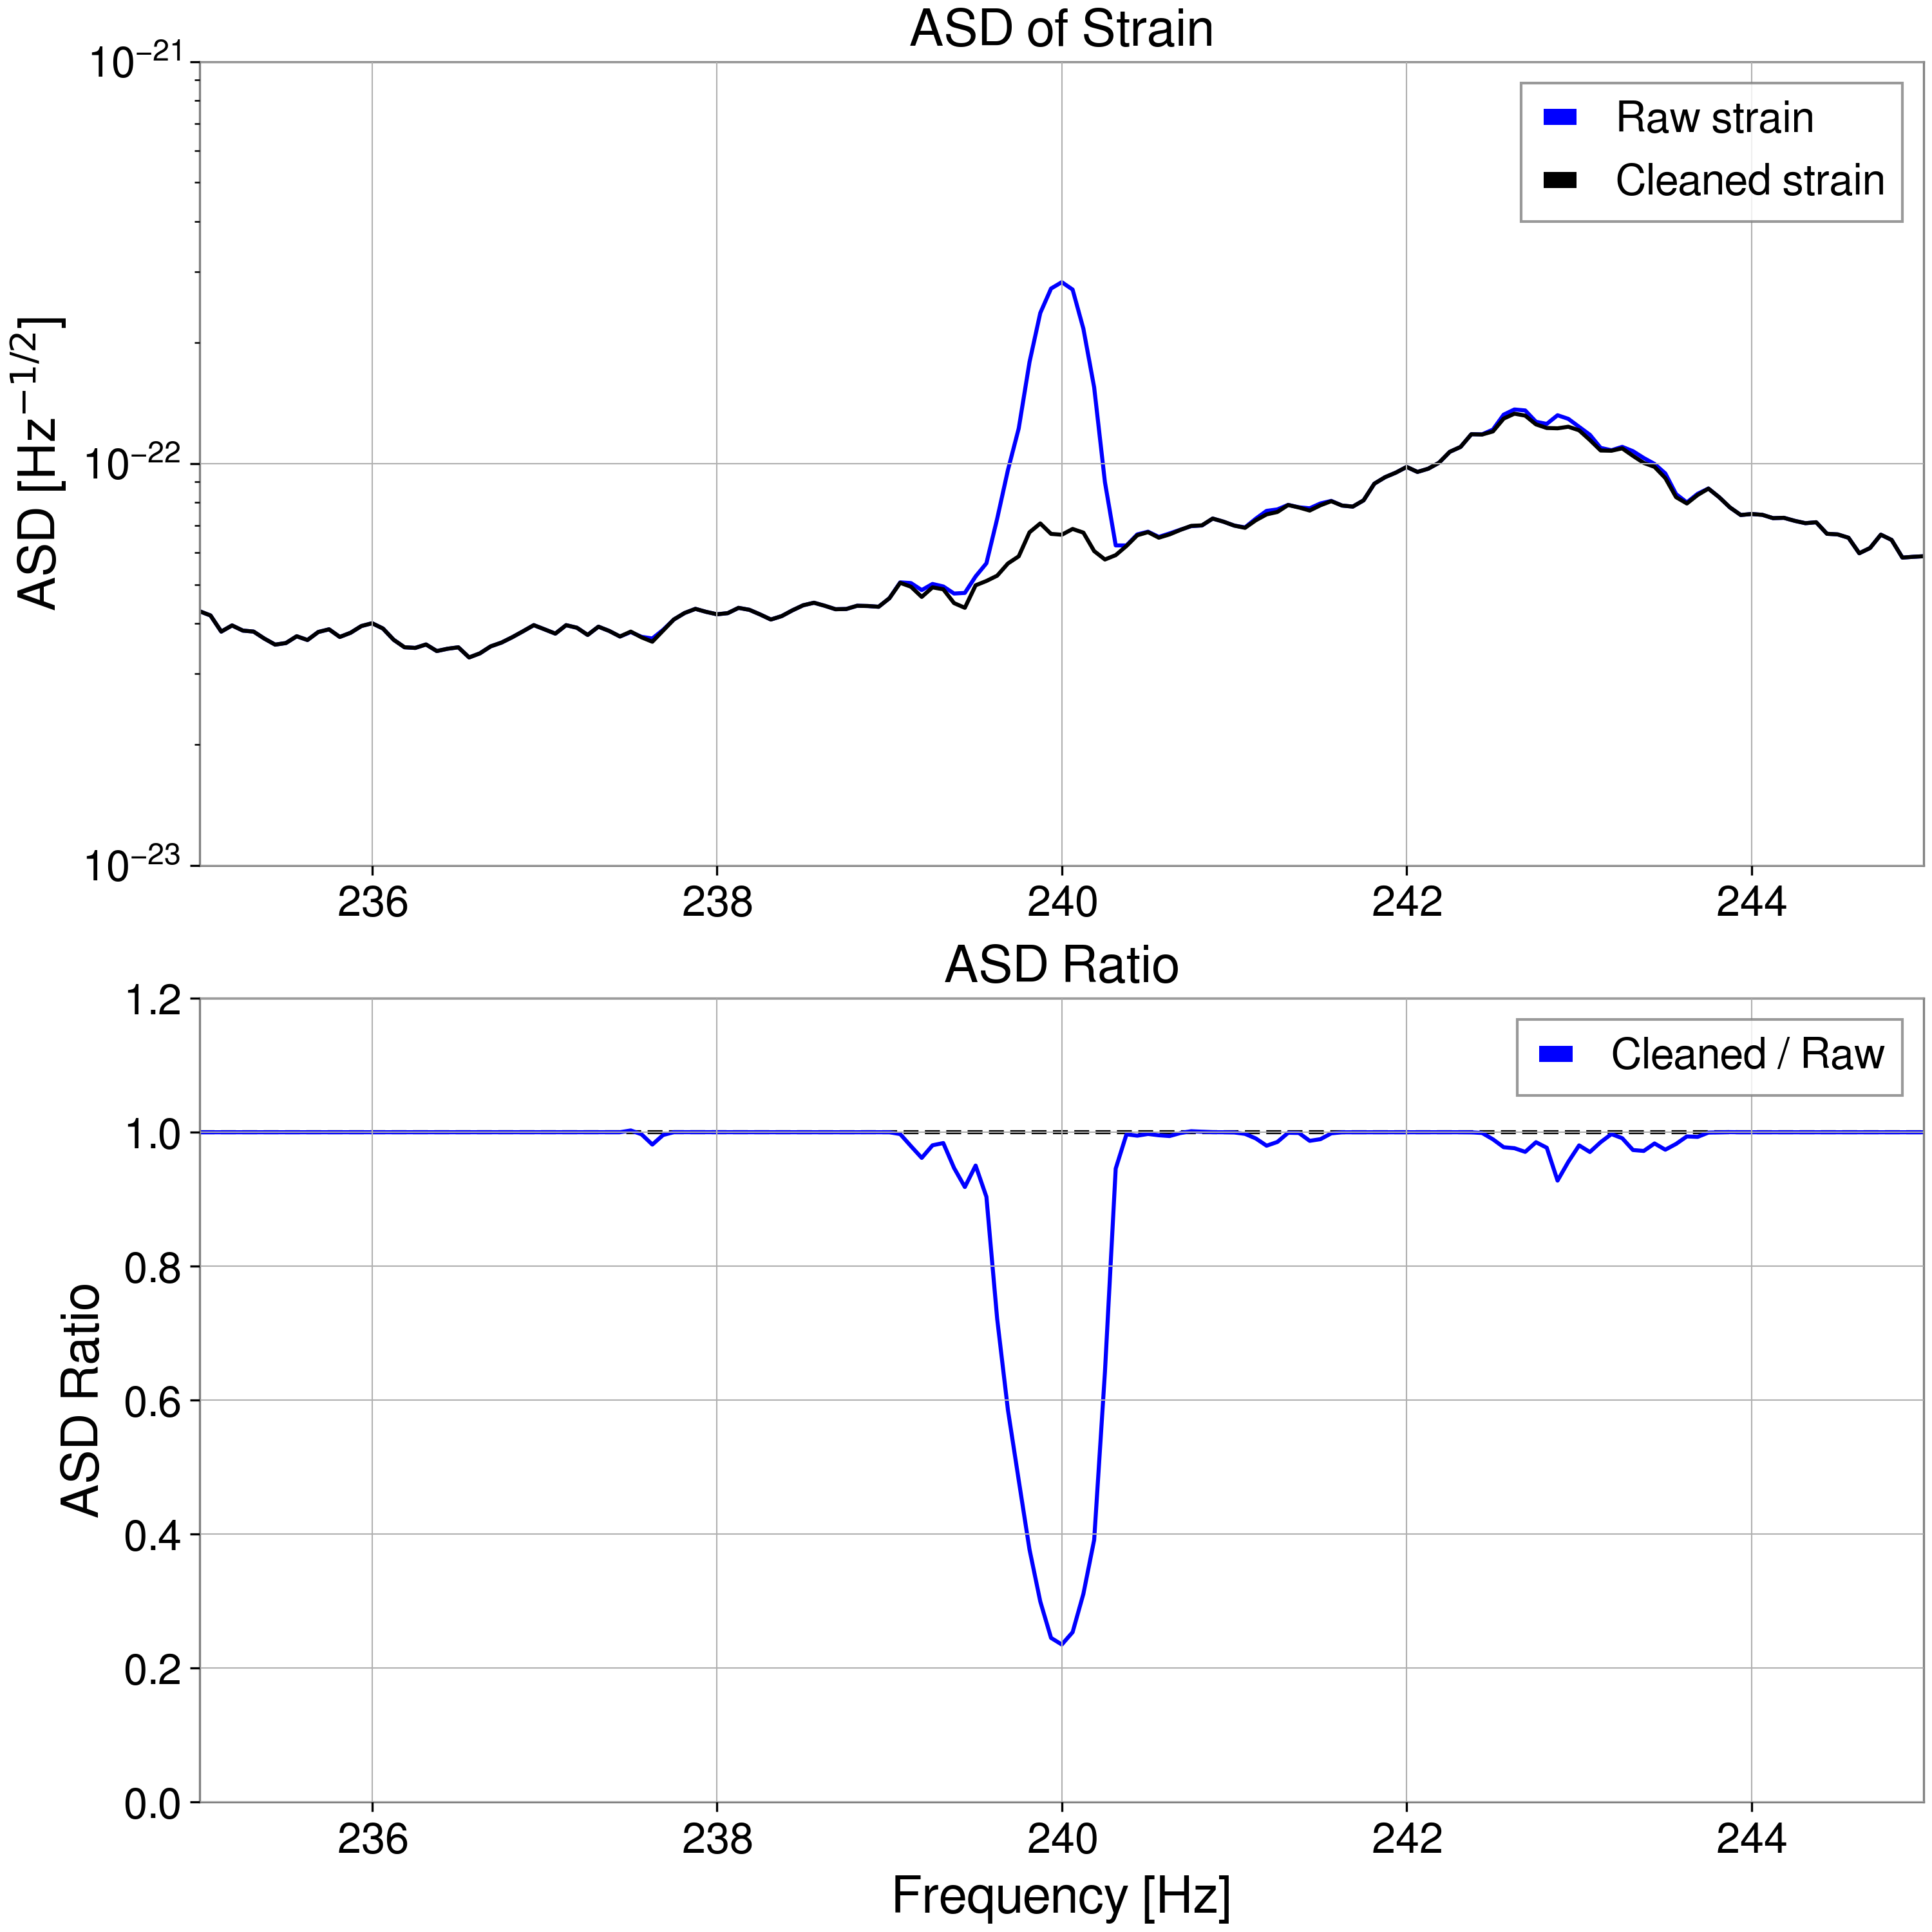
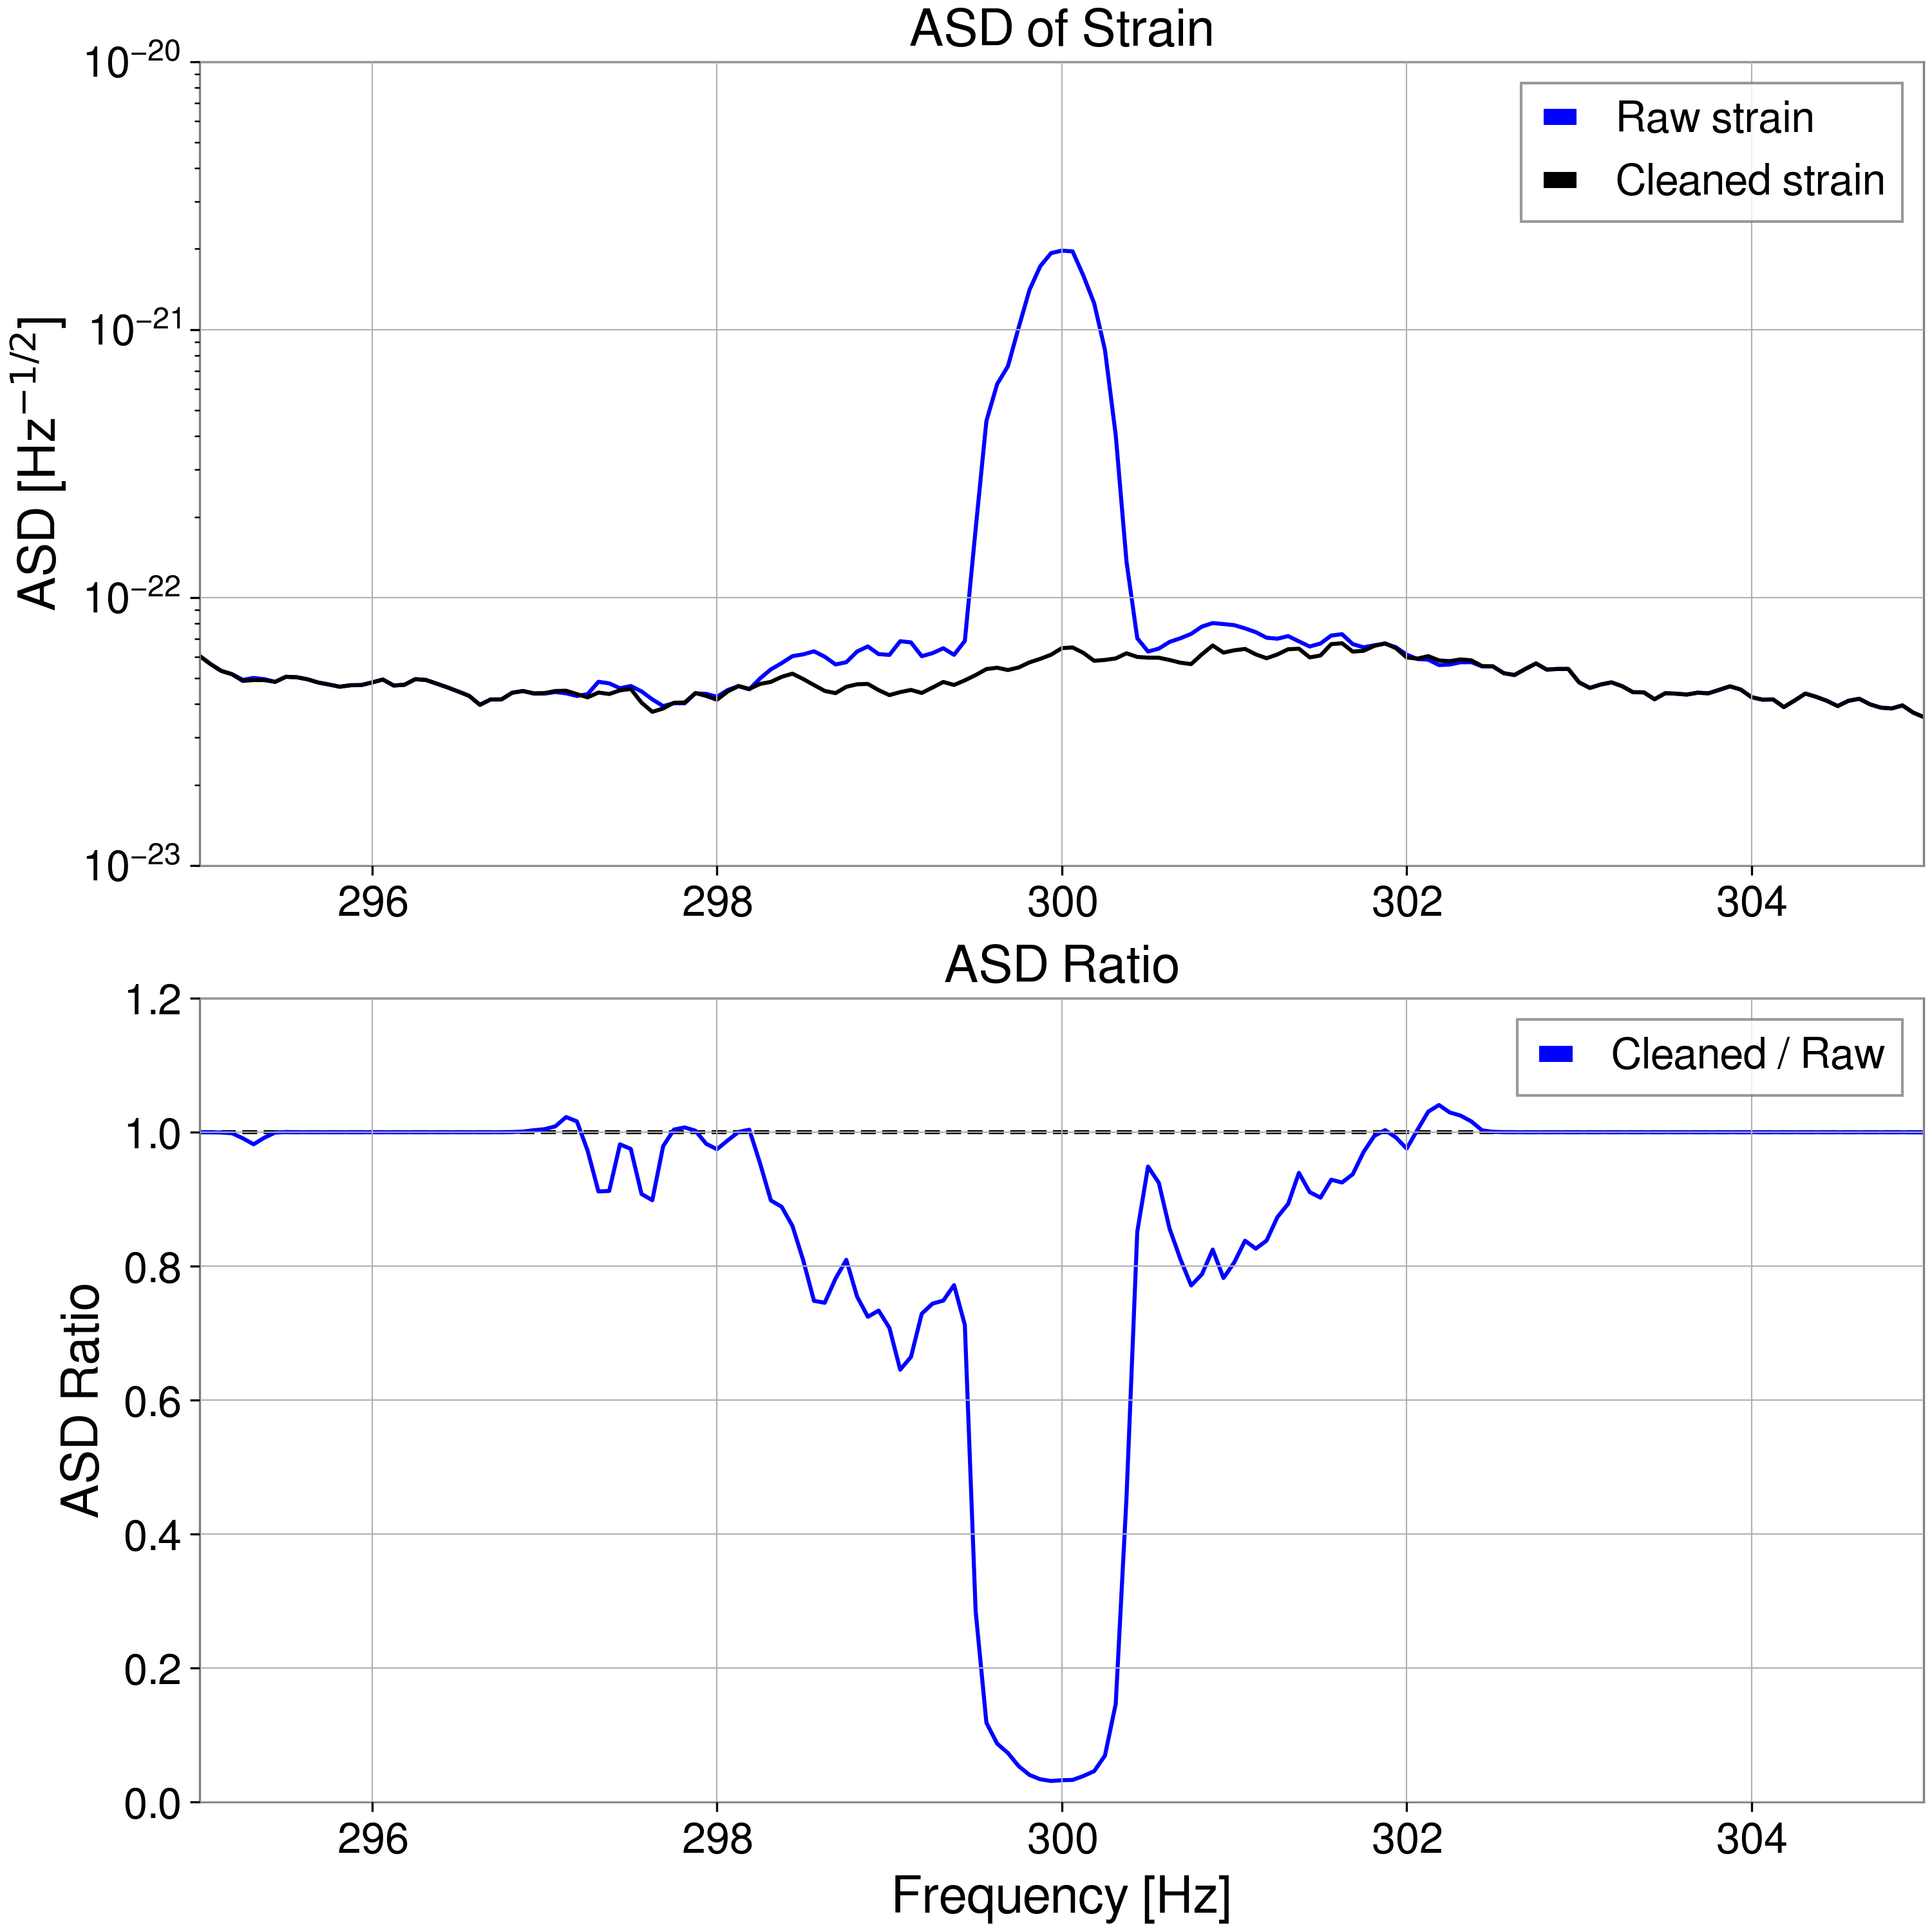
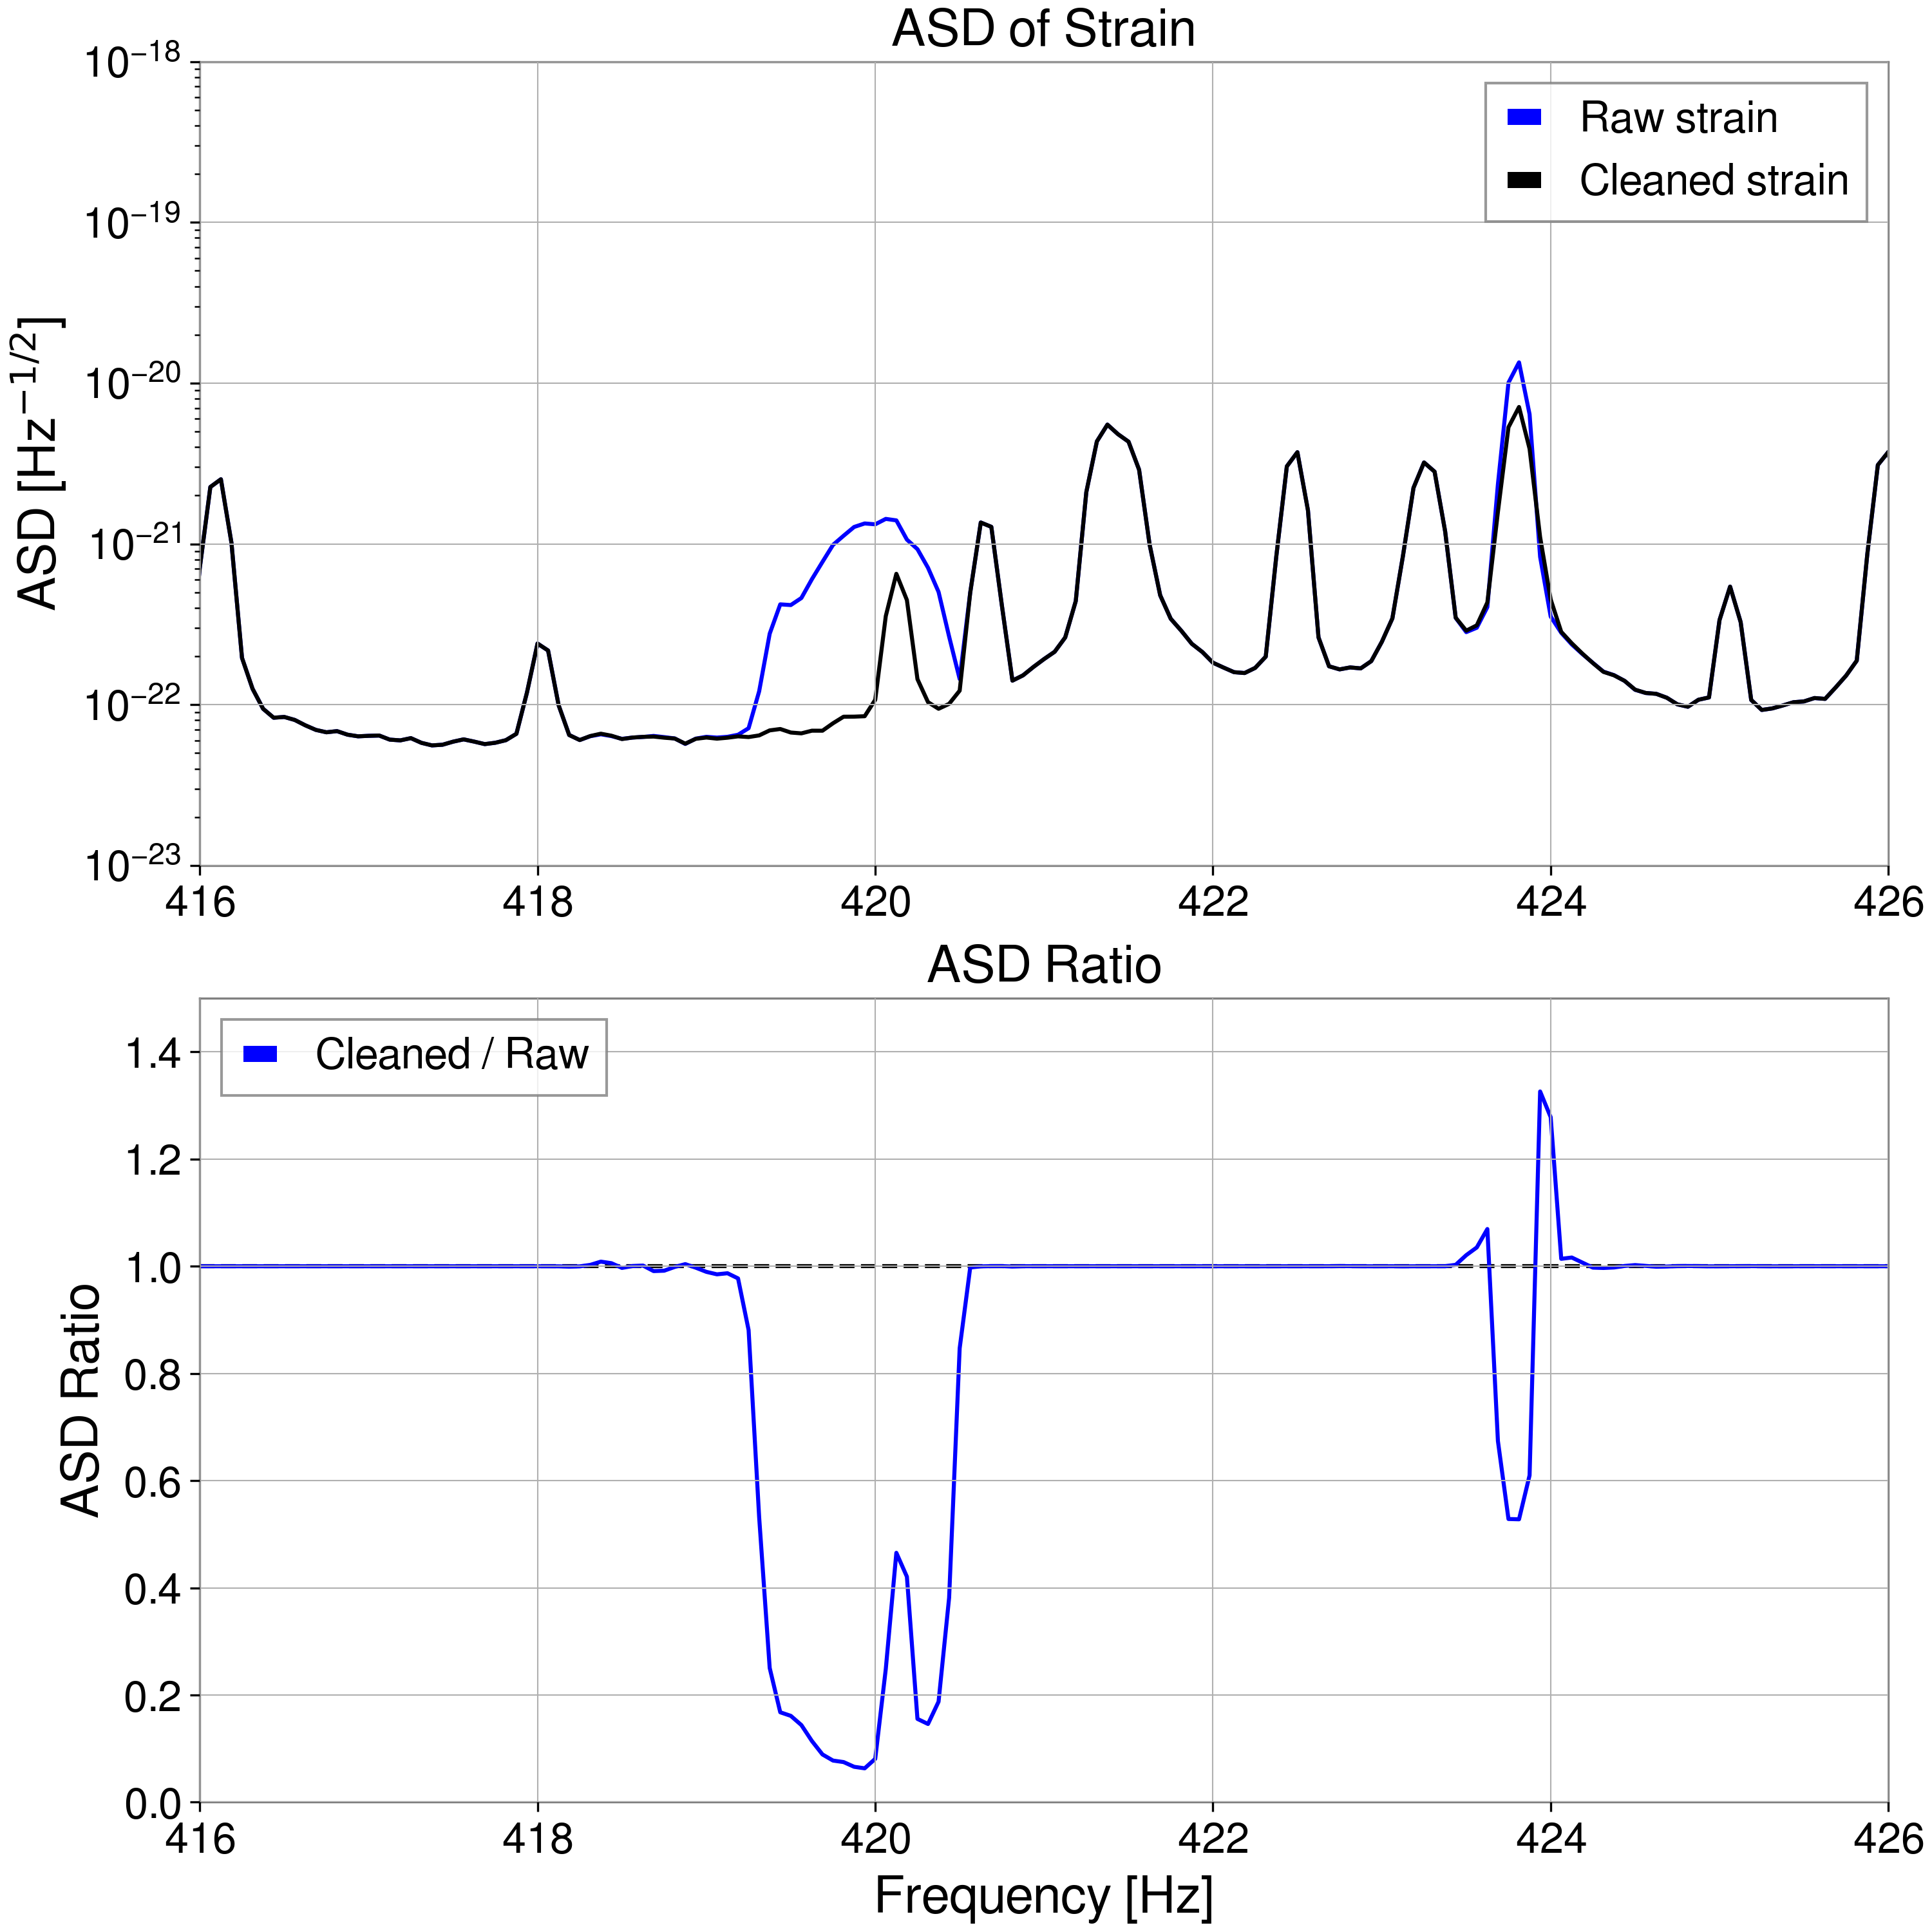
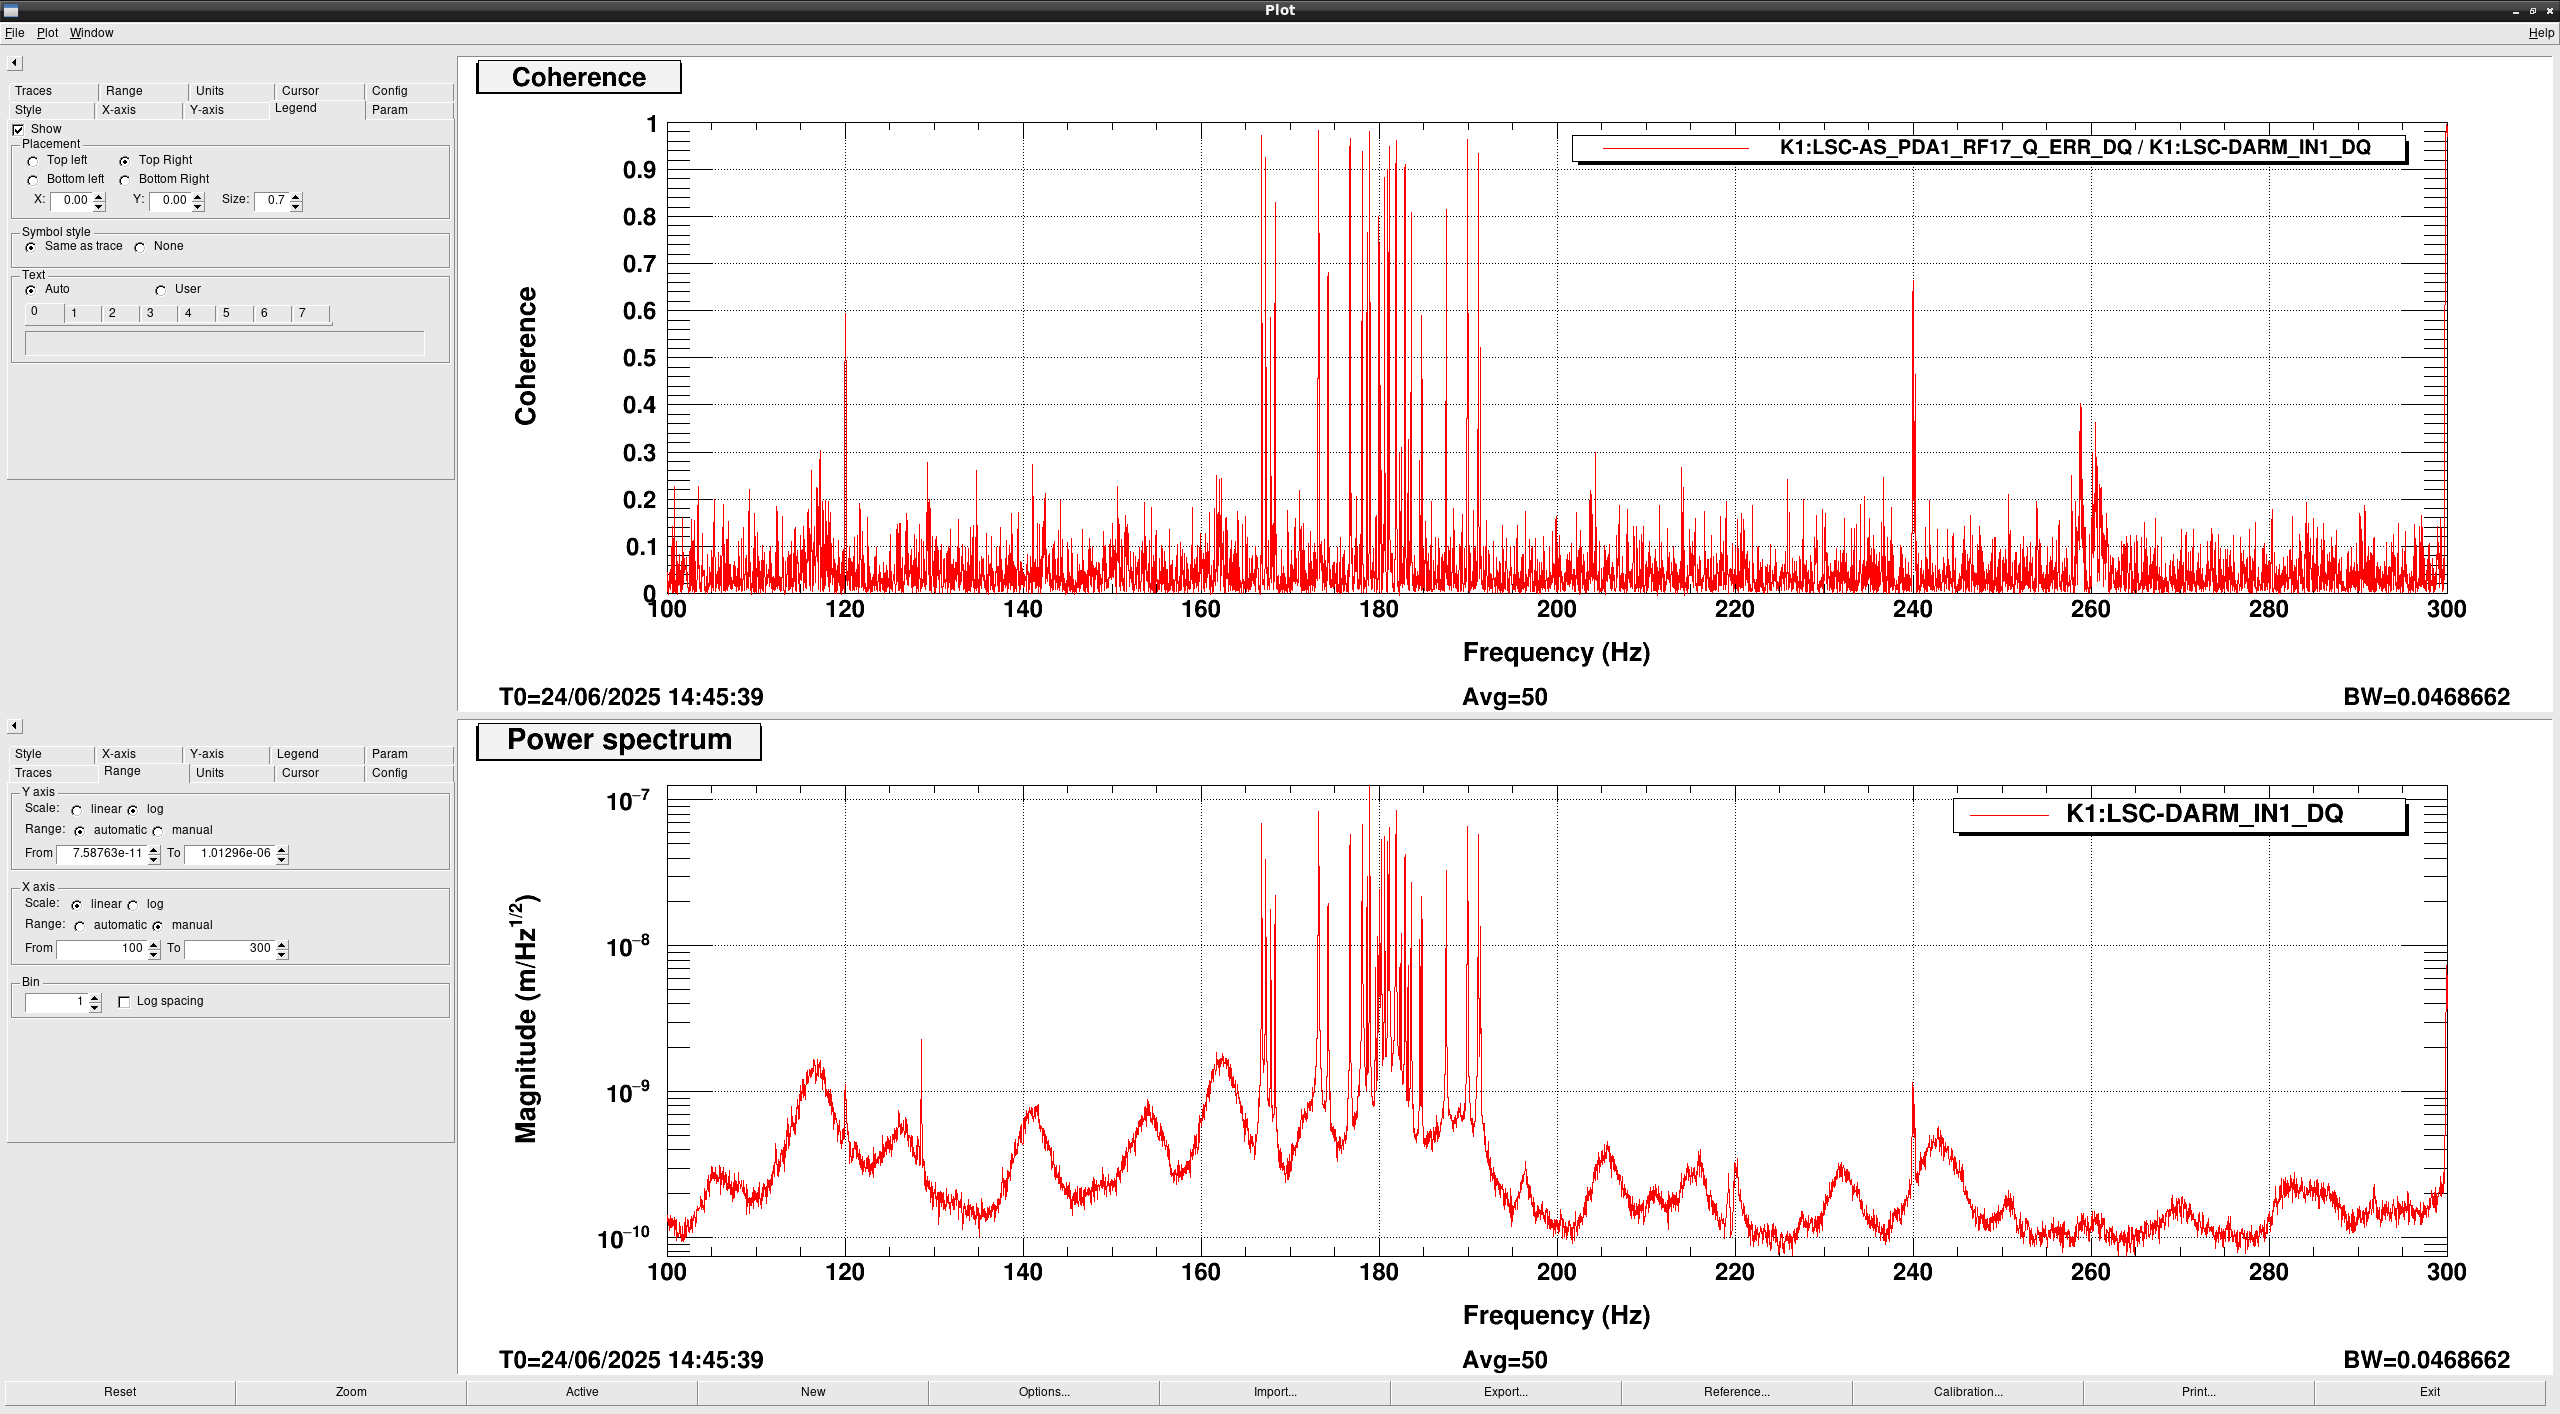
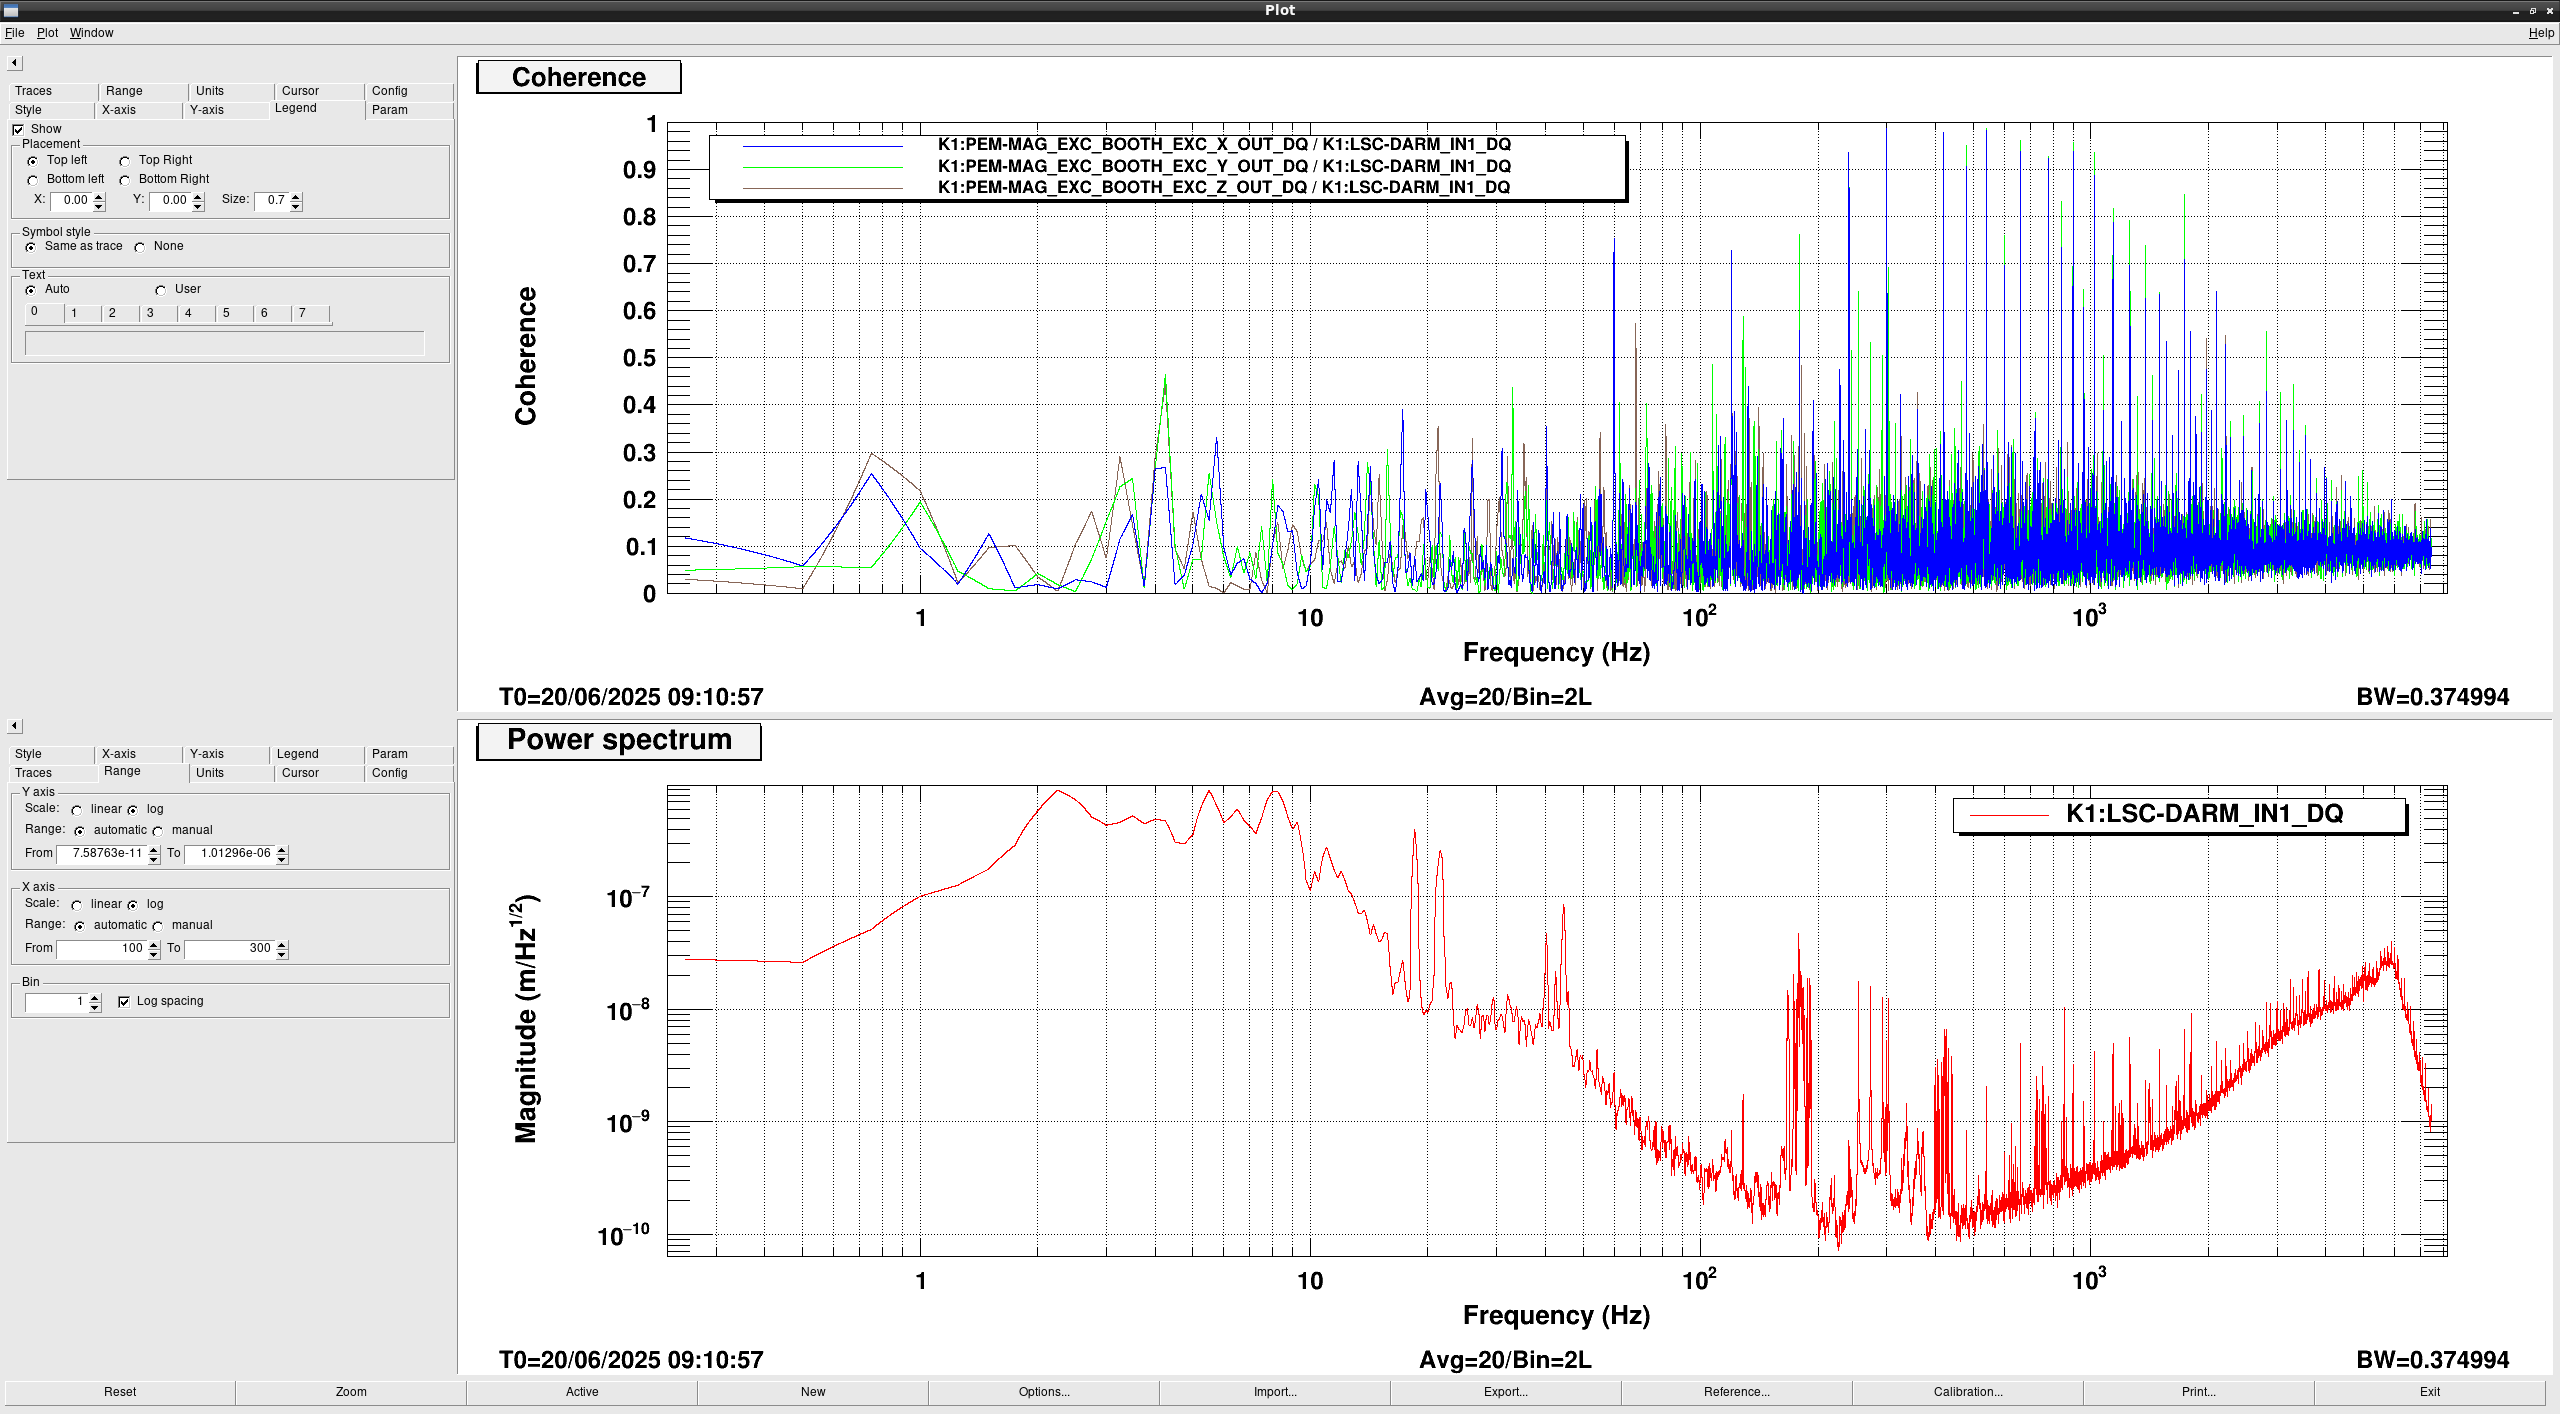
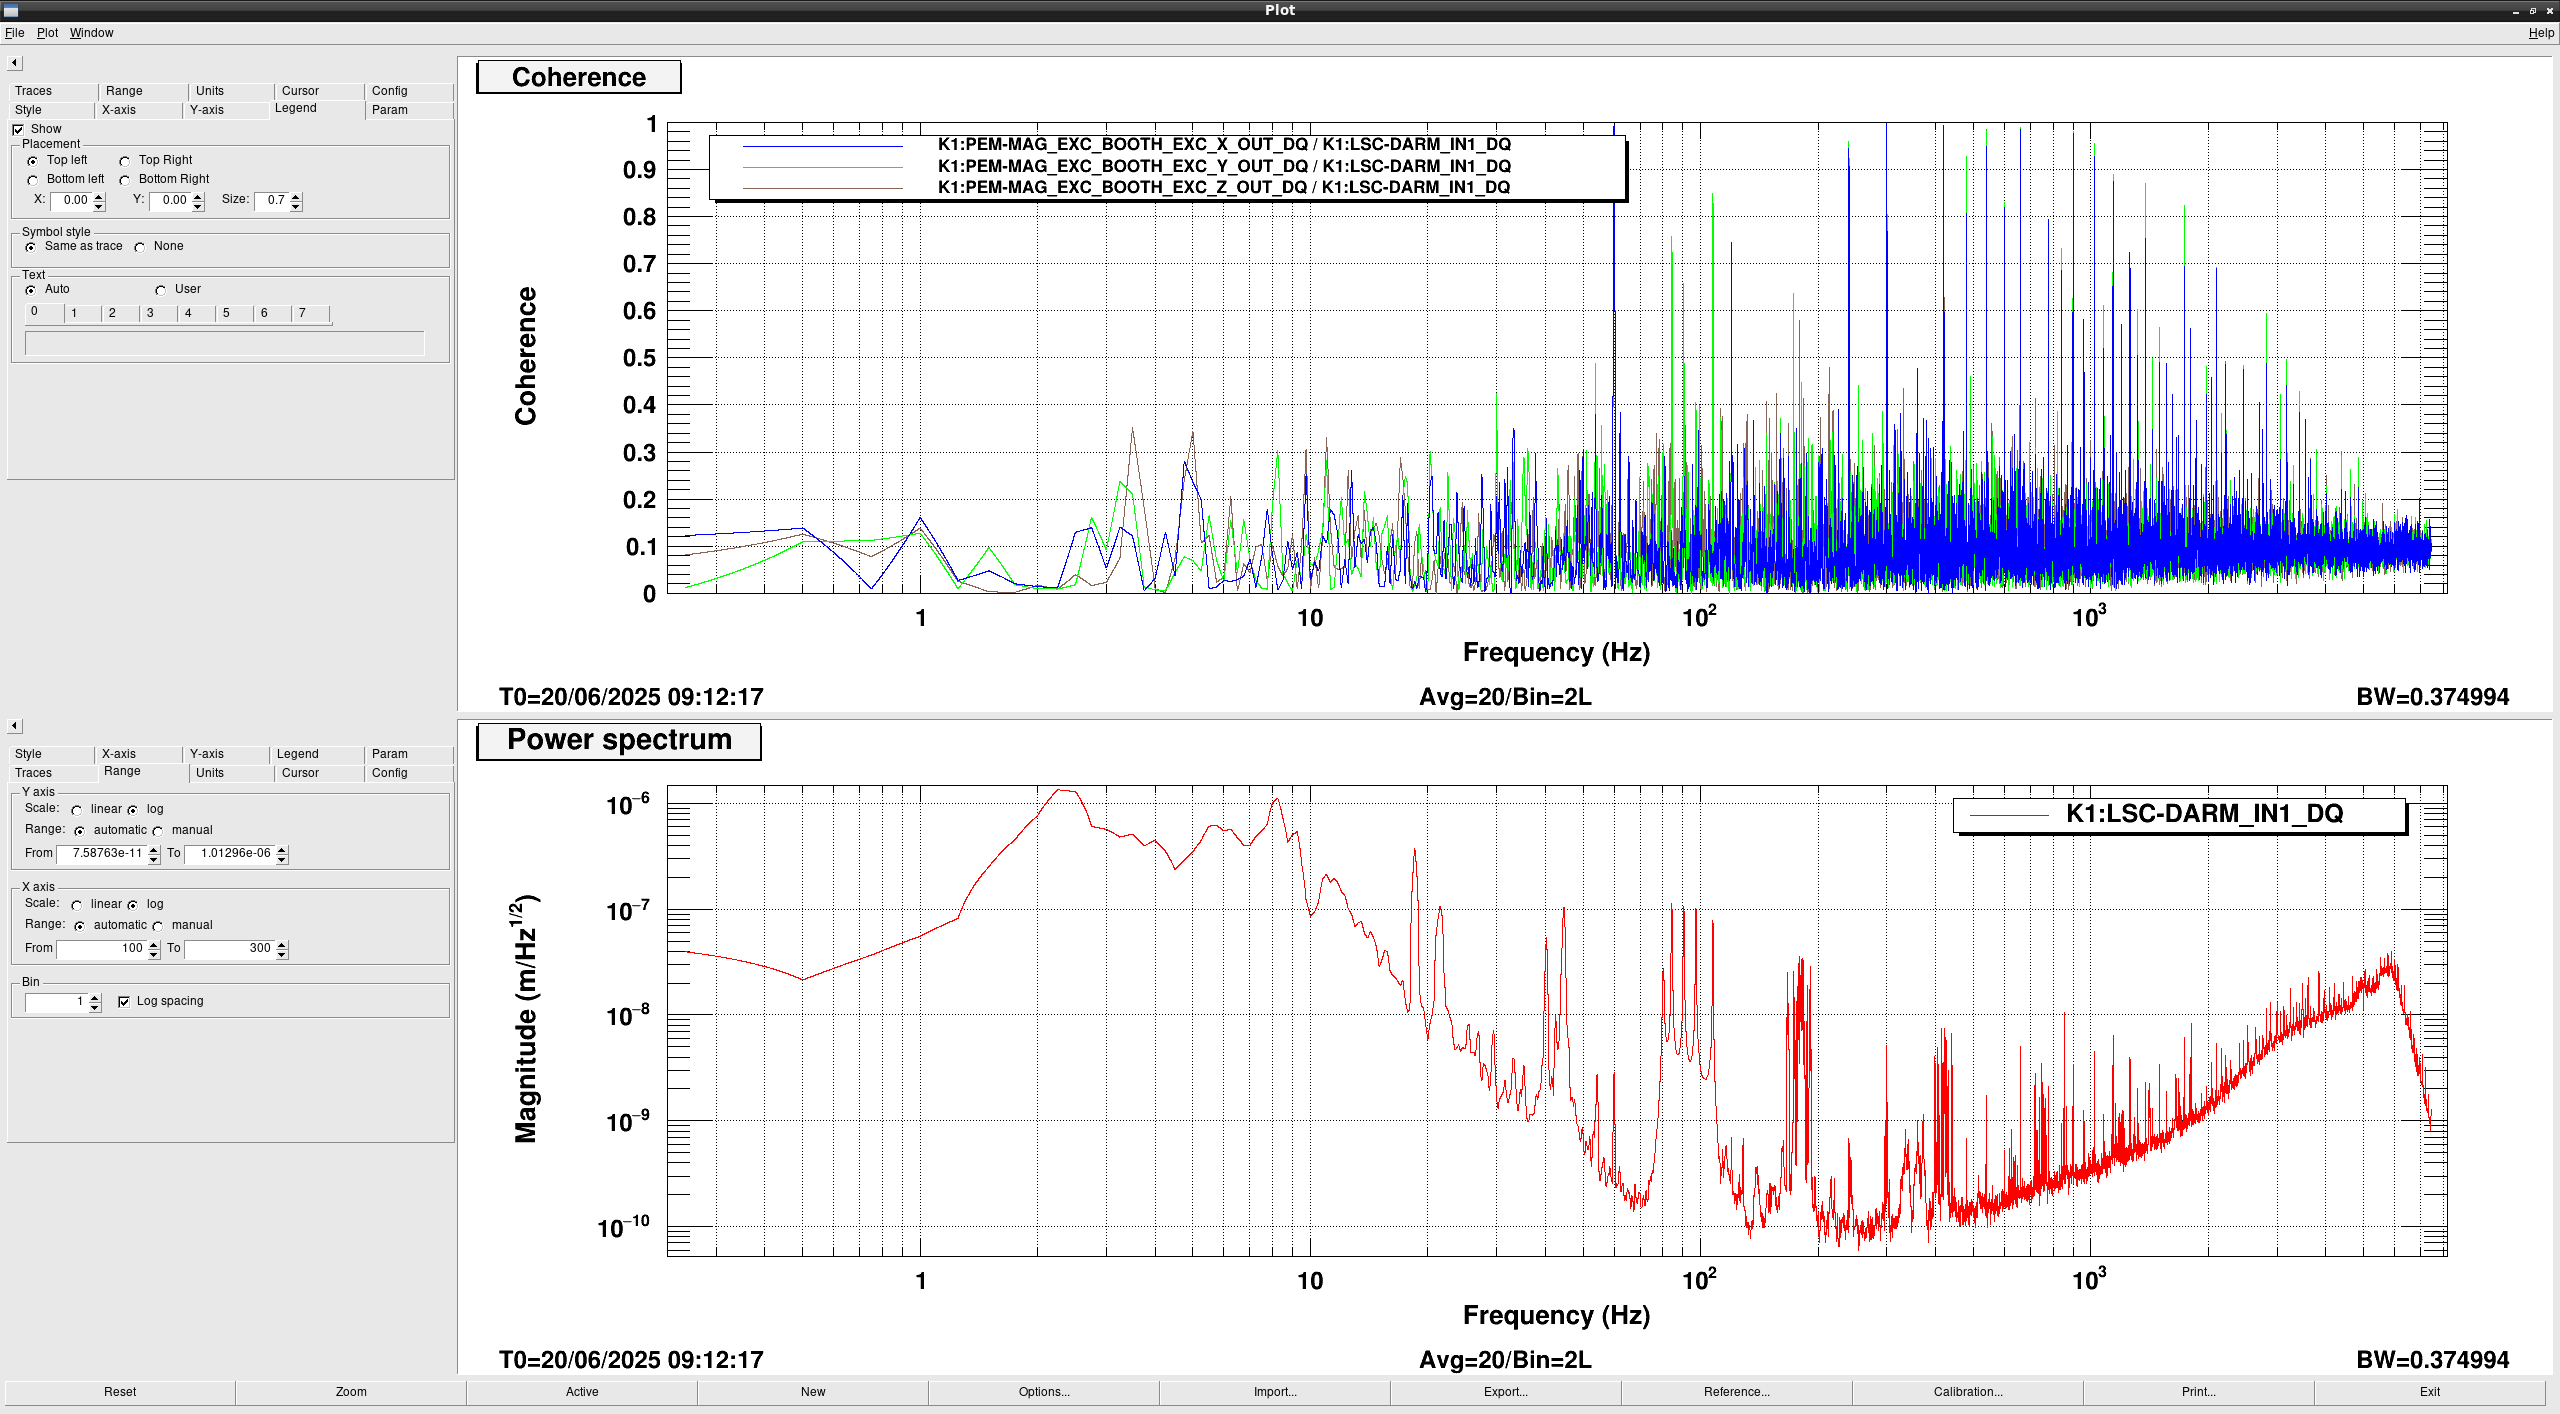
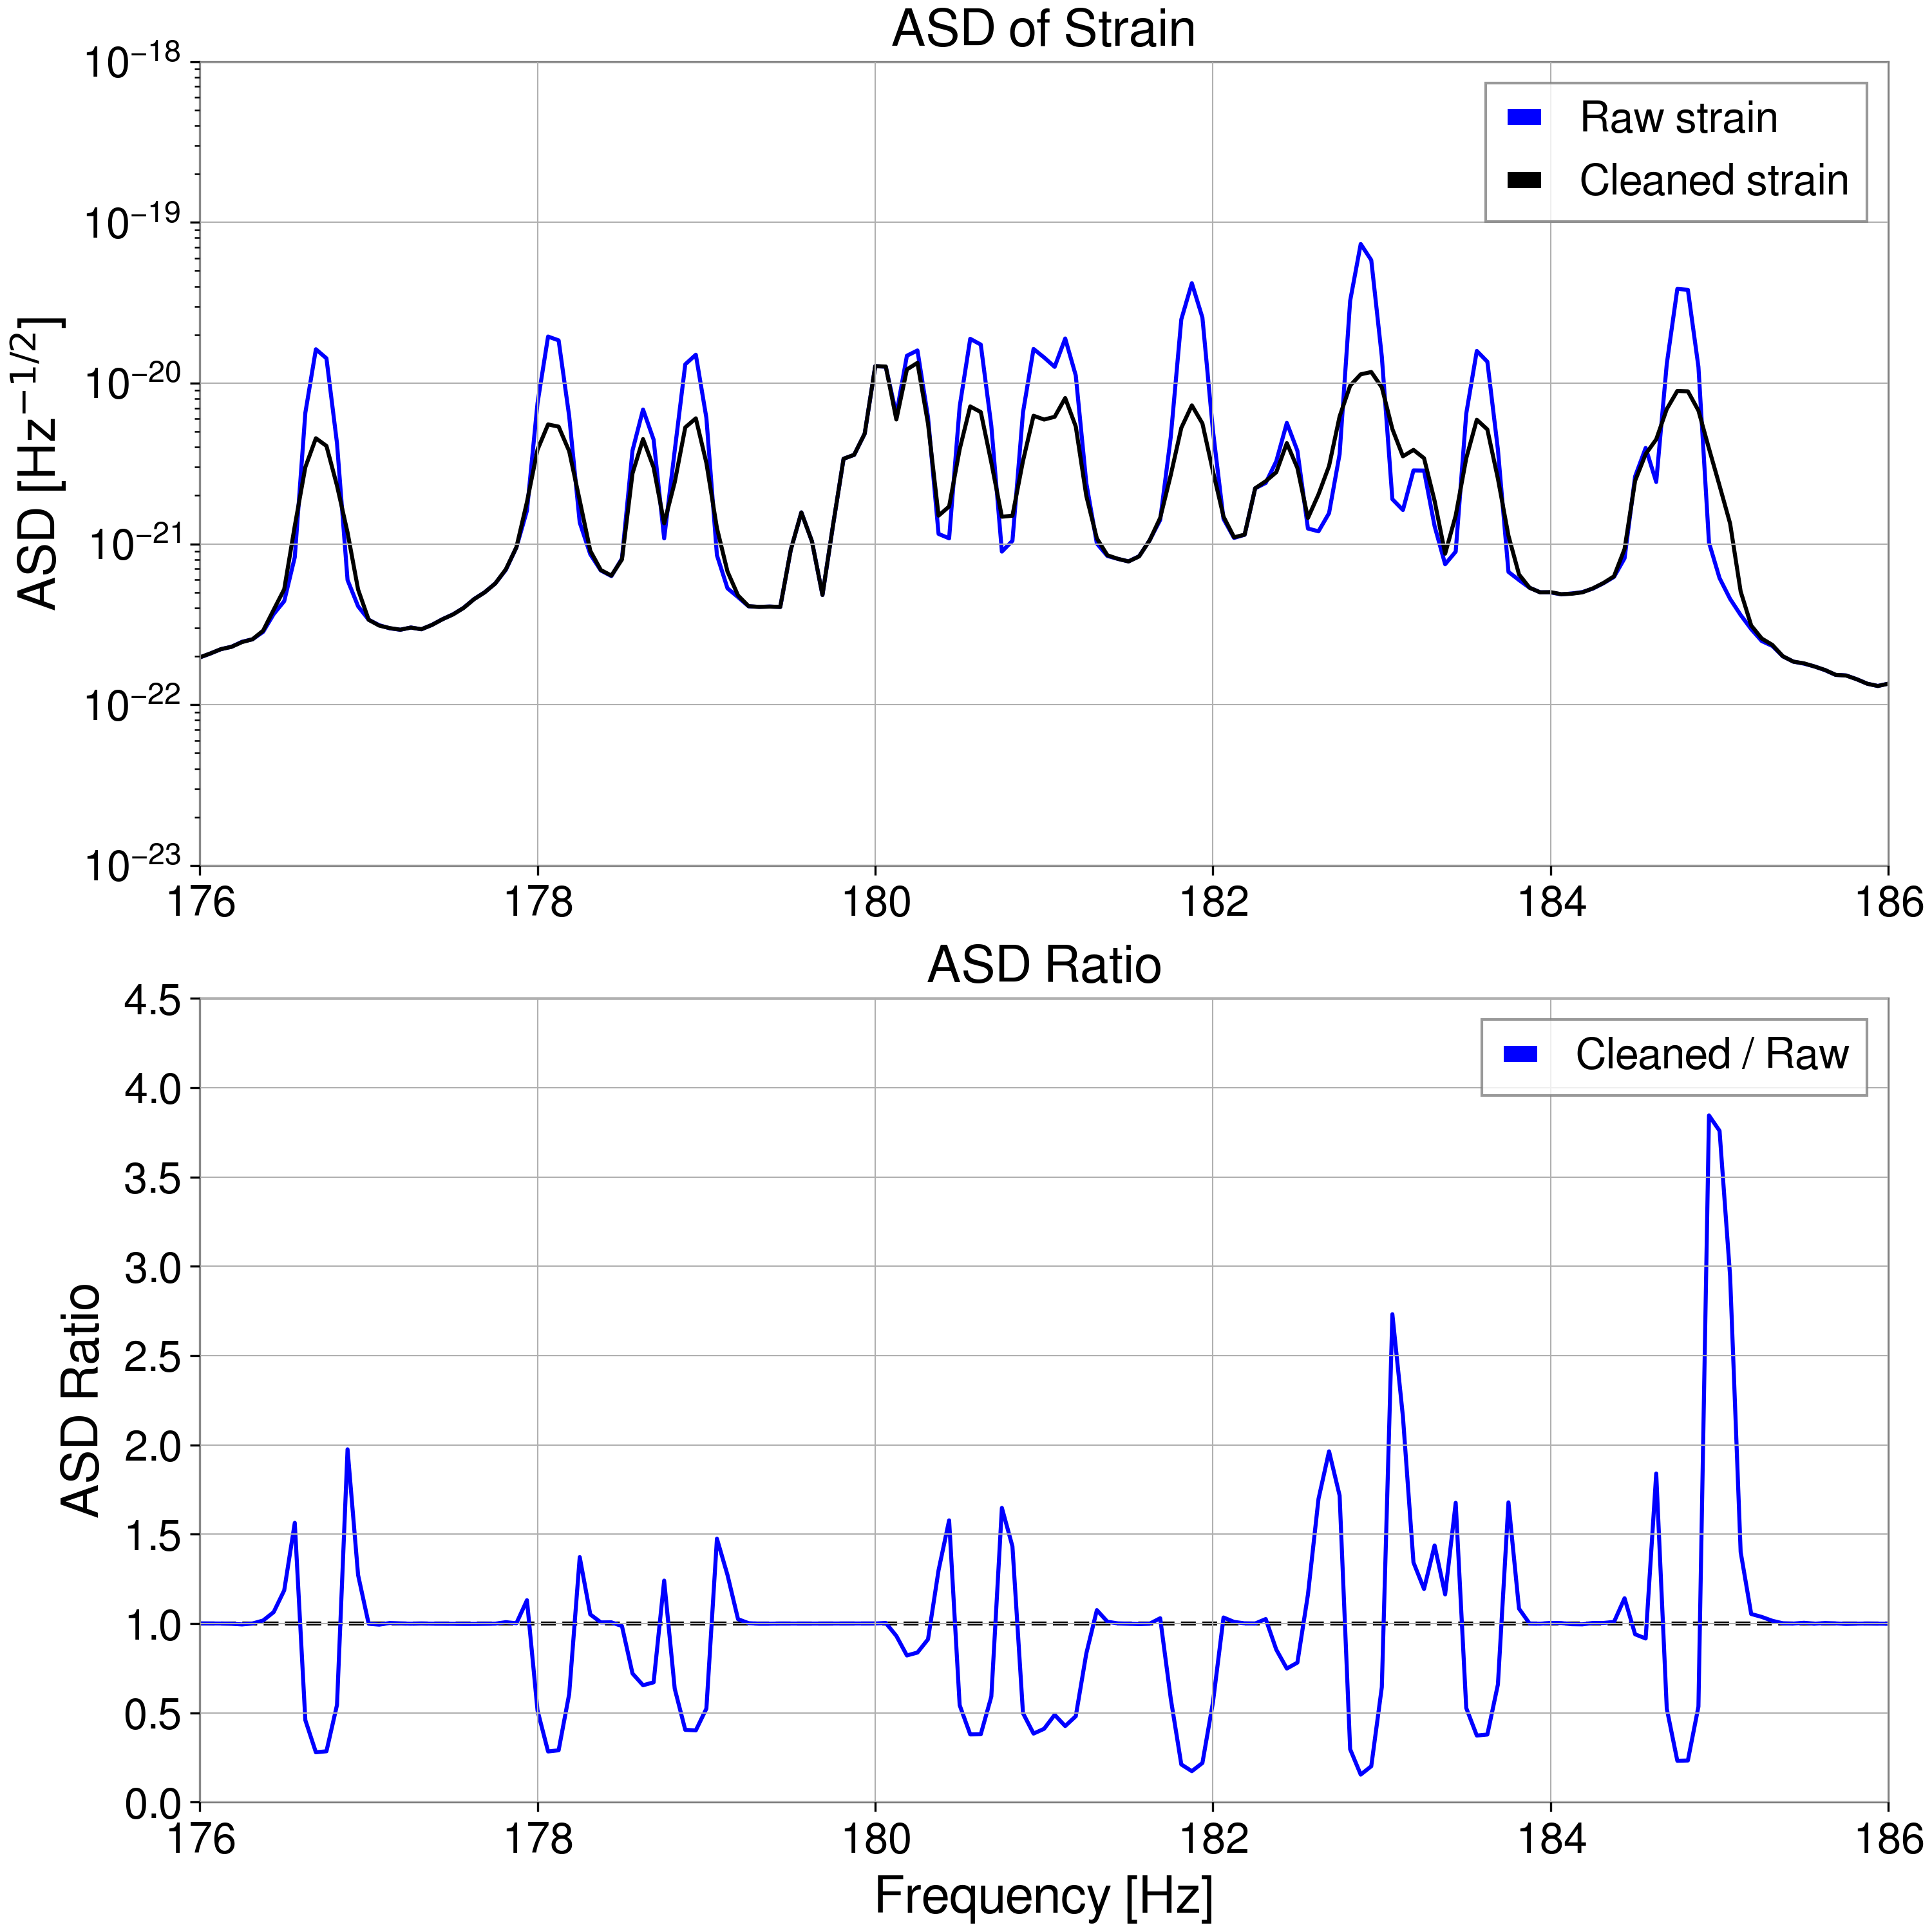
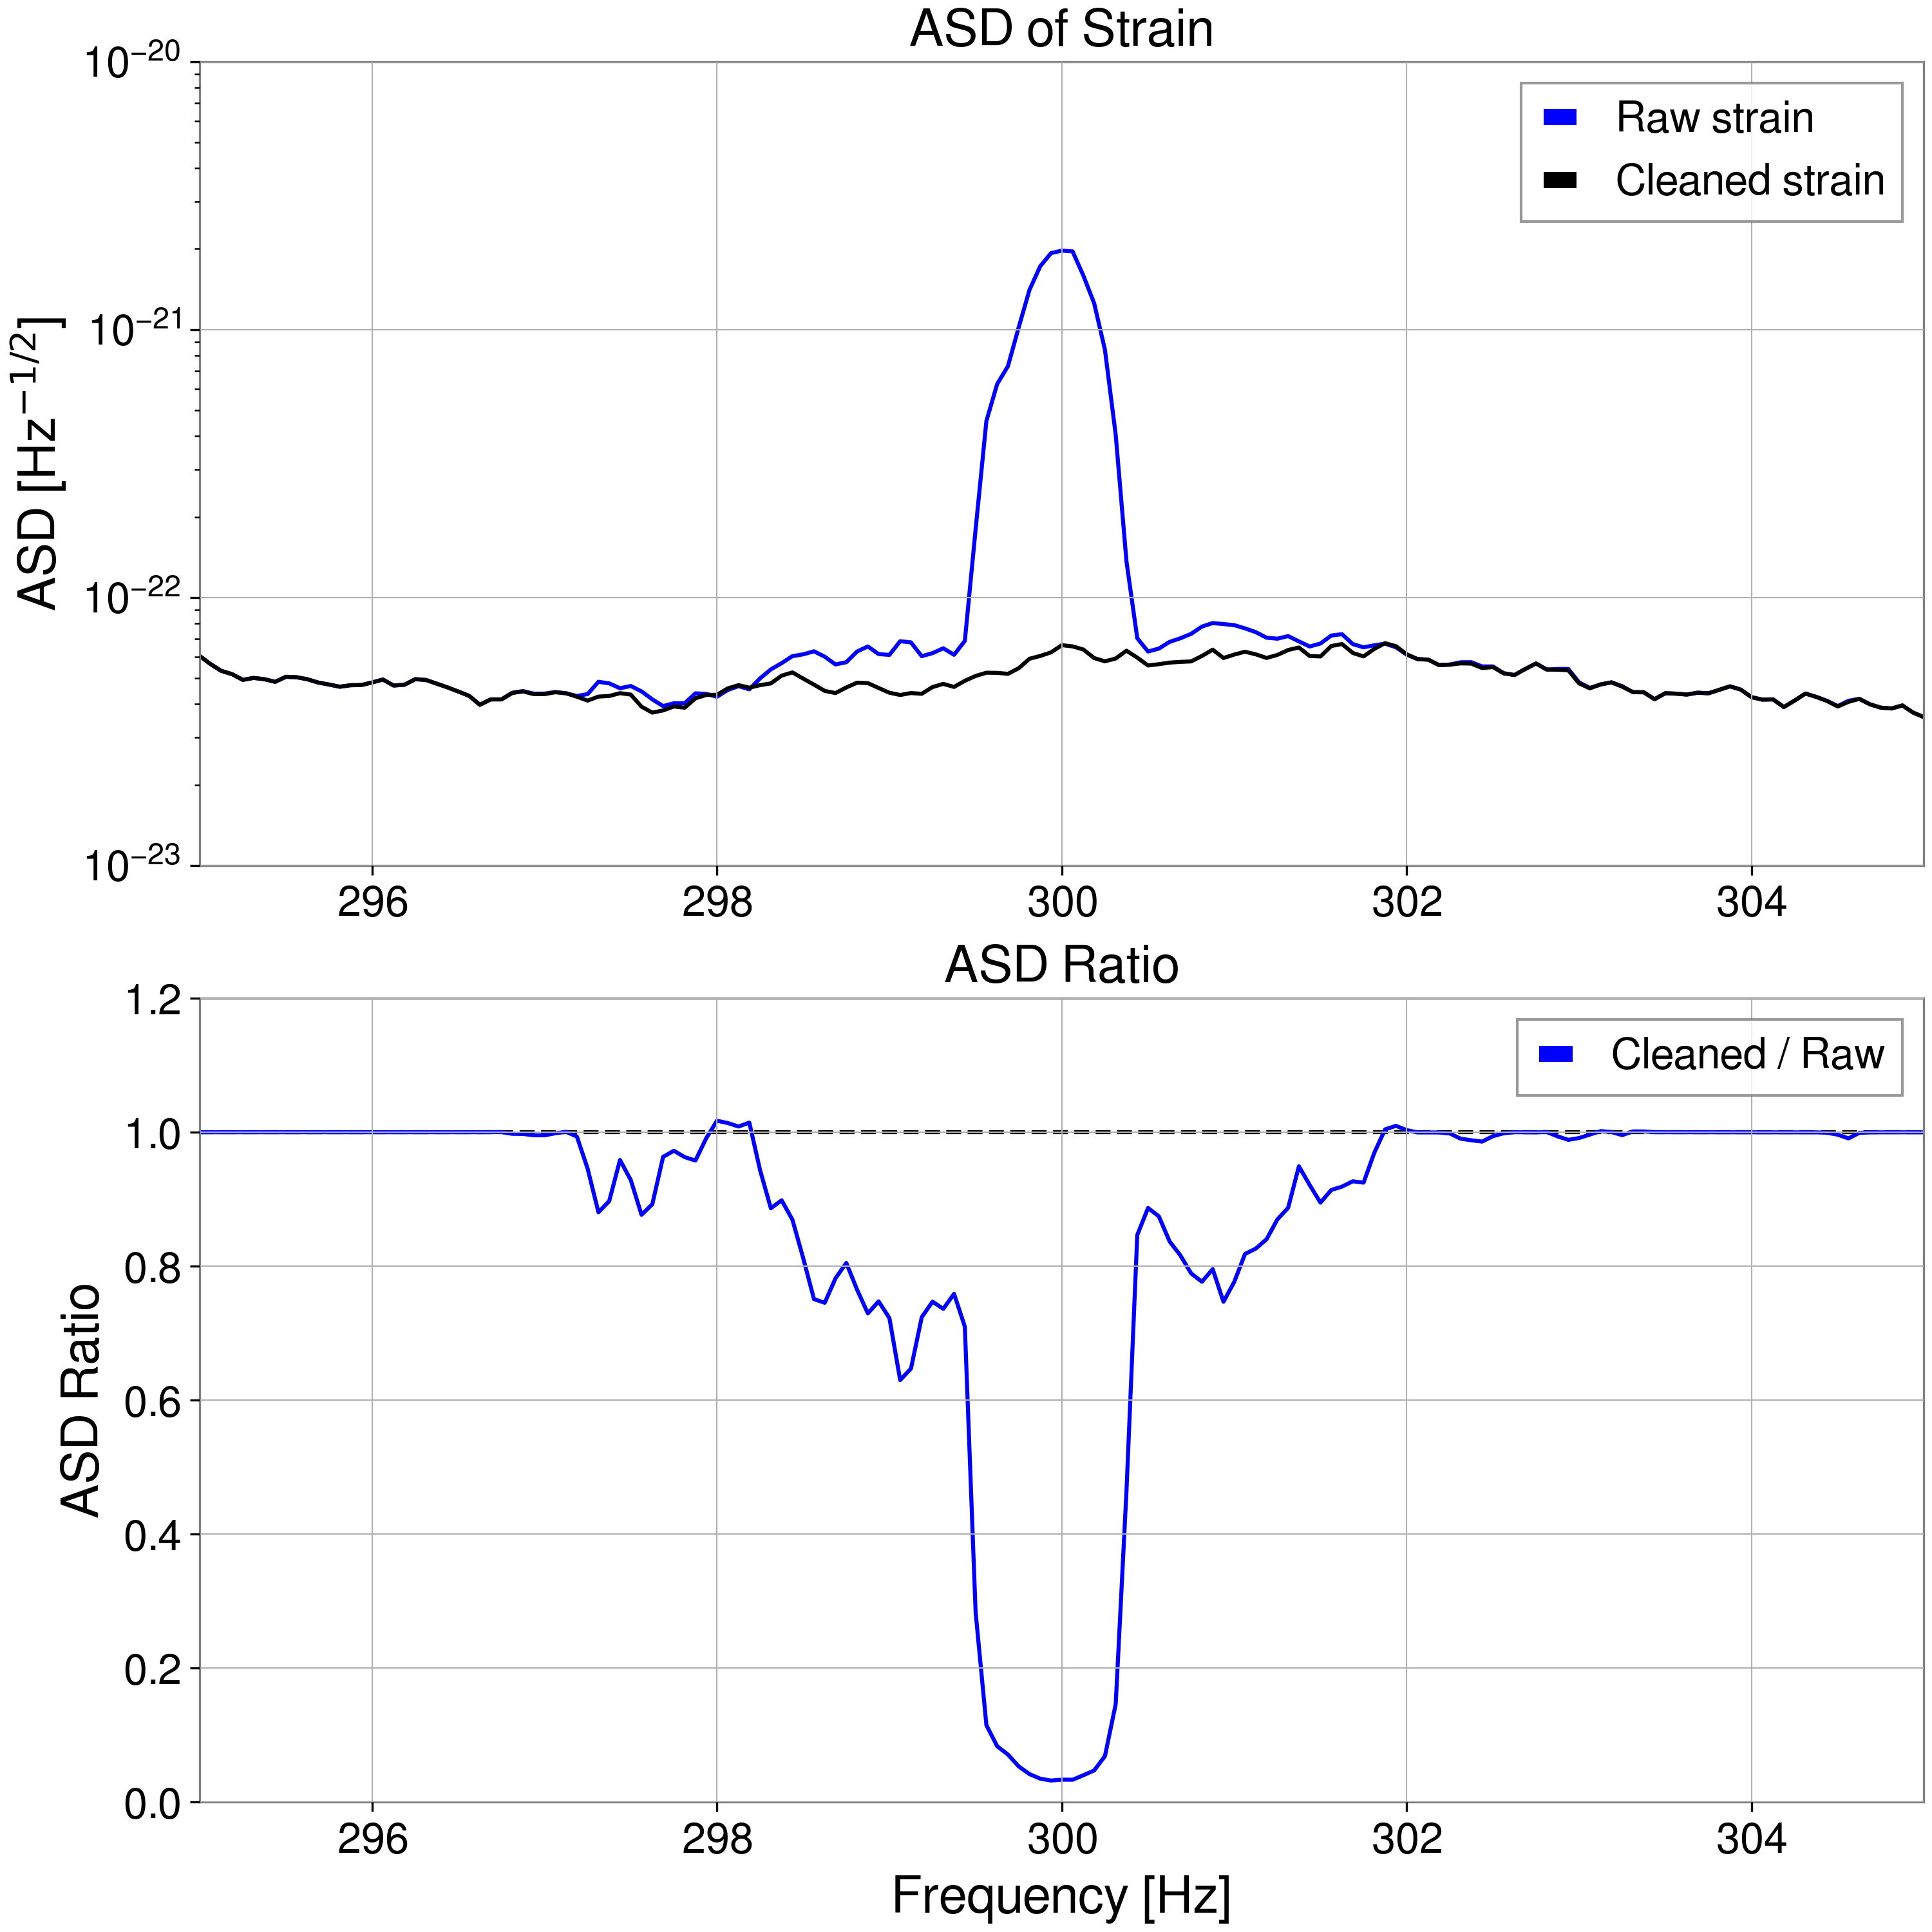
The frequency bands cleaned are: [115Hz,125Hz], [176Hz,186Hz], [211Hz,221Hz], [235Hz,245Hz], [295Hz,305Hz], [329Hz,339Hz], [366Hz,376Hz], [416Hz,426Hz], [475Hz,485Hz], [534Hz,544Hz], [655Hz,665Hz], [772Hz,782Hz], [834Hz,844Hz]. The witness channels can be found here: JGW-T251617-v1 .

The inspiral range of the strain data improved by 1.747% after cleaning.

Images attached to this report
Comments to this report:
tomotada.akutsu - 7:18 Tuesday 24 June 2025 (34353) Print this report

Thank you for the great results. Could you also show an order ranking which frequency band contributes to improve the sensitivity significantly?

Chia-Jui Chou - 14:45 Tuesday 24 June 2025 (34355) Print this report

Here is the response to the post: https://klog.icrr.u-tokyo.ac.jp/osl/?r=34353.

We did the cleaning in the ascending order of frequency bands. Starting from the frequency band of the smallest frequencies and go up sequentially. The cumulative improvement of inspiral range is listed below:

f_c [Hz], improvement [%]

120 Hz, 0.659%
181 Hz, 0.661%
216 Hz, 1.179%
240 Hz, 1.221%
300 Hz, 1.306%
334 Hz, 1.533%
371 Hz, 1.694%
421 Hz, 1.698%
480 Hz, 1.709%
539 Hz, 1.741%
660 Hz, 1.744%
777 Hz, 1.746%
839 Hz, 1.747%

The most significant improvement comes from the [115Hz, 125Hz] band and the second one is [211Hz, 221Hz] band.

takahiro.yamamoto - 13:57 Wednesday 25 June 2025 (34361) Print this report

This is just comments for used channels about safe/unsafe issue. 

[K1:LSC-AS_PDA1_RF17_Q_ERR_DQ]
The reason why violin mode peaks are also mitigated seems to be to use AS17Q. AS17Q is DARM signal with poorer senstivitity than DCPD. So high-SNR DARM motion such as violin mode peaks can be seen also on AS17Q. So AS17Q and calibrated DARM should have large coherence in the frequency band in that AS17Q is not limited by the sensor noise as shown in Fig.1. Even if poor SNR, coherent signal can be seen on AS17Q with long enough integration time. For this reason, AS17Q might have to be regarded as unsafe channel.

[K1:PEM-MAG_BOOTH_EXC_{X,Y,Z}_OUT_DQ]
I recall that around the time of O3GK, Washimi-kun or Yokozawa-san pointed out the possibility of seeing the DARM signal on the magnet meter via change in the magnet field by the coil magnet actuator. So I checked magnet meter signal during the Pcal injection for the calibration measurements. Then we can see the moving coherence following pcal swept sine Fig.2-4. My check is just a very short integration time but it suggests possibility a coupling from DARM to Magnet meters (Note that for the fair evaluation, same check had better to be done when DARM is controlled by ETMY). So we should check magnet meter signals are really safe or unsafe to use removal works.

Images attached to this comment
Shu-Wei Yeh - 14:41 Wednesday 25 June 2025 (34365) Print this report

Thank you for sharing this important information.
We will exclude those channels from the witness list in our denoising tests to avoid accidental signal loss.
Thanks again for the heads-up.

Shu-Wei Yeh - 20:54 Wednesday 25 June 2025 (34369) Print this report

Based on Yamamoto-san’s comments about safe and unsafe channels, We've temporarily removed [K1:LSC-AS_PDA1_RF17_Q_ERR_DQ] and [K1:PEM-MAG_BOOTH_EXC_{X,Y,Z}_OUT_DQ] from the channel list.
We ran ICA using the same configuration as in klog 34352, and the results look similar to what was shown there. Please take a look at the results below.

f_c [Hz] improvement [%]
120 0.659
181 0.661
216 1.179
240 1.221
300 1.315
334 1.542
371 1.703
421 1.705
480 1.716
539 1.742
660 1.742
777 1.744
839 1.745


Images attached to this comment
tomotada.akutsu - 7:02 Thursday 26 June 2025 (34371) Print this report

Thank you for the efforts. Let me confirm the following: are the numbers in the 2nd column of your table cummlative percentages? If so, from the viewpoint of onsite noise hunting, it might be helpful to translate these numbers into individual contributions for each frequency range. Thanks.

Shu-Wei Yeh - 13:45 Thursday 26 June 2025 (34373) Print this report

[Shu-Wei Yeh, Chia-Jui Chou]
 
We applied ICA to clean KAGRA strain data from 1433707218 to 1433708418 (20:00:00–20:20:00 UTC, June 11, 2025), using a cleaning duration of 1200 seconds.
The central frequencies (f_c) and corresponding cleaned frequency bands are listed below. The updated witness channels can be found in JGW-T251617-v2.
Step-by-step improvements and the total improvement are summarized in the table.
    

f_c [Hz] frequency band [Hz] Incremental (per-band) improvement [%] Cumulative improvement [%]
120 115 ~ 125 Hz 0.659 0.659
181 176 ~ 186 Hz 0.002 0.662
216 211 ~ 221 Hz 0.488 1.153
240 235 ~ 245 Hz 0.041 1.194
300 295 ~ 305 Hz 0.094 1.289
334 329 ~ 339 Hz 0.224 1.516
371 366 ~ 376 Hz 0.159 1.677
421 416 ~ 426 Hz 0.003 1.680
480 475 ~ 485 Hz 0.011 1.691
539 534 ~ 544 Hz 0.026 1.717
660 655 ~ 665 Hz 0.000 1.717
777 772 ~ 782 Hz 0.001 1.719
839 834 ~ 844 Hz 0.001 1.720
Images attached to this comment
Search Help
×

Warning

×