Abstract:
The nonlinearity of the DC readout generating the DARM error signal probably starts to limit sensitivity in the 60–90 Hz region.
Additionally, force noise applied to the type-A intermediate masses (IMs) may contribute to the sensitivity.
I propose unplugging the cables or inserting a resistor immediately after the coil driver for the IMs to reduce actuator efficiency, and we can quickly assess whether this improves sensitivity.
Details:
During recent observations, I noticed that when a resonant peak at 40 Hz or 50 Hz was excited, additional peaks at higher frequencies also appeared.
This behavior suggests the presence of nonlinear effects in the DC readout.
To investigate further, I analyzed the DARM spectrum in a quiet observation state.
The DC readout is fundamentally quadratic, or more precisely speaking, follows a 1 - cos(x) function.
The relationship between DARM power P and displacement x is given by
P/P_0 = 1 + 2 x/x_0 + (x/x_0)^2,
where P_0 is the offset power of 15 mW, and x_0 is the offset displacement, approximately 2 pm (dividing 7 pm, estimated from klog:31350, by the square root of the input power ratio) in recent KAGRA operations.
Typically, we assume x ≪ x_0, neglecting the quadratic term.
To model the nonlinear response, I considered prominent peaks at 8 Hz, 20 Hz, and 40 Hz (IM vertical and pitch modes), as shown by the blue curve in Fig.1.
These peaks were modeled based on a white force noise input, appropriate vibration isolation from the IM and TM, and the DARM open-loop transfer function.
The Q-values for the 20-Hz and 40-Hz peaks were assumed to be 10³ and 10⁴, respectively, with the latter inferred from recent cryogenic Q-value measurements (klog:32476).
These modeled curves were then visually fitted to the measured DARM error signal (OMC-TRANS_SUM_DC_OUT), normalized by P_0.
This spectrum corresponds to x/x_0, controlled by the DARM loop.
Using ifft in matlab, I generated a time-series representation of the spectrum, added the quadratic nonlinearity, and reconstructed the spectrum.
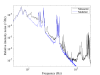
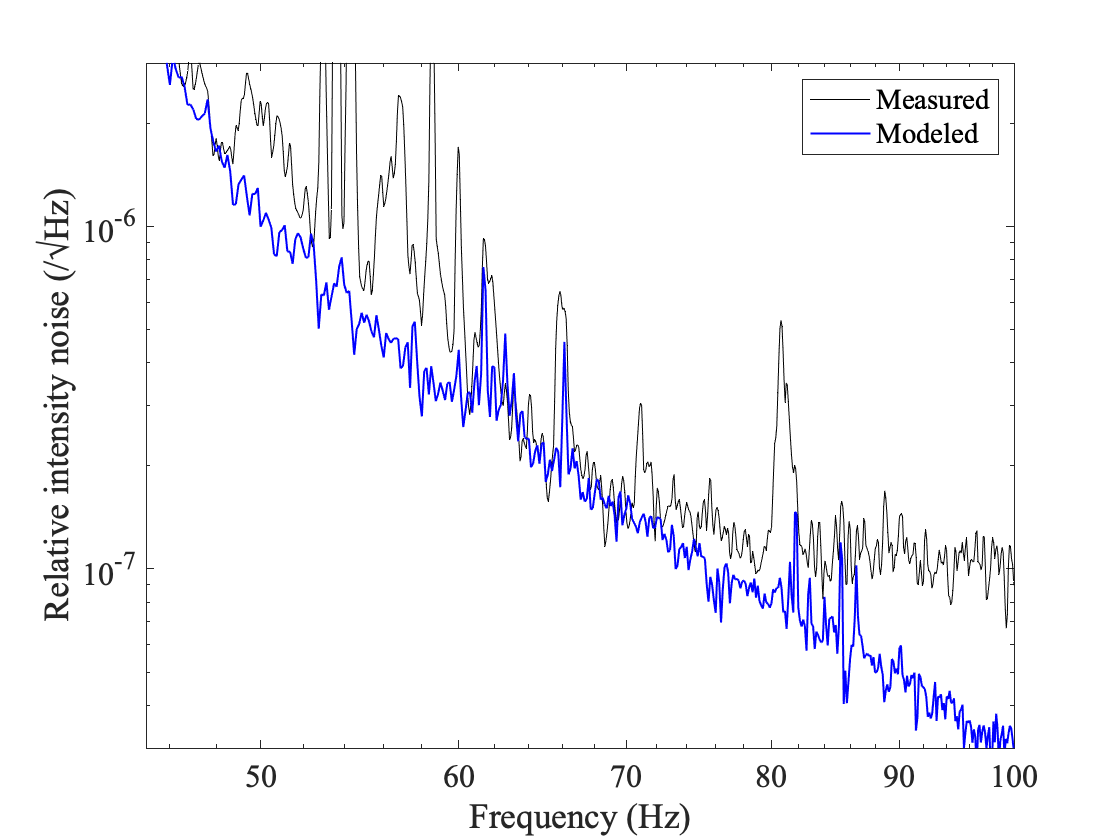
This revealed that some small peaks in the 60–90 Hz range were caused by the nonlinearity, as shown in Fig.2.
The peaks around 60 Hz originate from the nonlinear coupling between the 20-Hz and 40-Hz peaks, while those around 80 Hz correspond to the second harmonic of the 40-Hz peaks.
A simple order-of-magnitude estimate suggests that the spectral amplitude of the 20-Hz and 40-Hz peaks is 10⁻³ and 10⁻⁴, respectively, leading to nonlinear contributions in the range of 10⁻⁸ to 10⁻⁷.
To suppress these below shot noise (which is 5×10⁻⁹ /√Hz for an offset power of 15 mW), all peak amplitudes must remain below 10⁻⁴ /√Hz.
Additional Concern: Excess Force Noise on IMs
Another issue is that the noise tail from the 40-Hz peaks might be limiting the spectral floor at 60–80 Hz.
While I modeled the observed peaks using a white force noise input, the inferred force noise level is unexpectedly high.
For instance, assuming a reasonable vertical-horizontal coupling of 1% or a pitch miscentering of a few mm, the expected force noise should be on the order of 10⁻⁹ N/√Hz. However, the inferred force noise level is two orders of magnitude higher than the expected thermal noise and the coil driver noise, which is calculated by approximately 10⁻⁸ V/√Hz in the output voltage spectrum.
Proposal:
To test whether IM actuator noise contributes to the observed sensitivity limitation, I propose:
-
Unplugging the cables connected to the IM coils from the coil driver, or
-
Inserting resistors (e.g. 50Ω) immediately after the coil driver to reduce actuator efficiency.
Since the IM actuators at EY, IX, and IY are actively used for only a few narrow-band damping controls, this test can be conducted more easily, and we can confirm whether the sensitivity will be improved or not.
