[Yamaguchi, Oshima, Komori, Tanaka, Ushiba]
In klog32003, the Q factors were measured at 250 K. Today, we measured them with the IM temperature at 87 K. We excited vertical resonances around 10 Hz, roll resonances around 22 Hz, and pitch resonances around 7.5 Hz for the Q measurement. The starting times for ringdown and signals, which can be used for Q measurement, for each suspension are as follows:
ITMX:
07:51:30 UTC: K1:VIS-ITMX_NBDAMP_V2_OUT_DQ
08:51:00 UTC: K1:VIS-ITMX_NBDAMP_R2_OUT_DQ
09:14:40 UTC: K1:VIS-ITMX_NBDAMP_P3_OUT_DQ
ETMX:
09:47:30 UTC: K1:VIS-ETMX_NBDAMP_V2_OUT_DQ
10:35:00 UTC: K1:VIS-ETMX_NBDAMP_R2_OUT_DQ
10:52:30 UTC: K1:VIS-ETMX_NBDAMP_P3_OUT_DQ
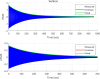
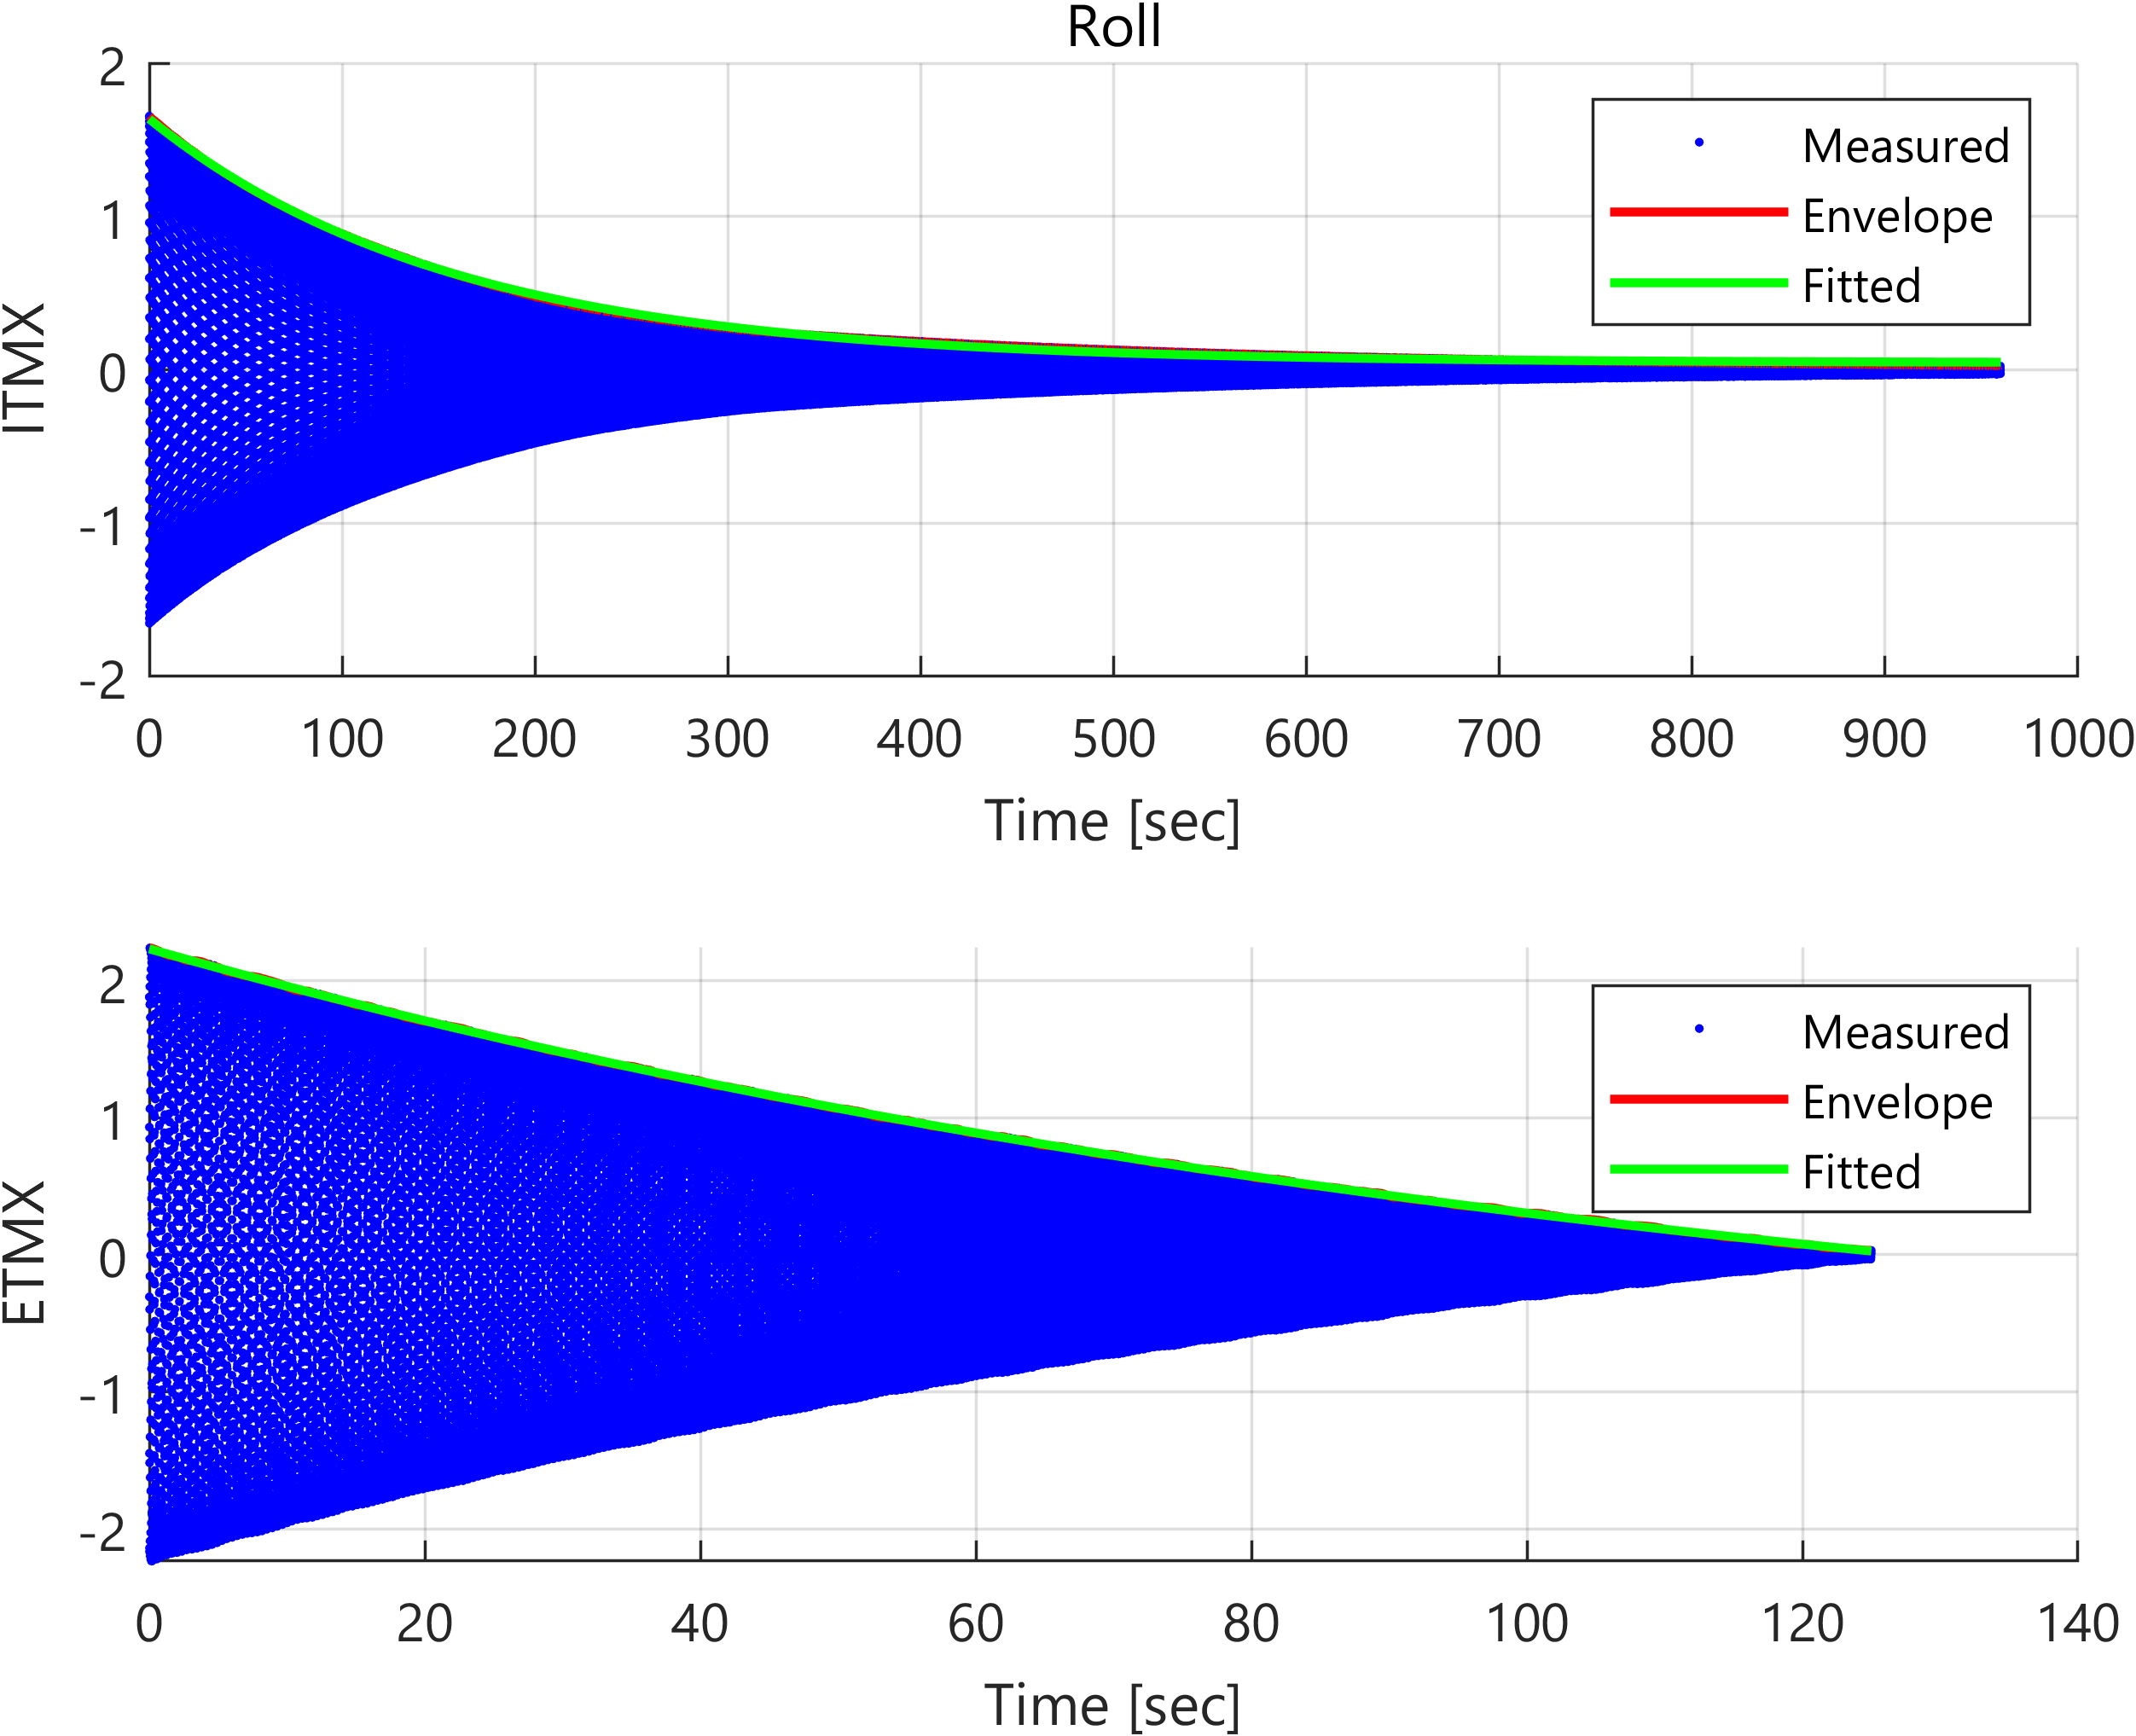
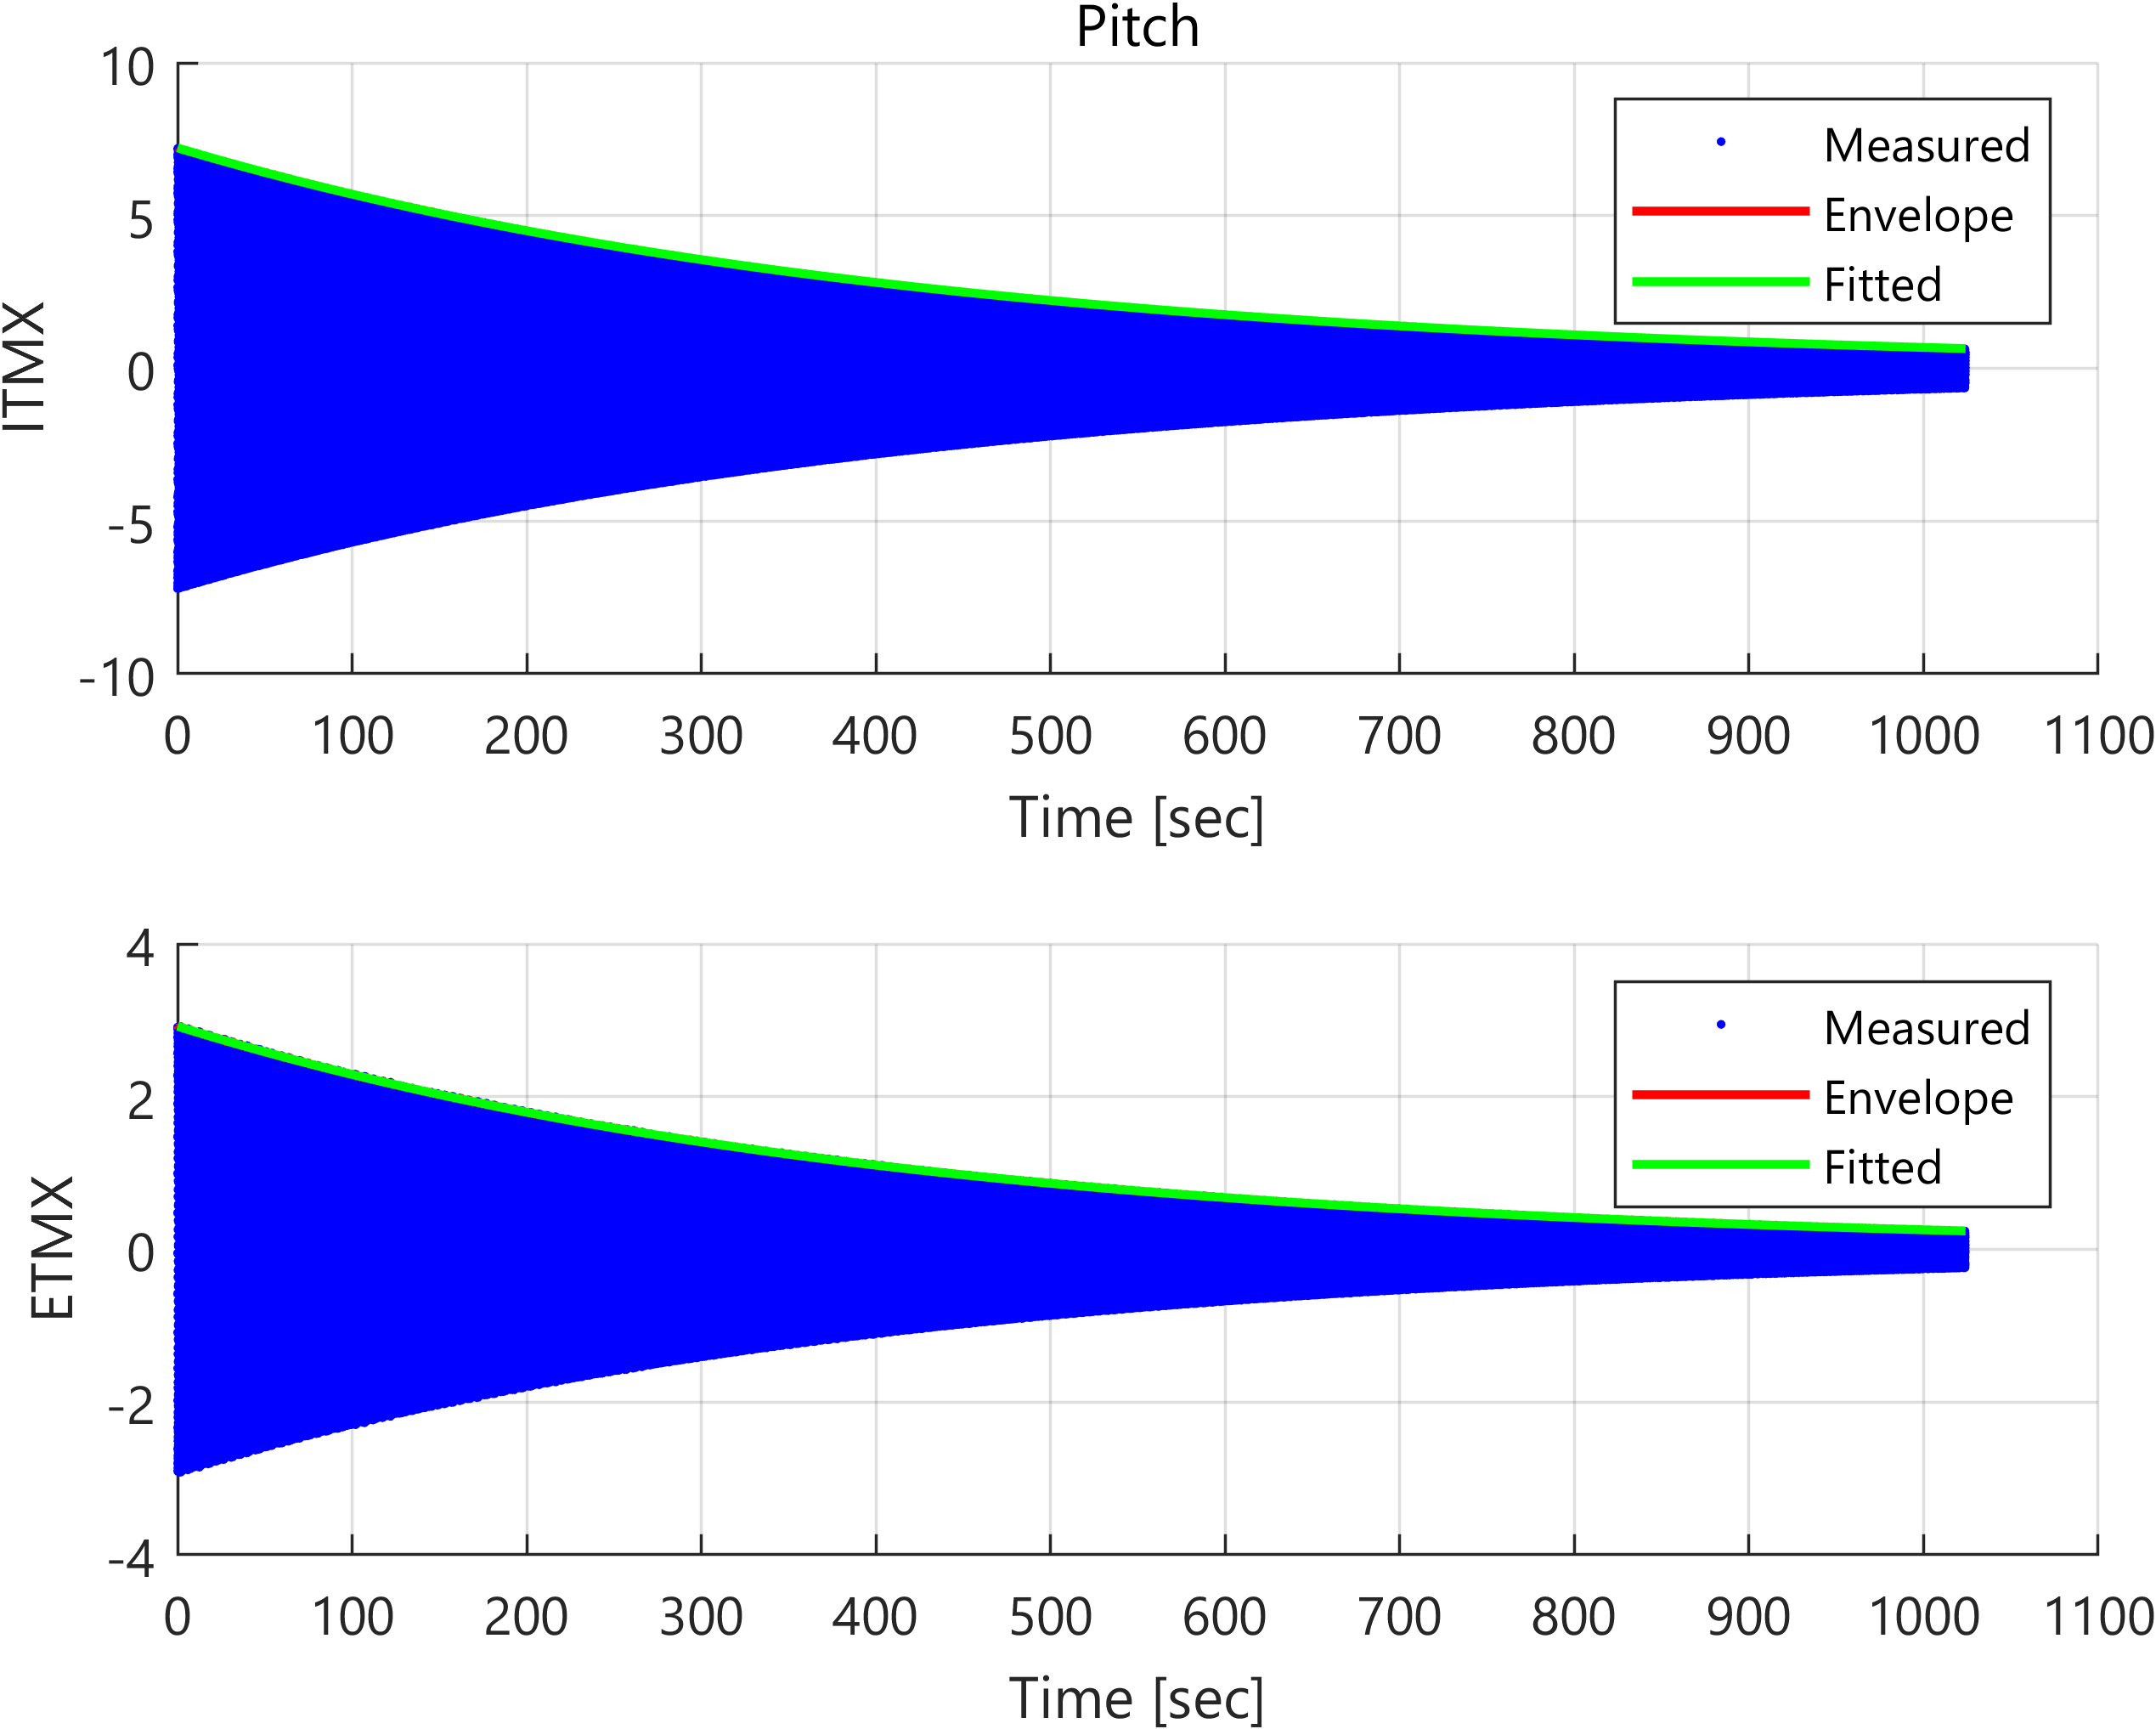
We estimated the Q factors of the roll, pitch, and vertical modes of the two test masses, corresponding to the Q factors derived from the ringdown measurement. The results are presented in the attached figures (Fig. 1: roll, Fig. 2: vertical, Fig. 3: pitch) and summarized in the following list.
| Roll | Vertical | Pitch | ||||
| Resonance | Q-value | Resonance | Q-value | Resonance | Q-value | |
| ETMX | 23.02 Hz | 8.6e3 | 9.676 Hz | 6.3e3 | 7.441 Hz | 9.6e3 |
| ITMX | 22.891 Hz | 1.7e4 | 10.104 Hz | 5.0e3 | 7.375 Hz | 9.8e3 |
The estimation errors for the resonant frequency and the Q-value are 2 mHz and 0.1e3, respectively. Note that ringdown was too fast for ETMX roll, and the frequency resolution was 20 mHz for the roll frequency of ETMX. Additionally, when we excited ETMX vertical too much (count > 1.0), ETMX_TM_wit_P/Y drifted suddenly, and the MN sensing sum was saturated.
Compared to the results from klog32003 at 250 K, the Q-values at 87 K were significantly larger.
