Reports 1-1 of 1 Clear search Modify search
VIS (IFI)
dan.chen - 17:35 Tuesday 25 February 2025 (32796) Print this report
Measurement of the Resonance of the IFI Steering Mirror Mount

With Yamazaki-san,

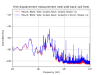
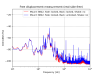
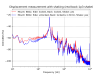
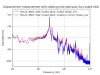
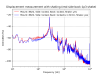
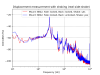
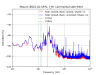
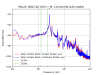
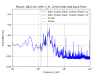
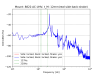
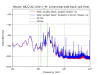
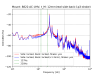
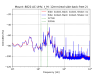
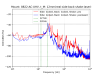
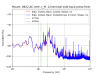
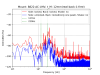
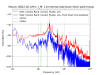
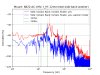
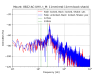
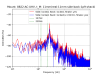
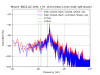
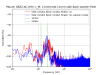
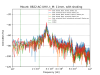
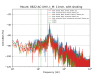
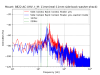
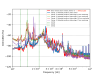
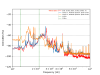
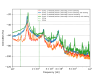
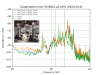
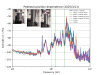
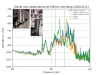
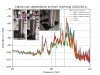
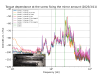
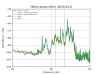
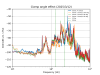
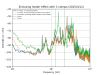
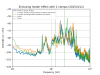
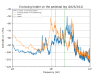
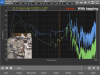
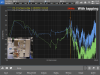
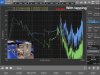
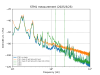
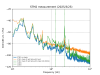
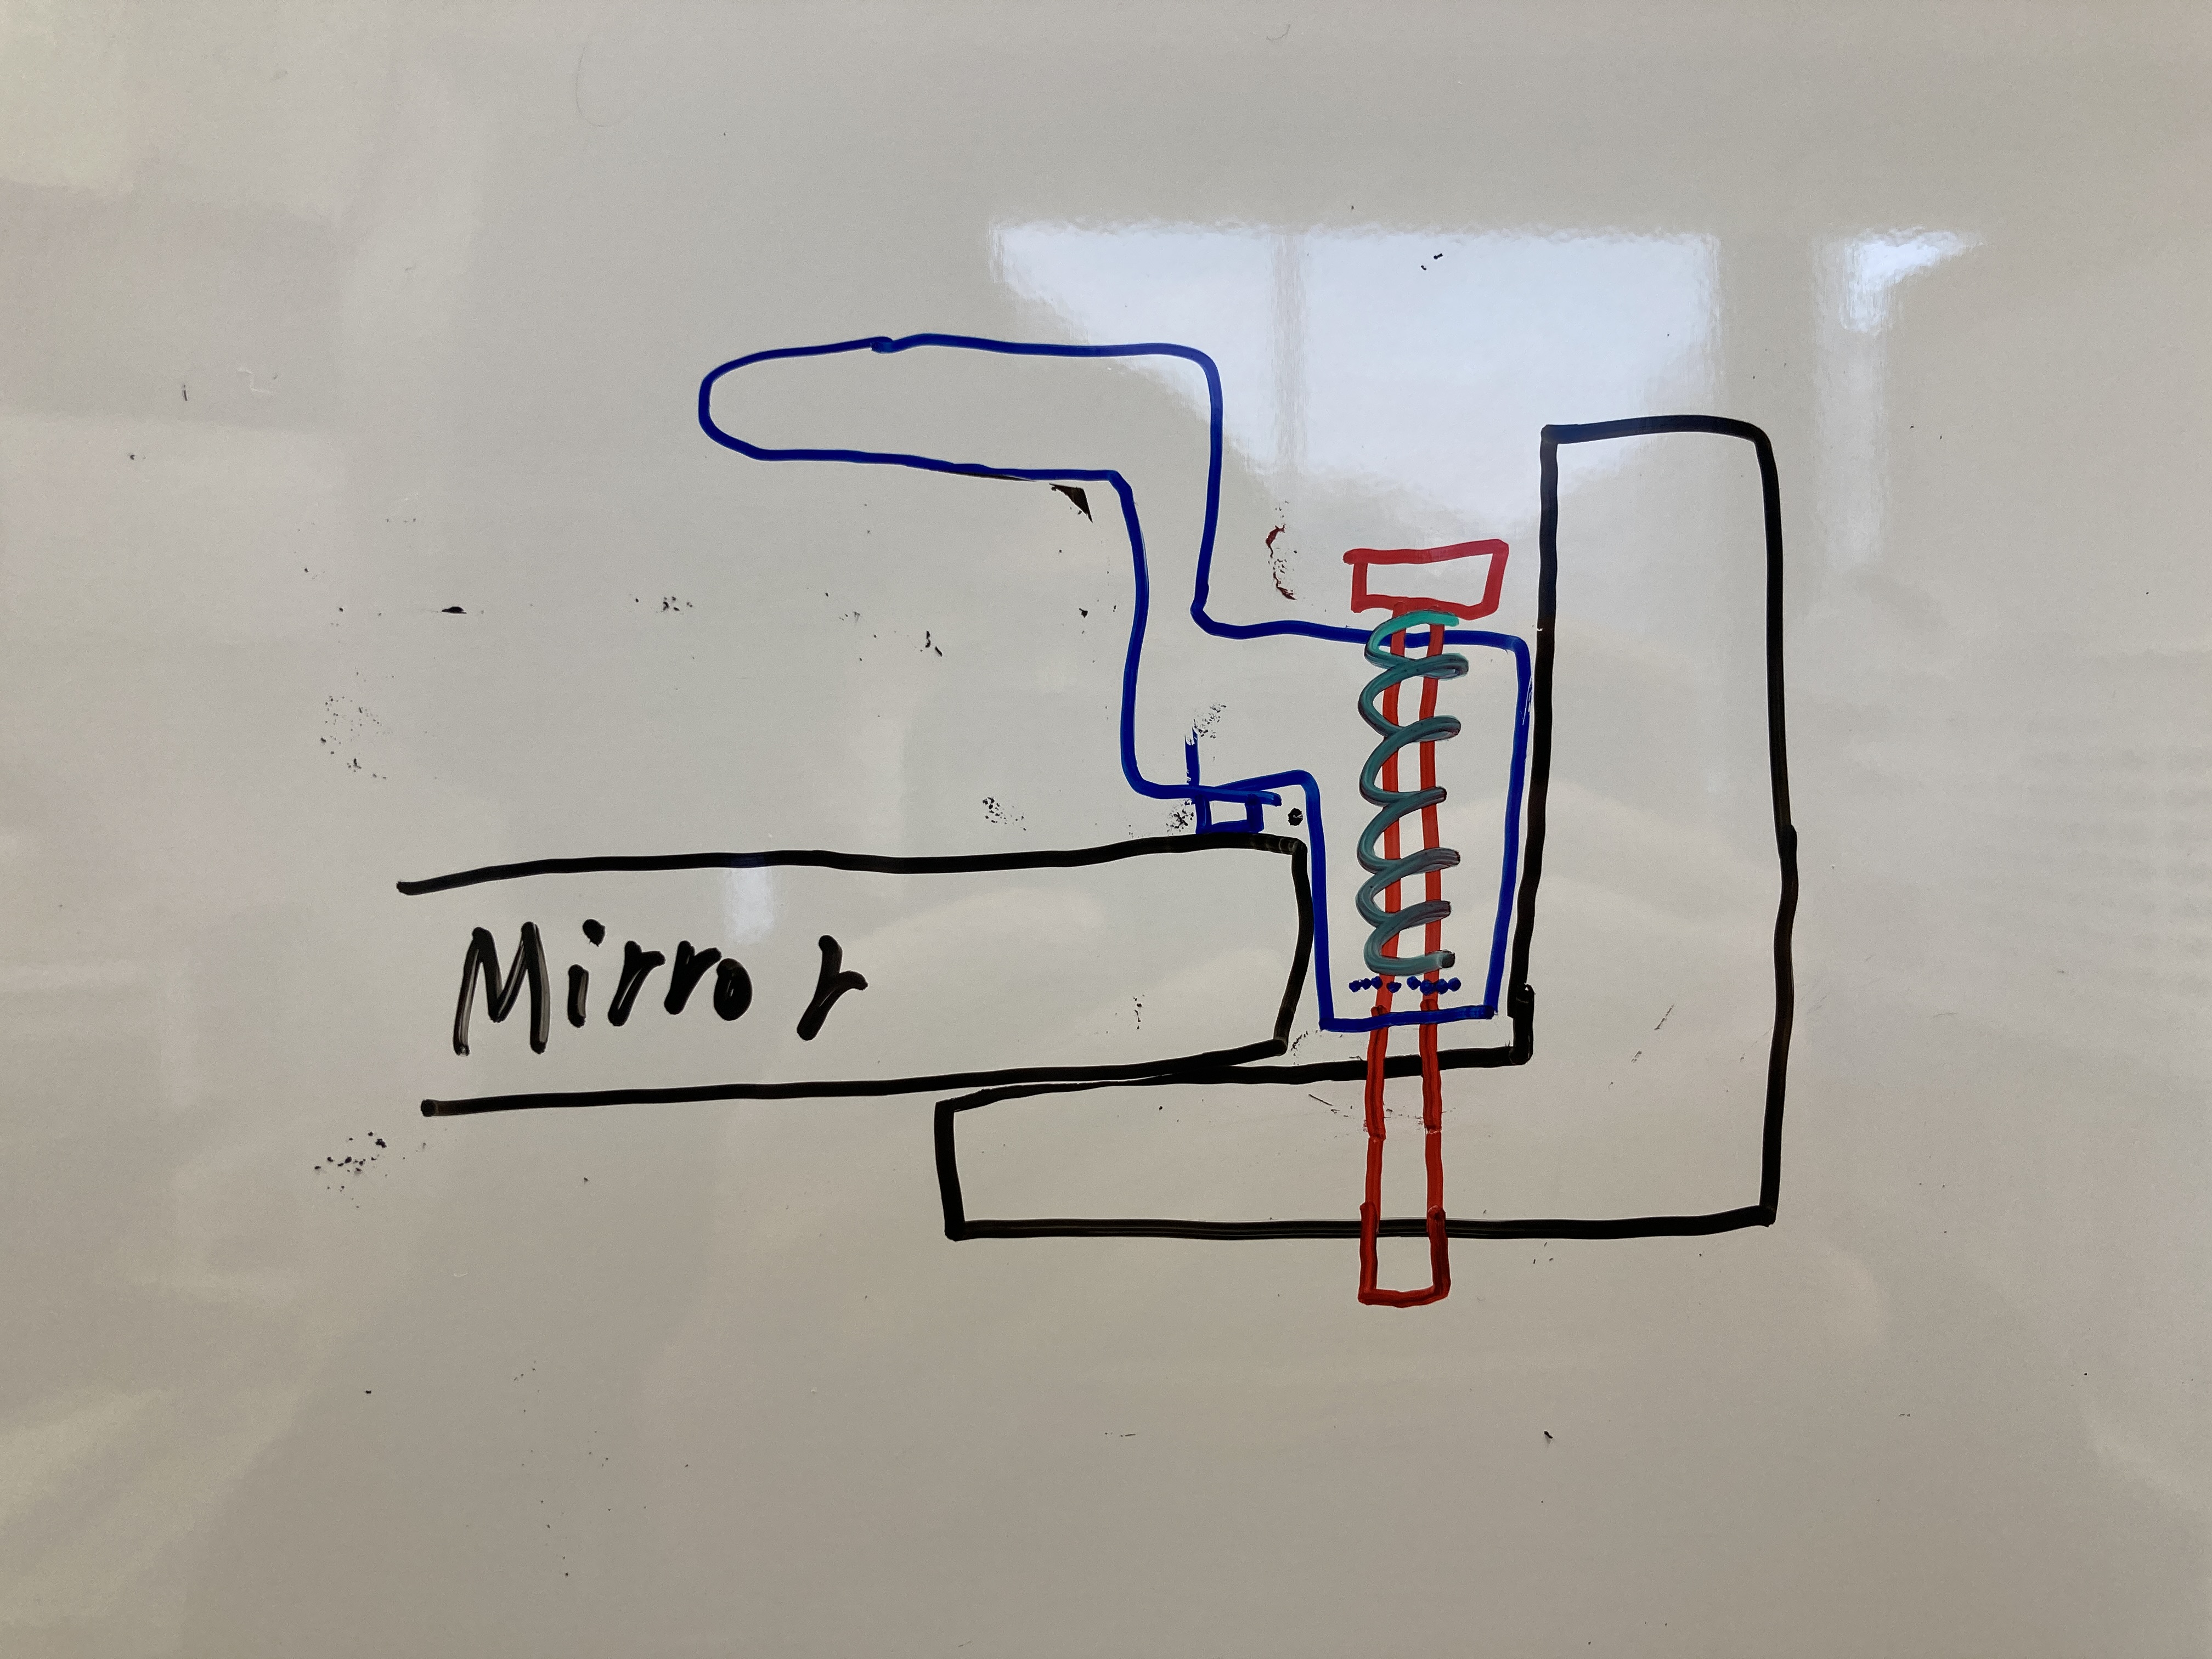
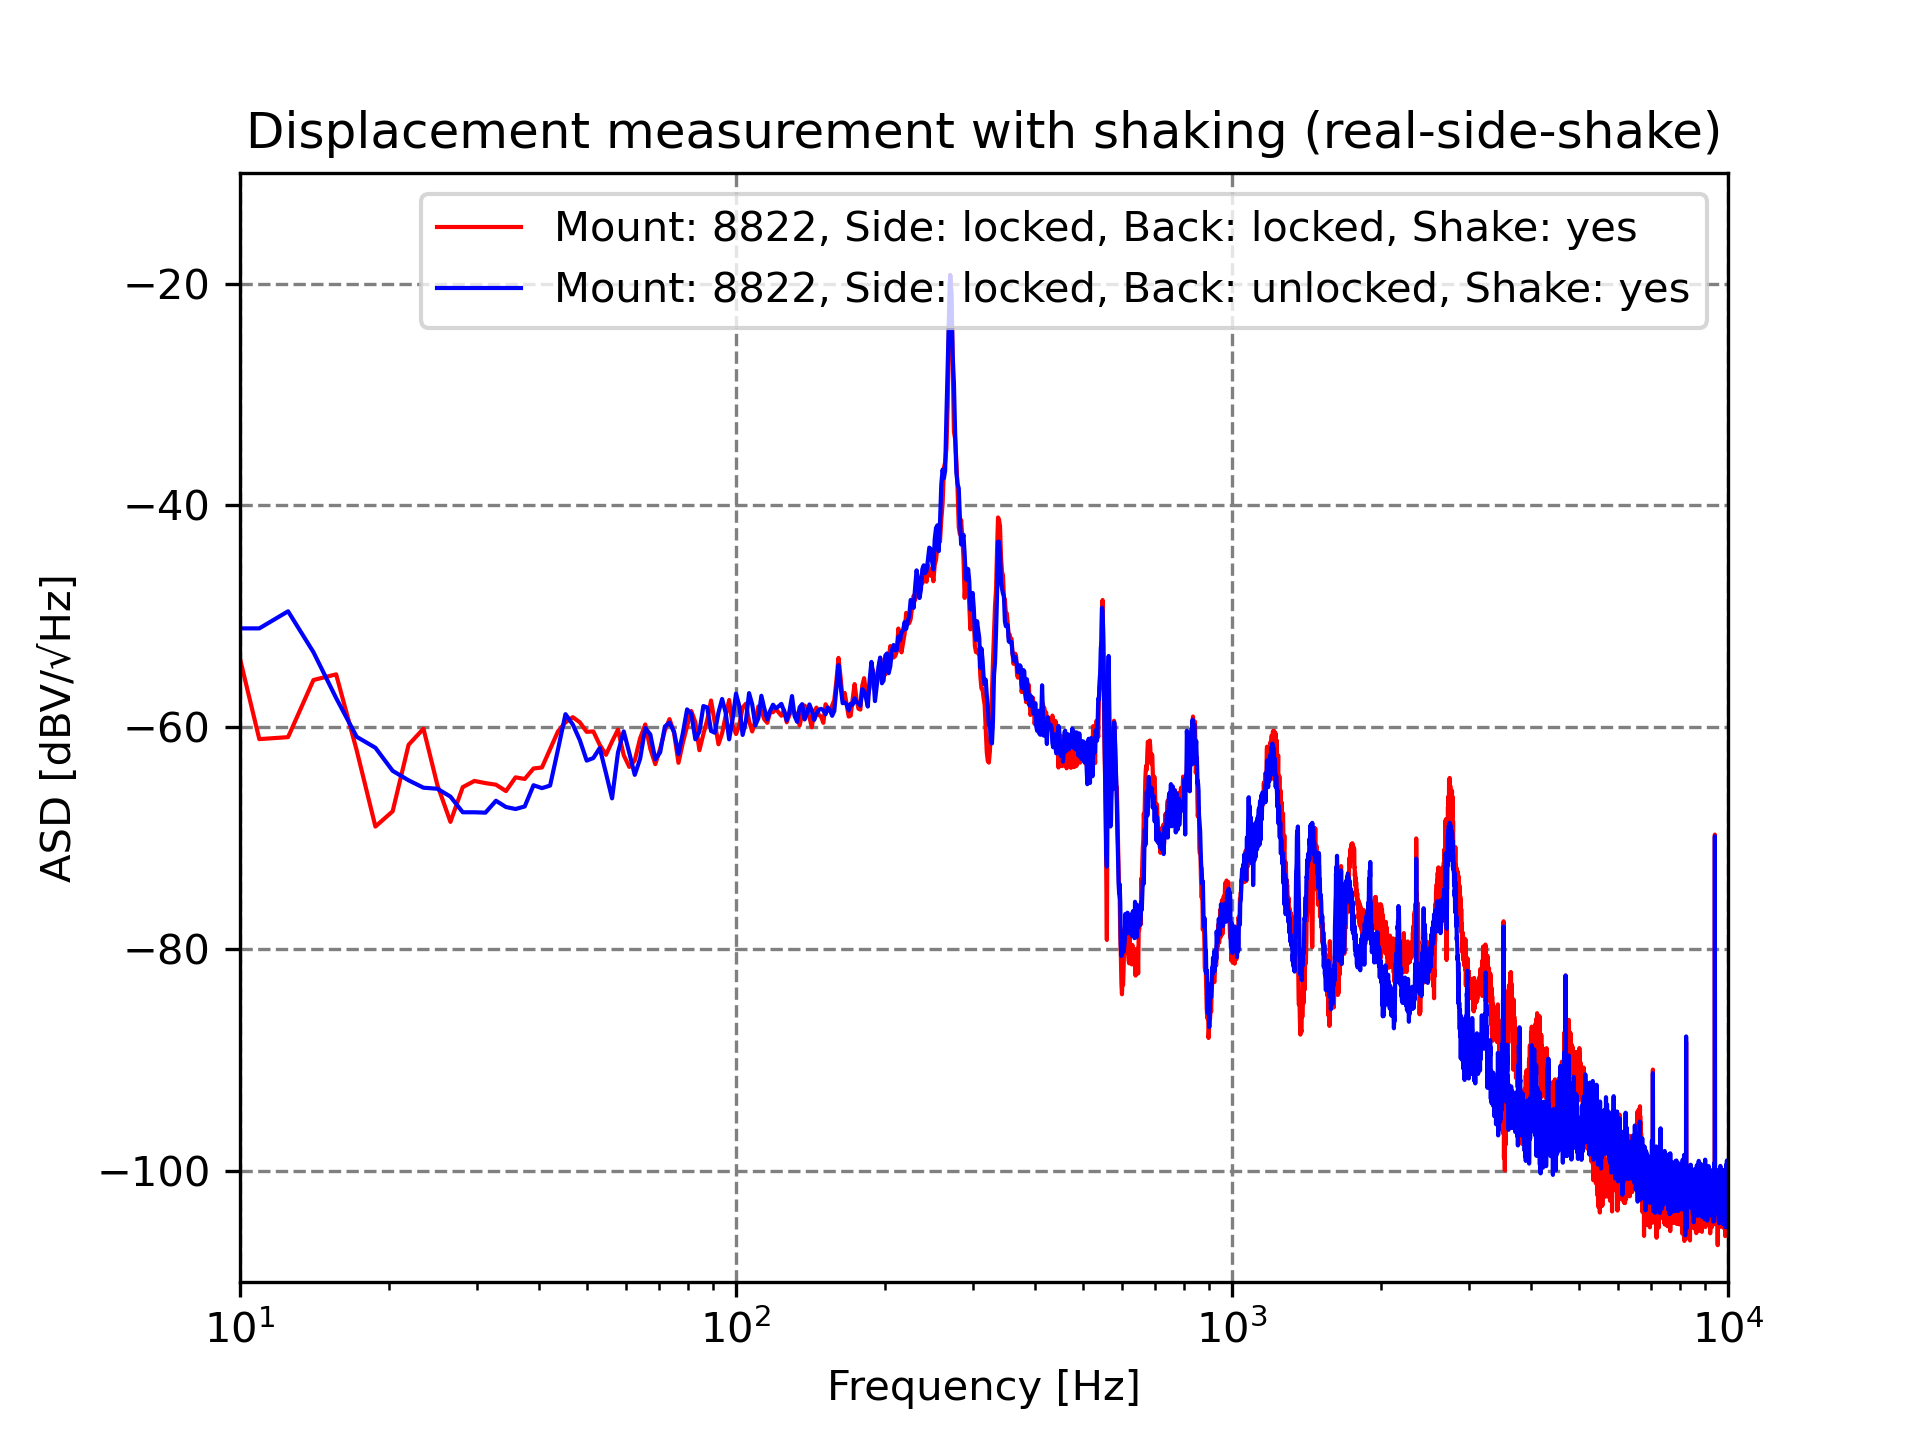
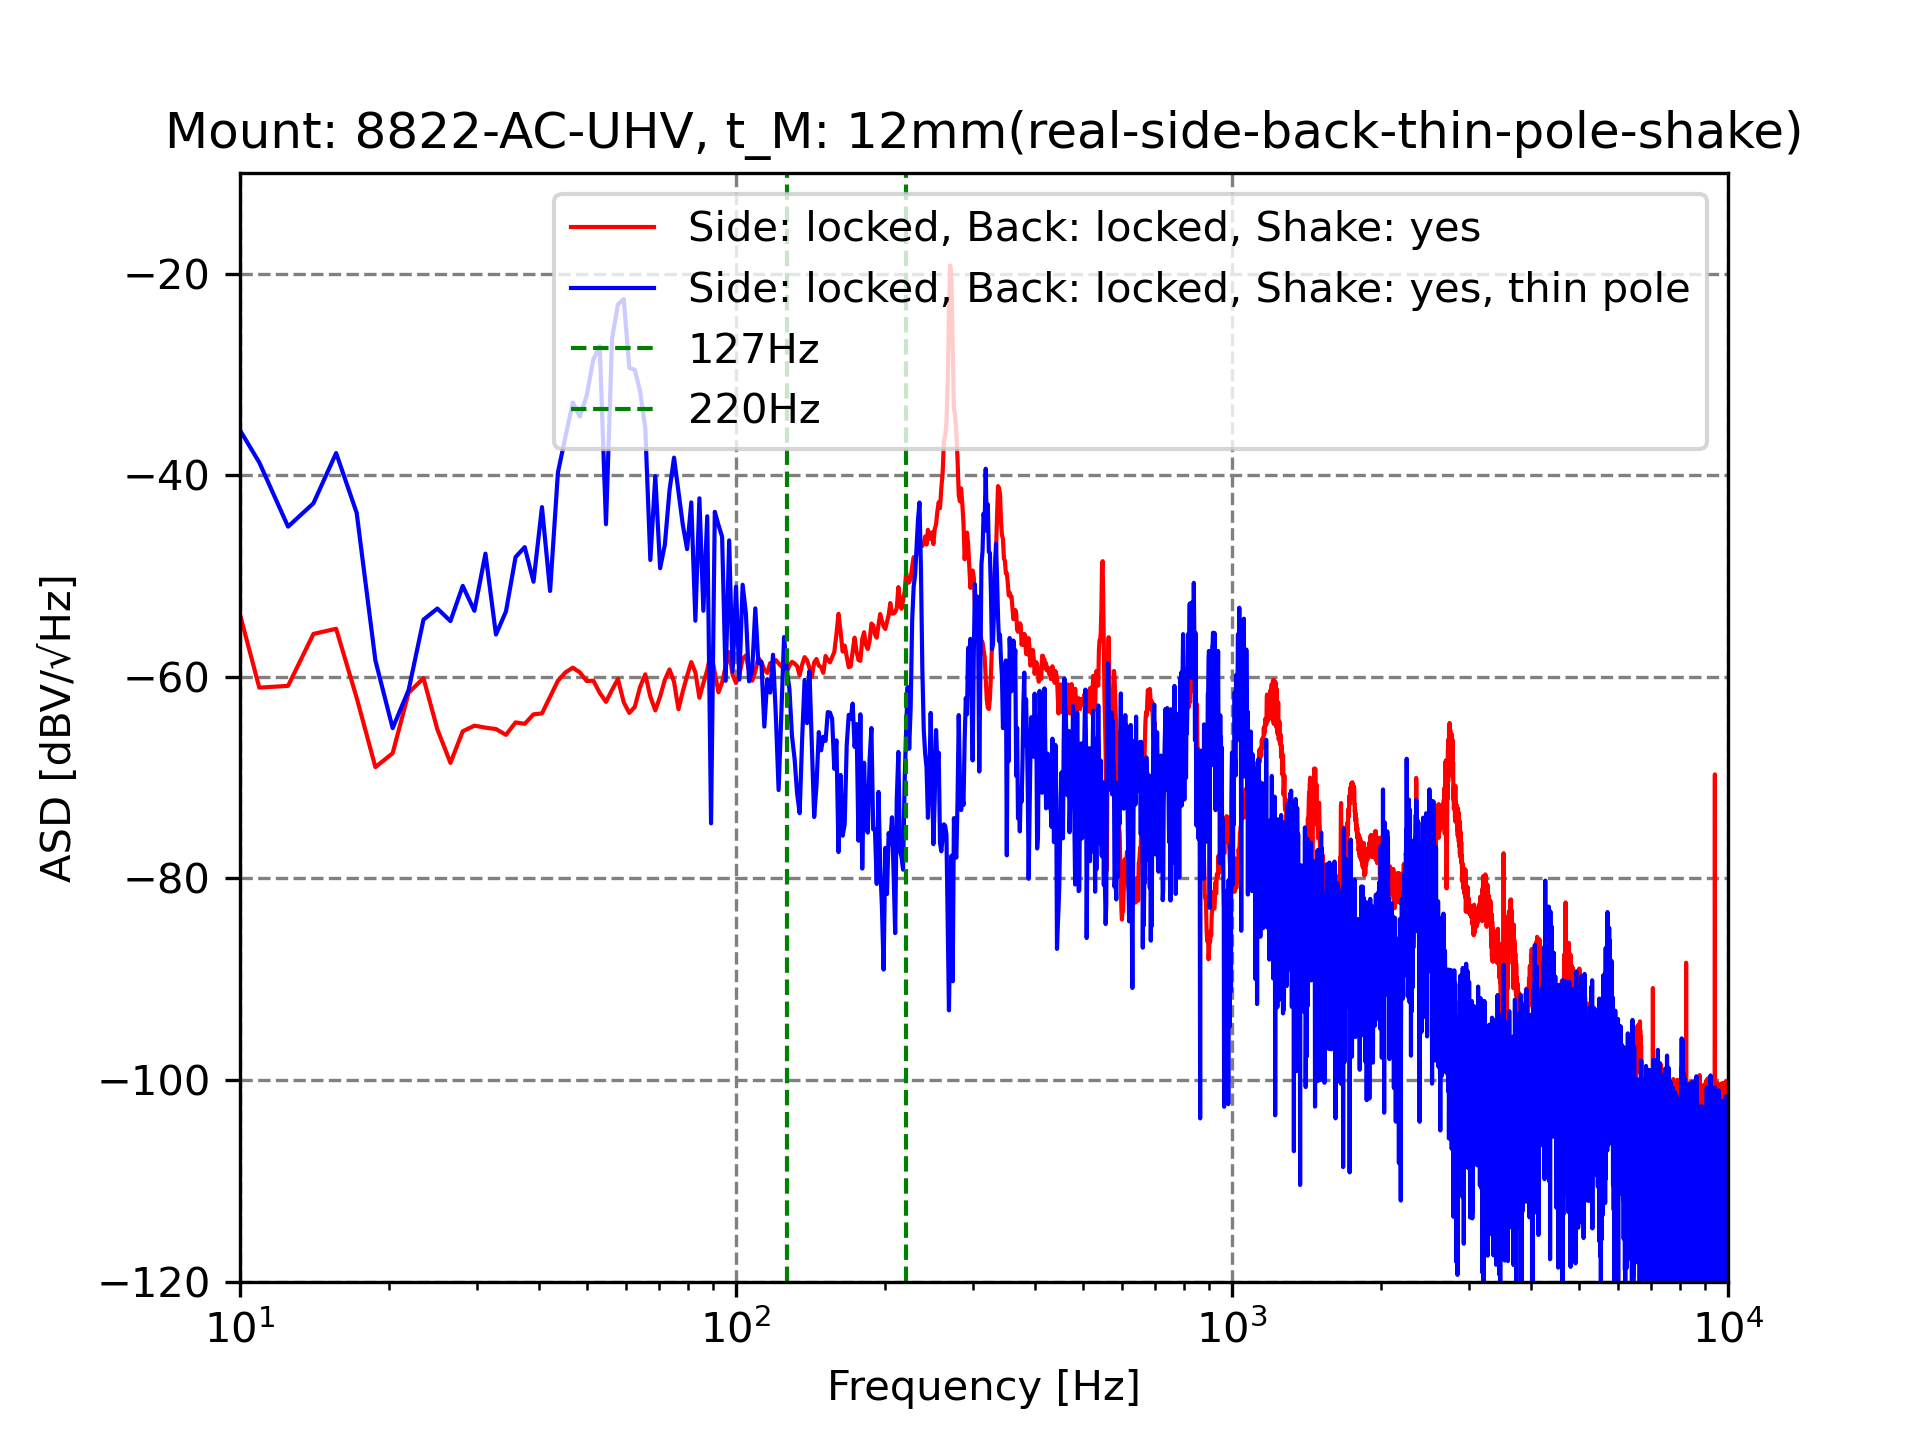
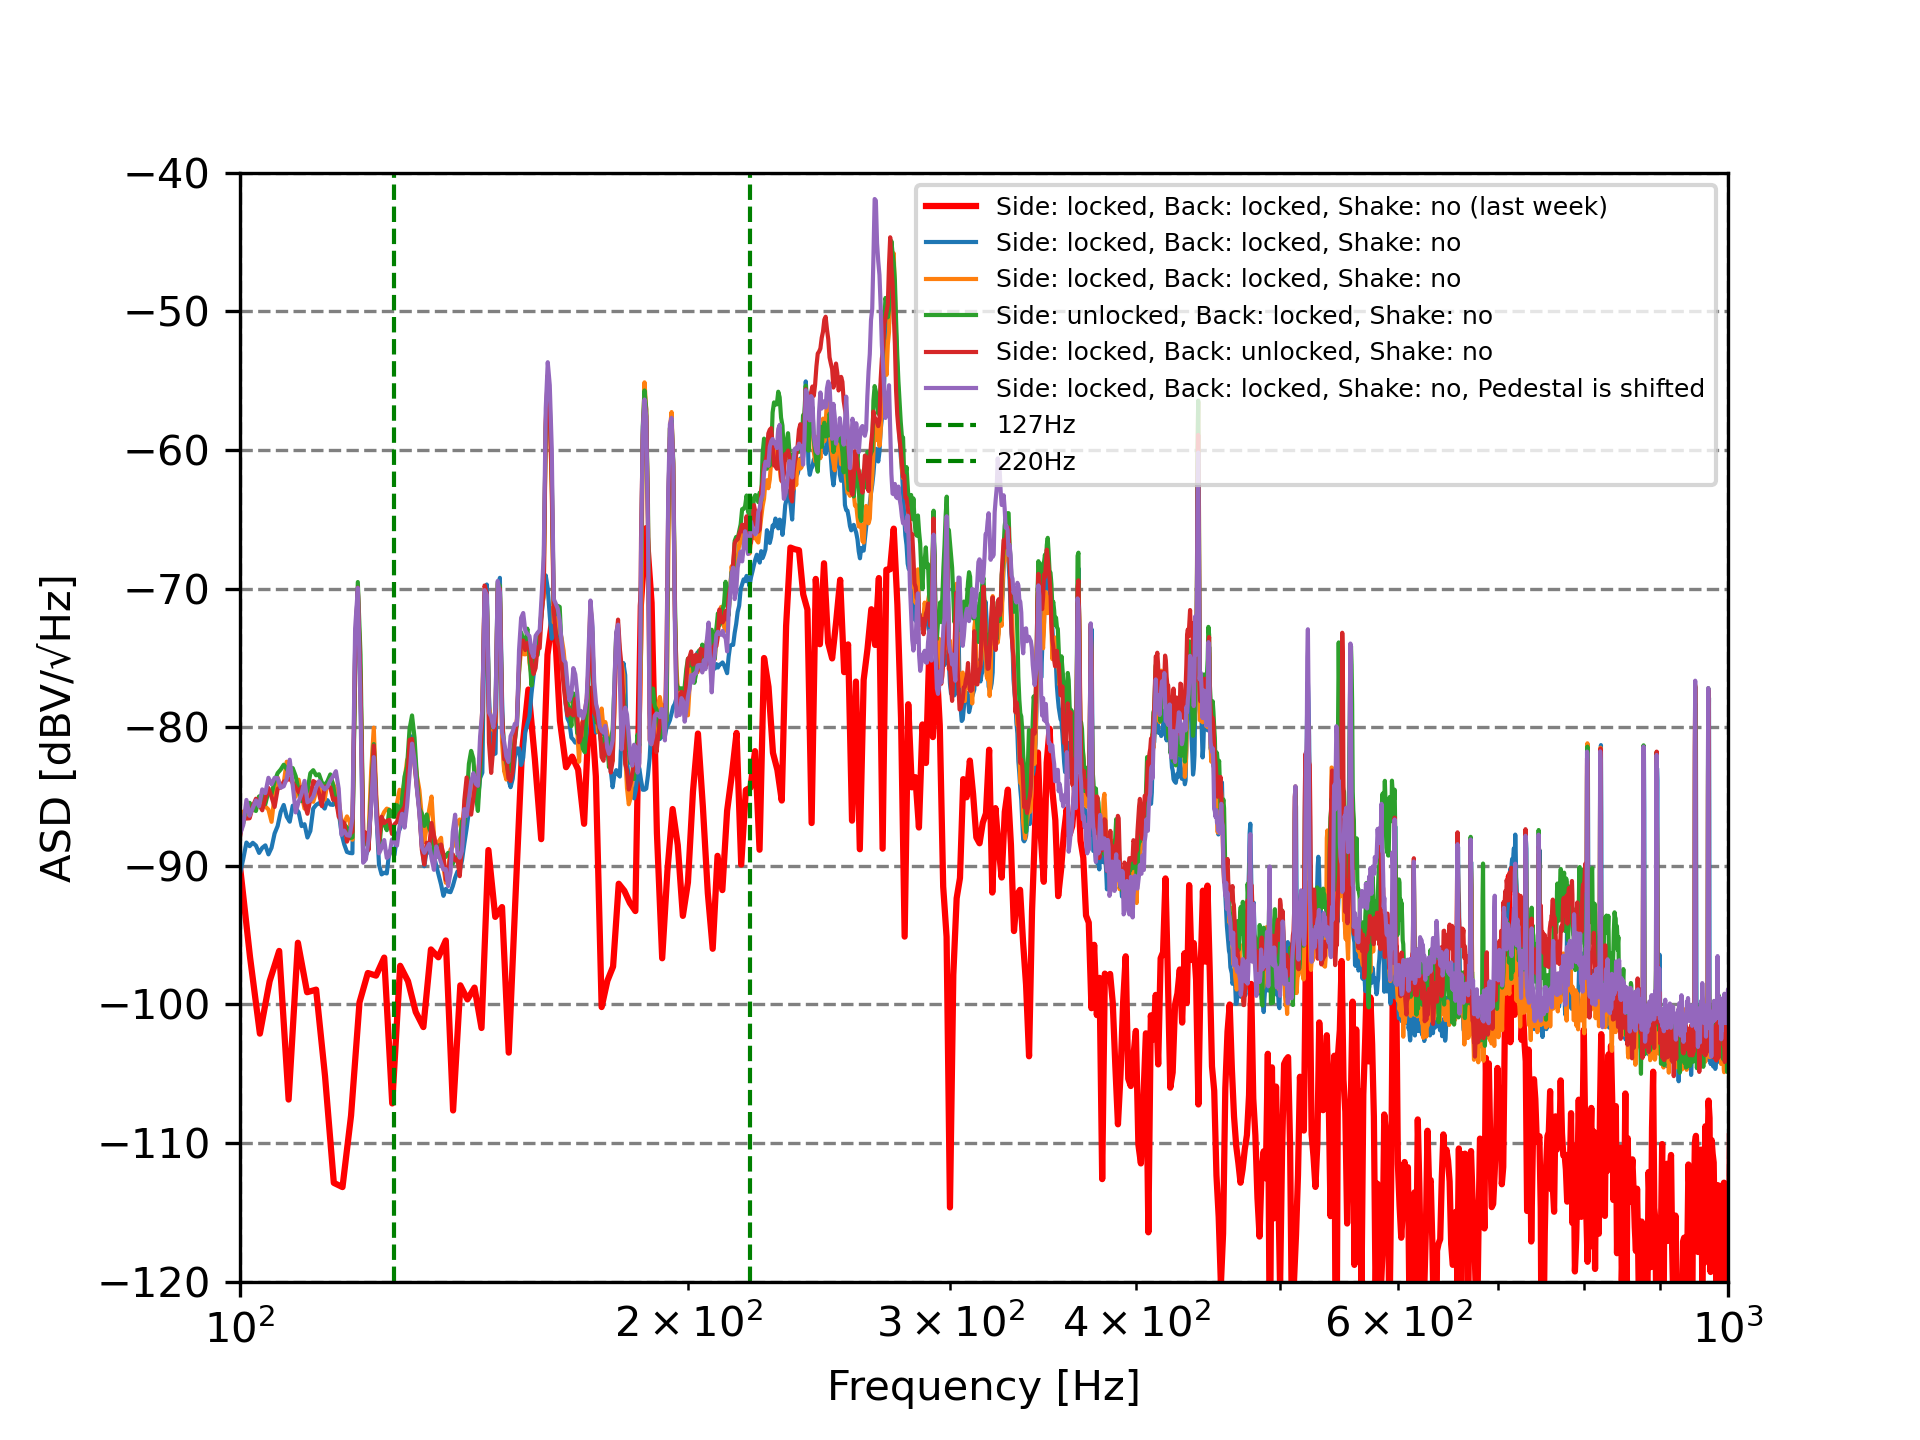
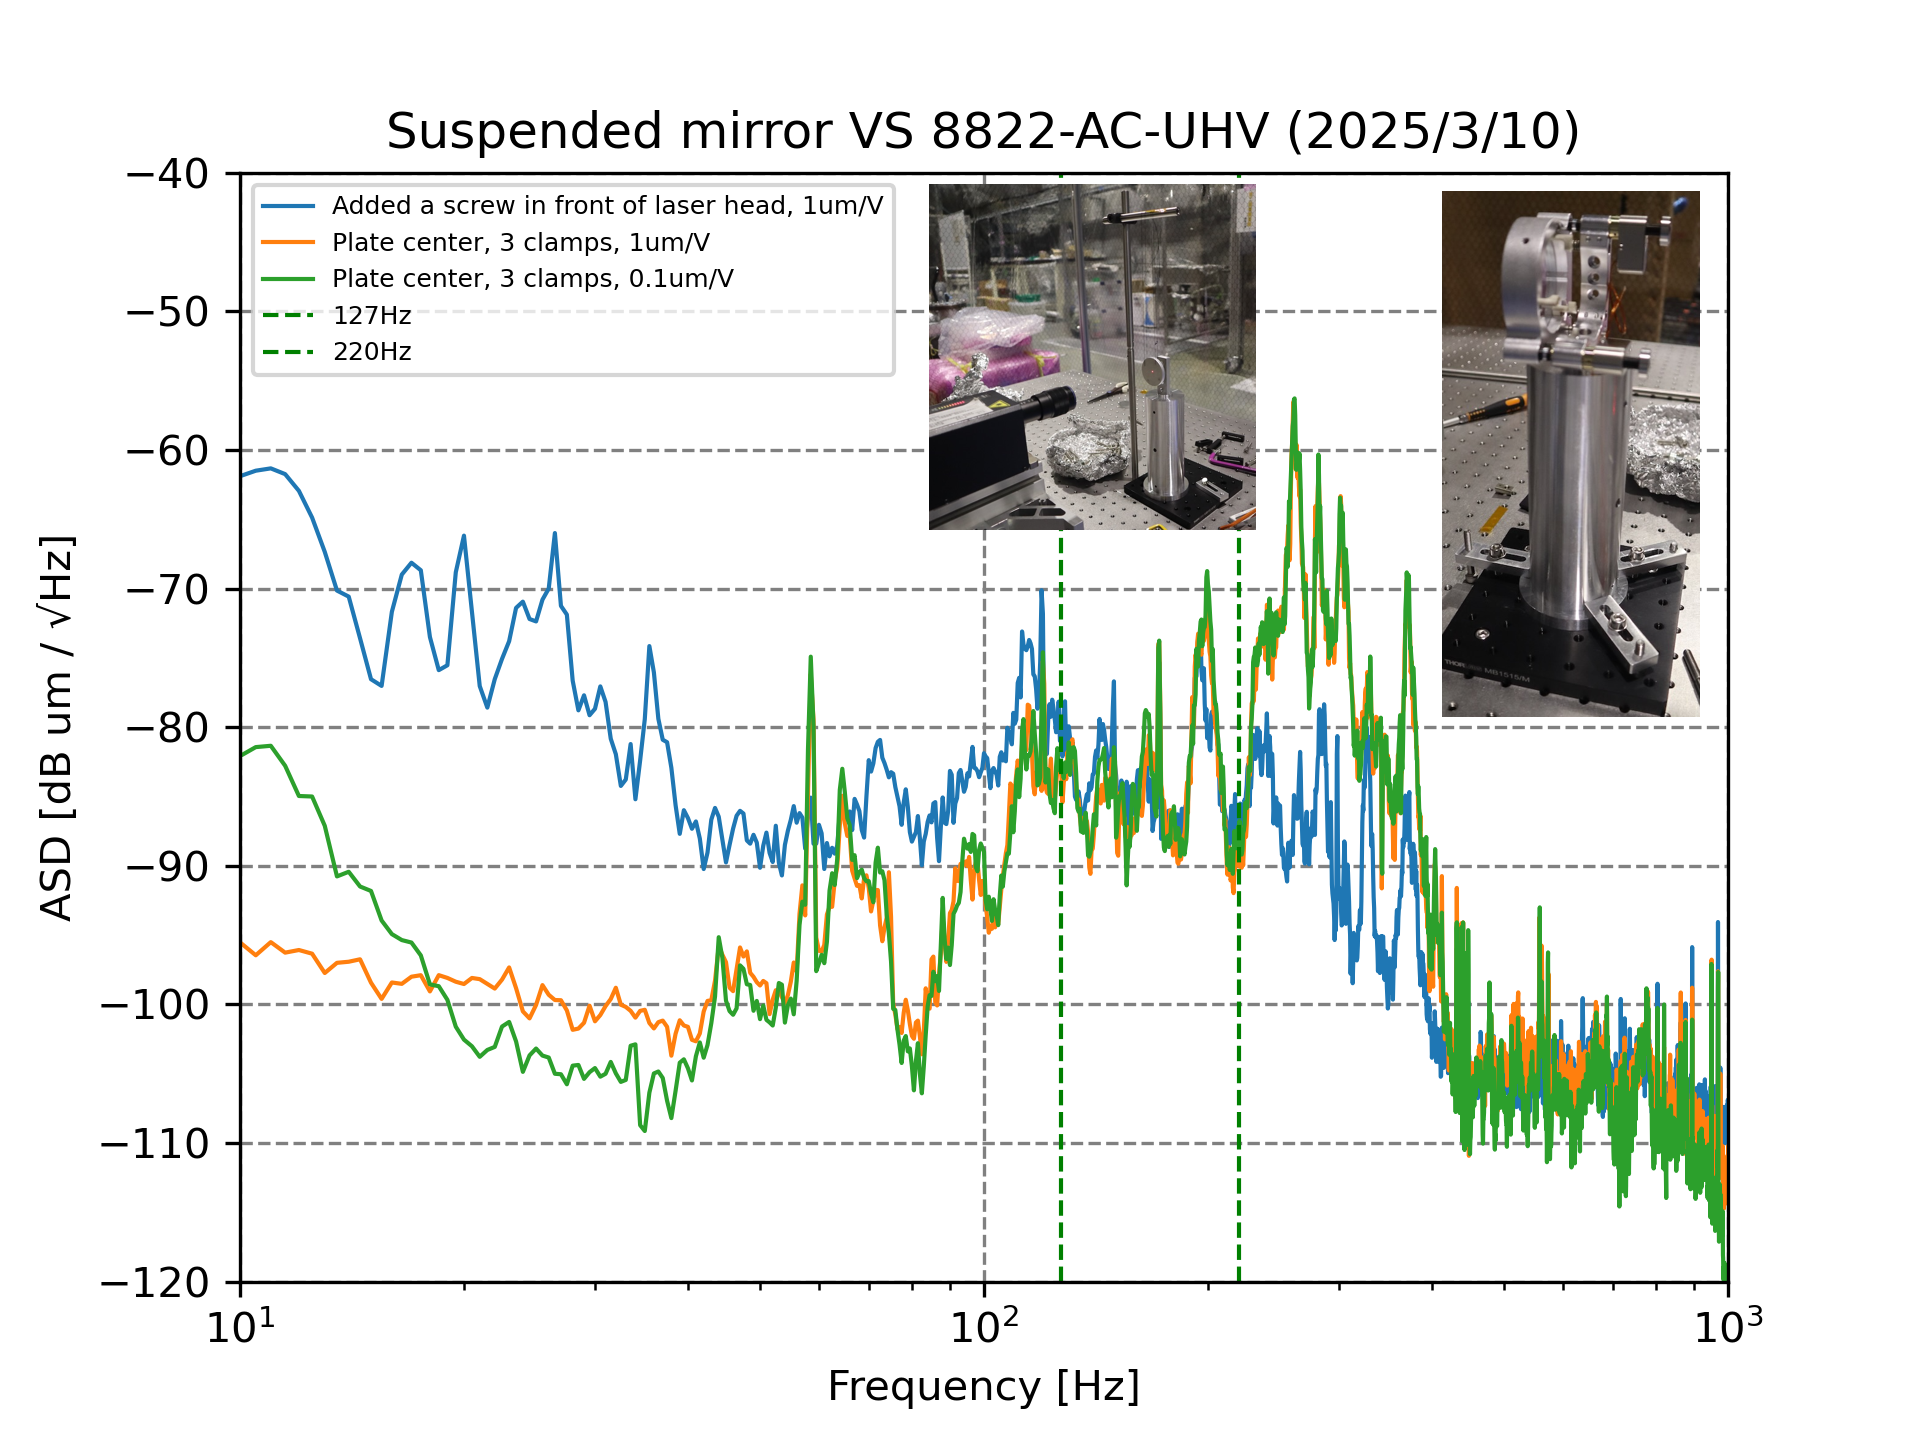
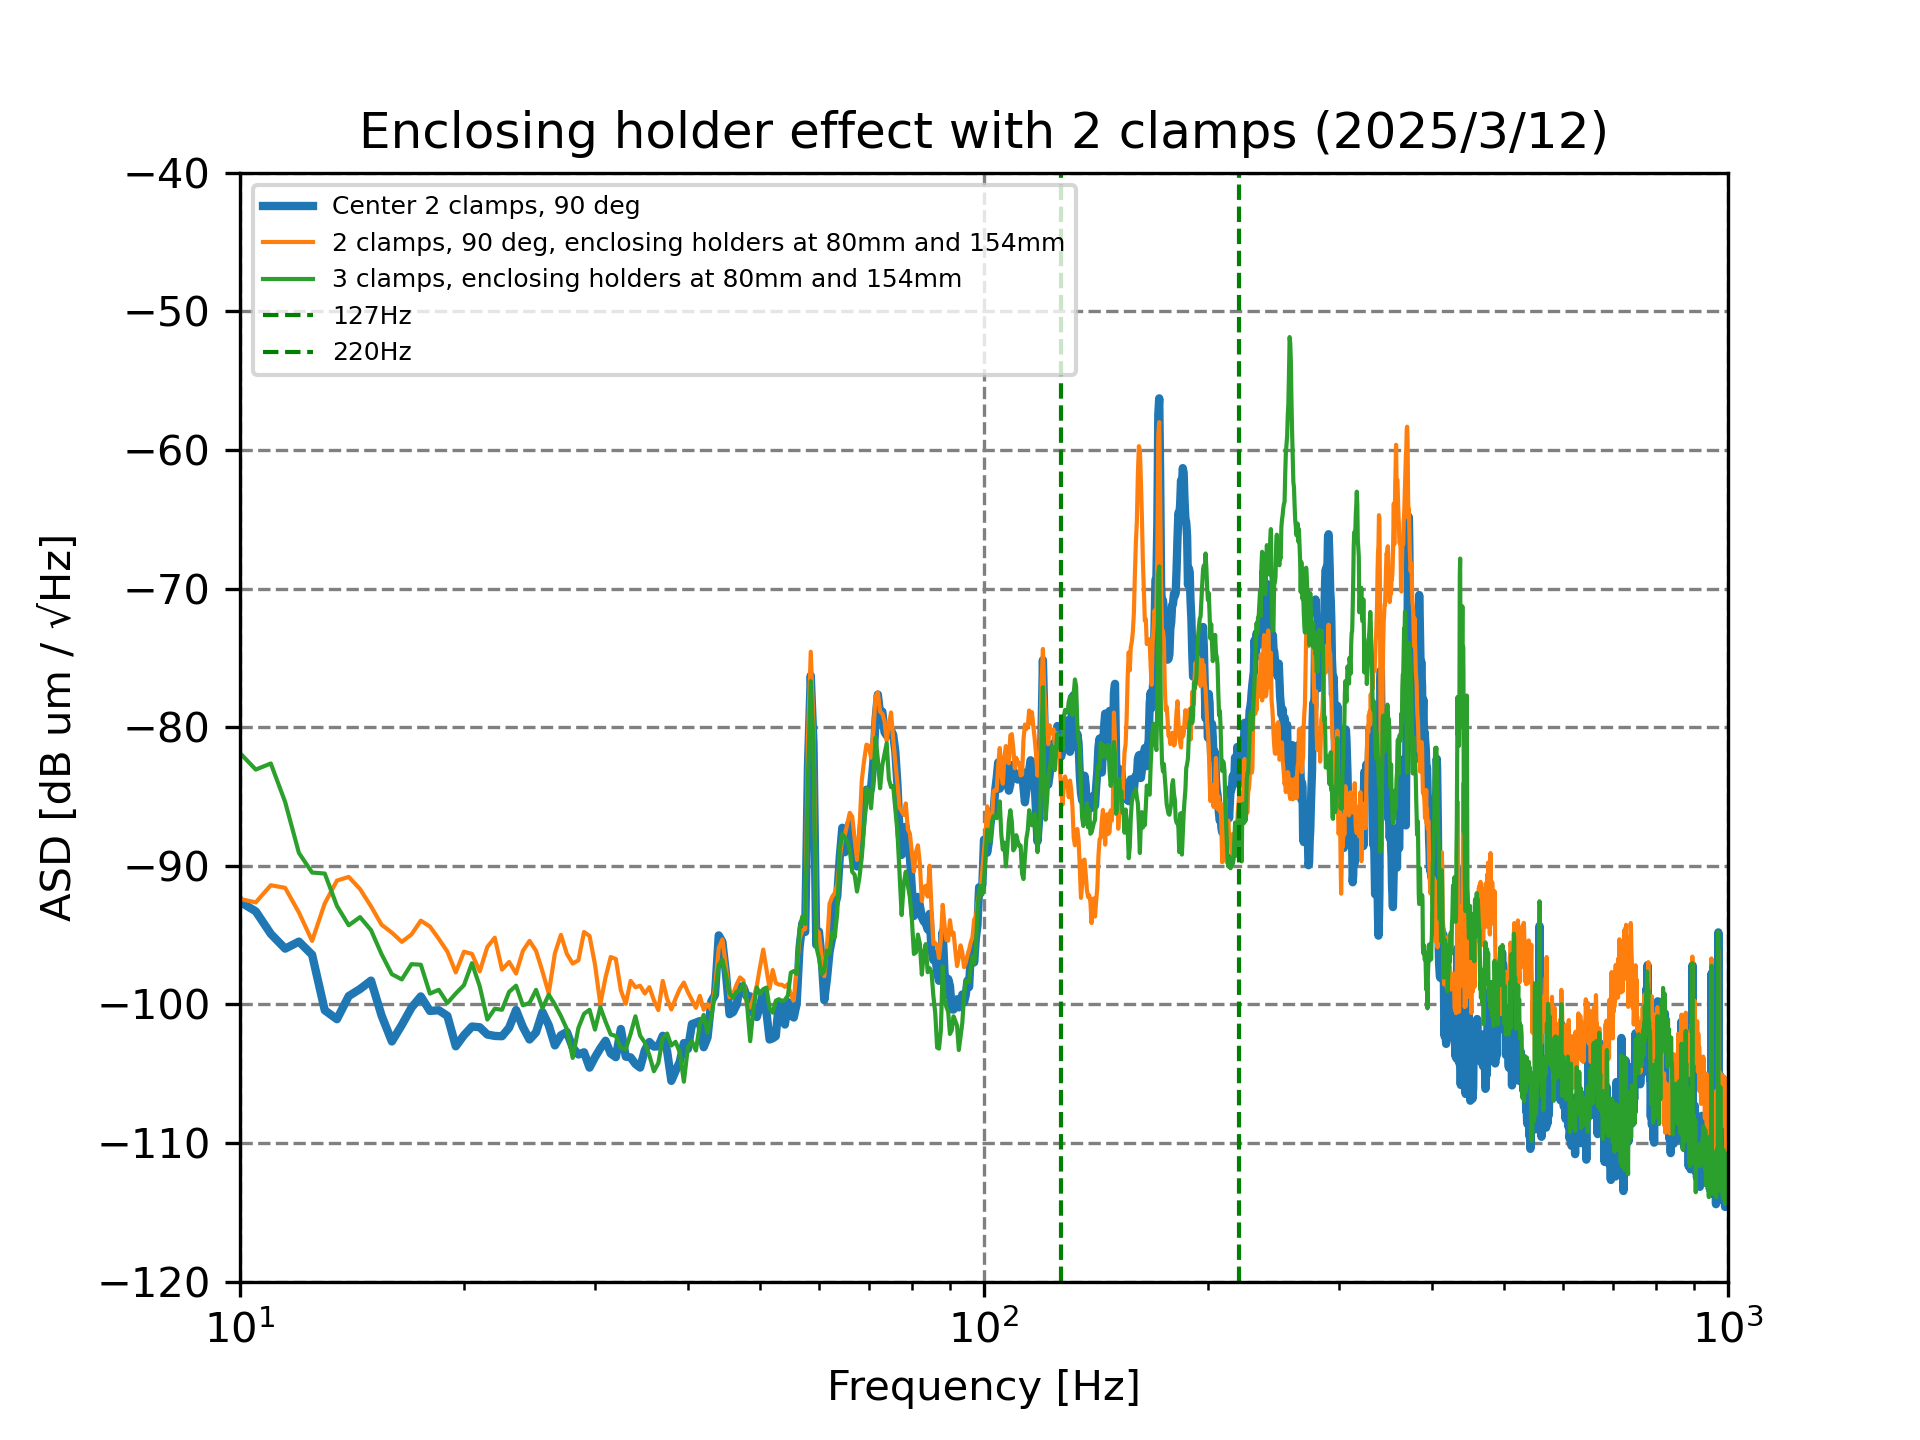
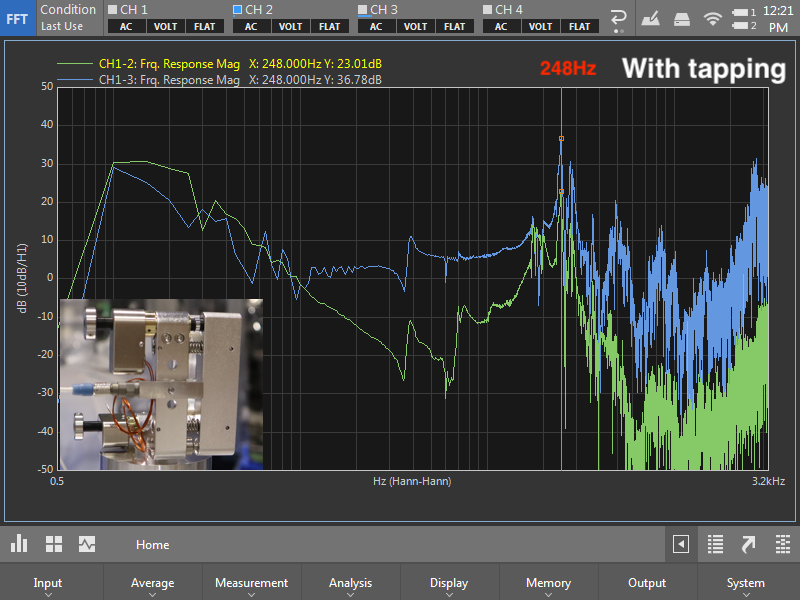
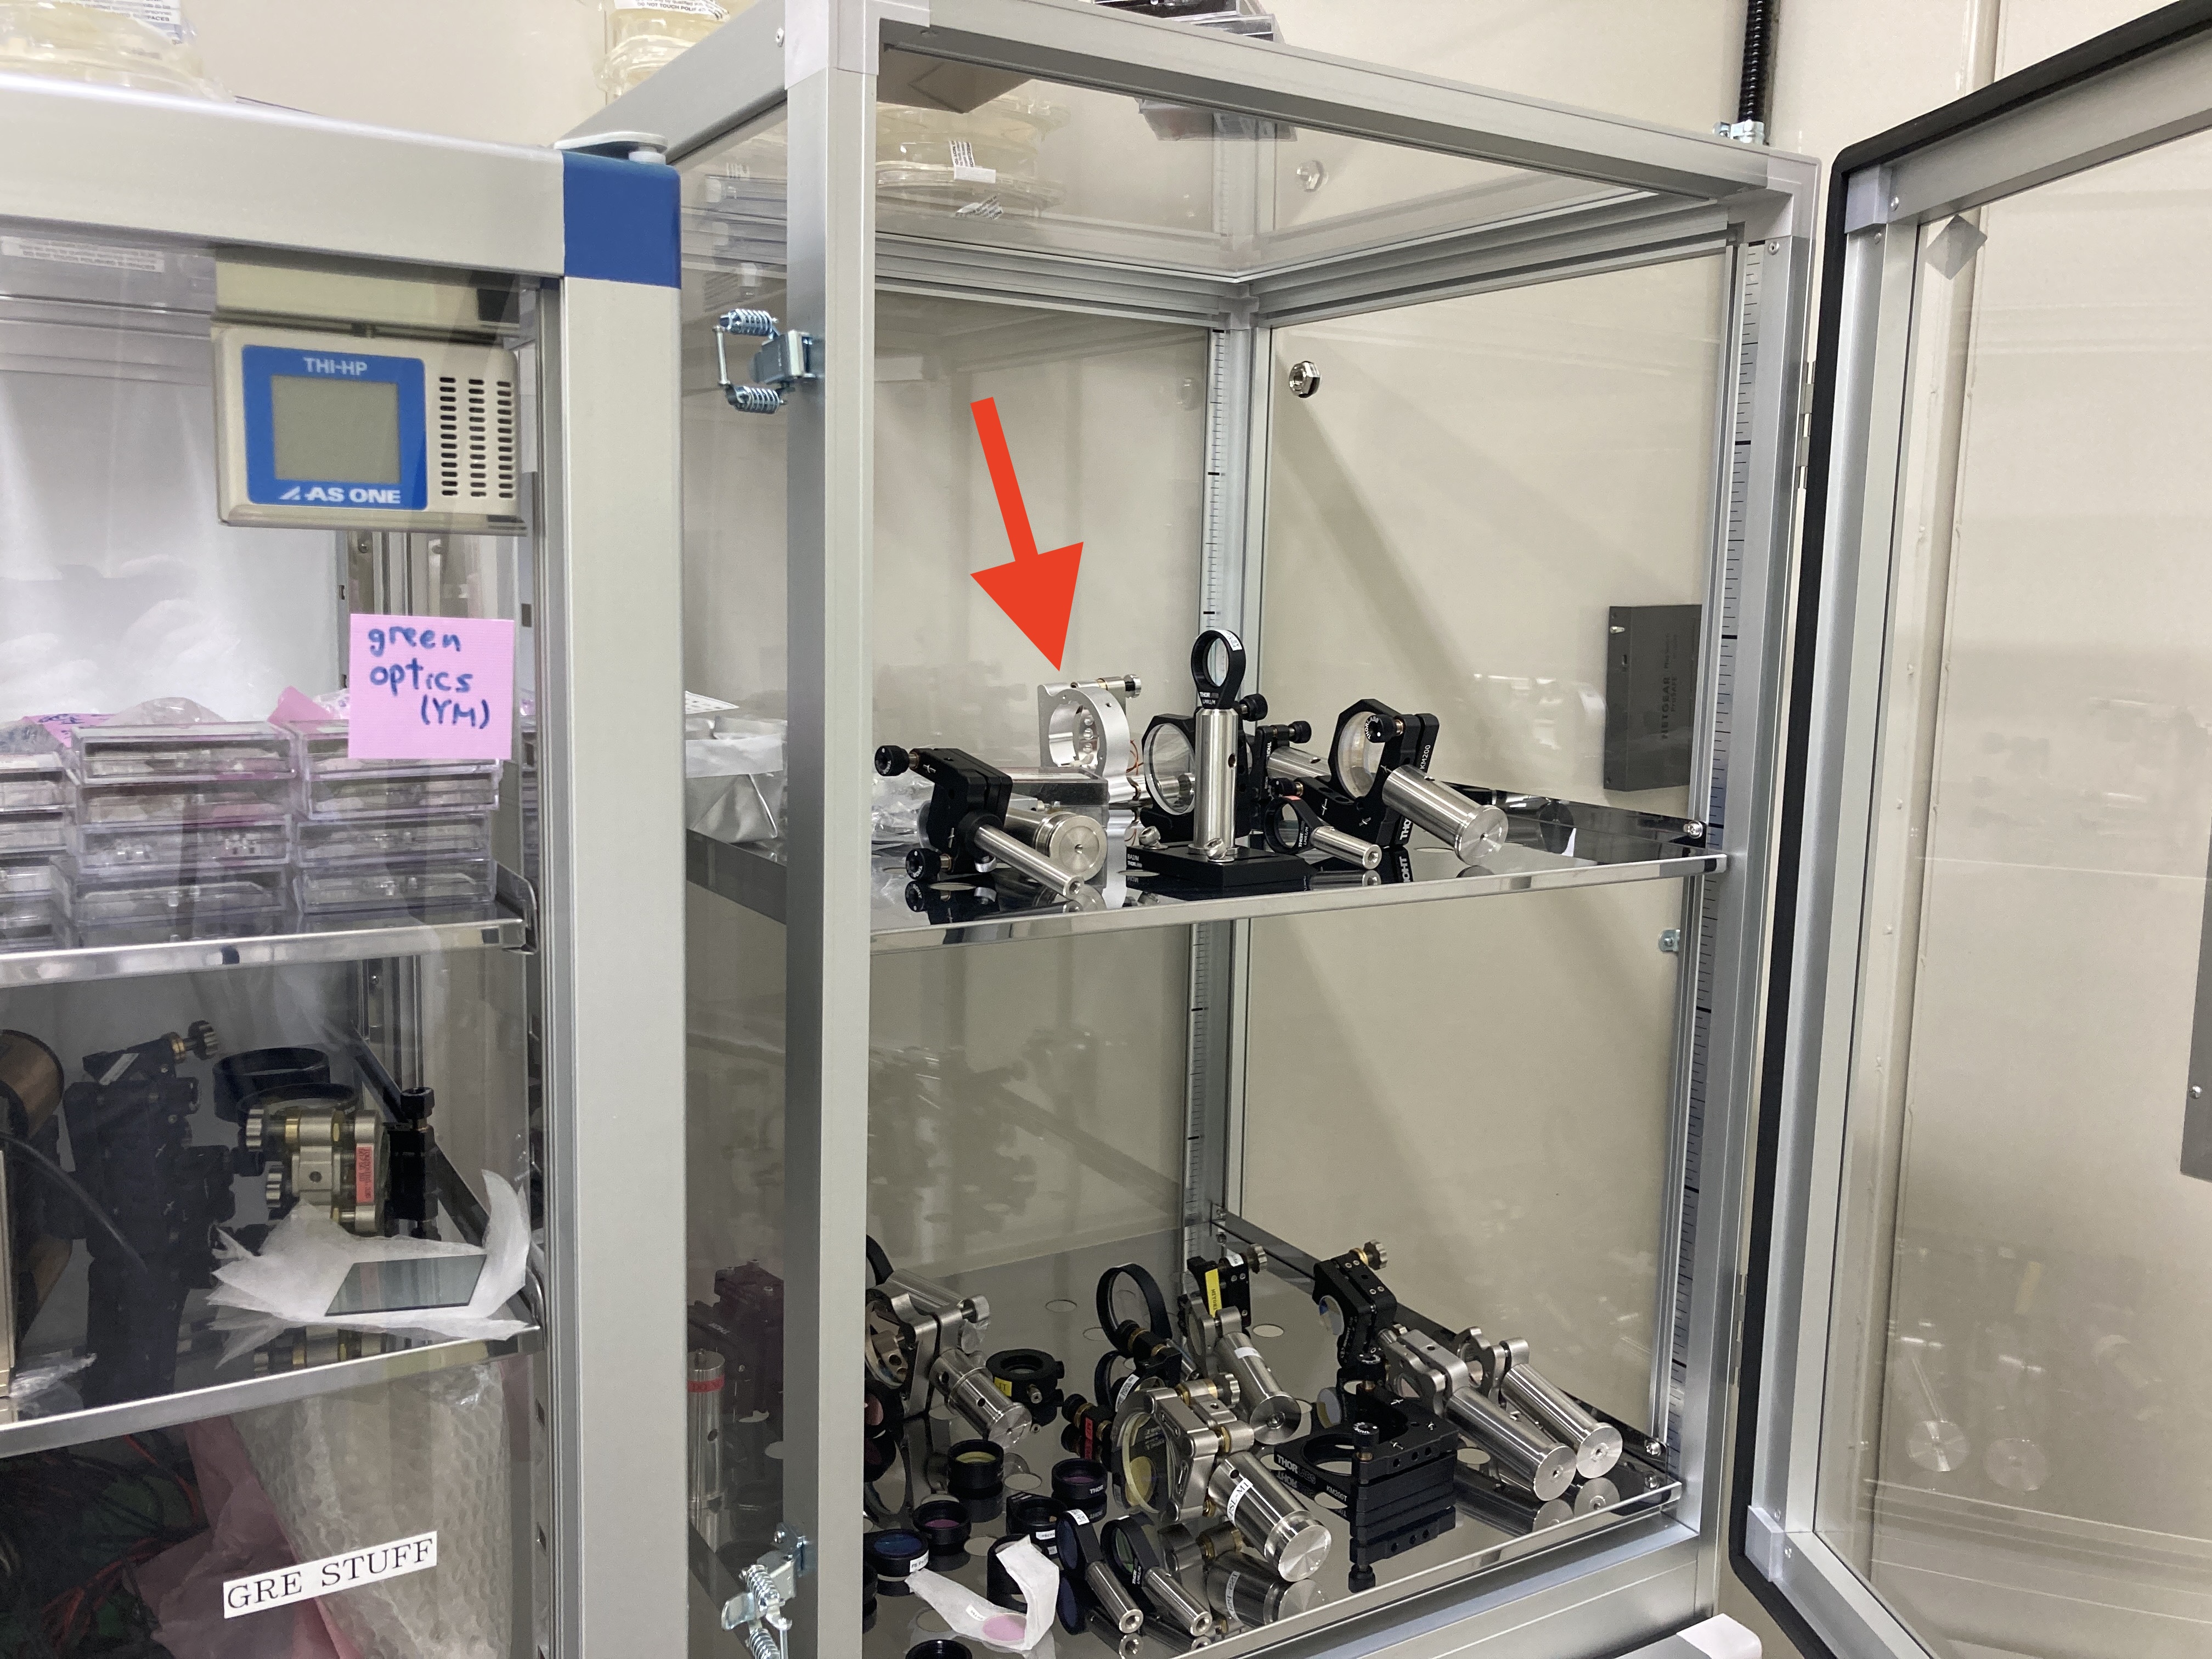
We are investigating whether the resonance of the IFI steering mirror could be the source of jitter noise around 120 Hz. In the previous measurement by Mitsuhashi et al. (link), a different type of mirror mount was used instead of the one currently in operation. This time, we plan to perform measurements using the same type of mount as in actual use.

Preparation Work (Today’s Tasks)

To conduct the measurement, we carried out the necessary preparations today:

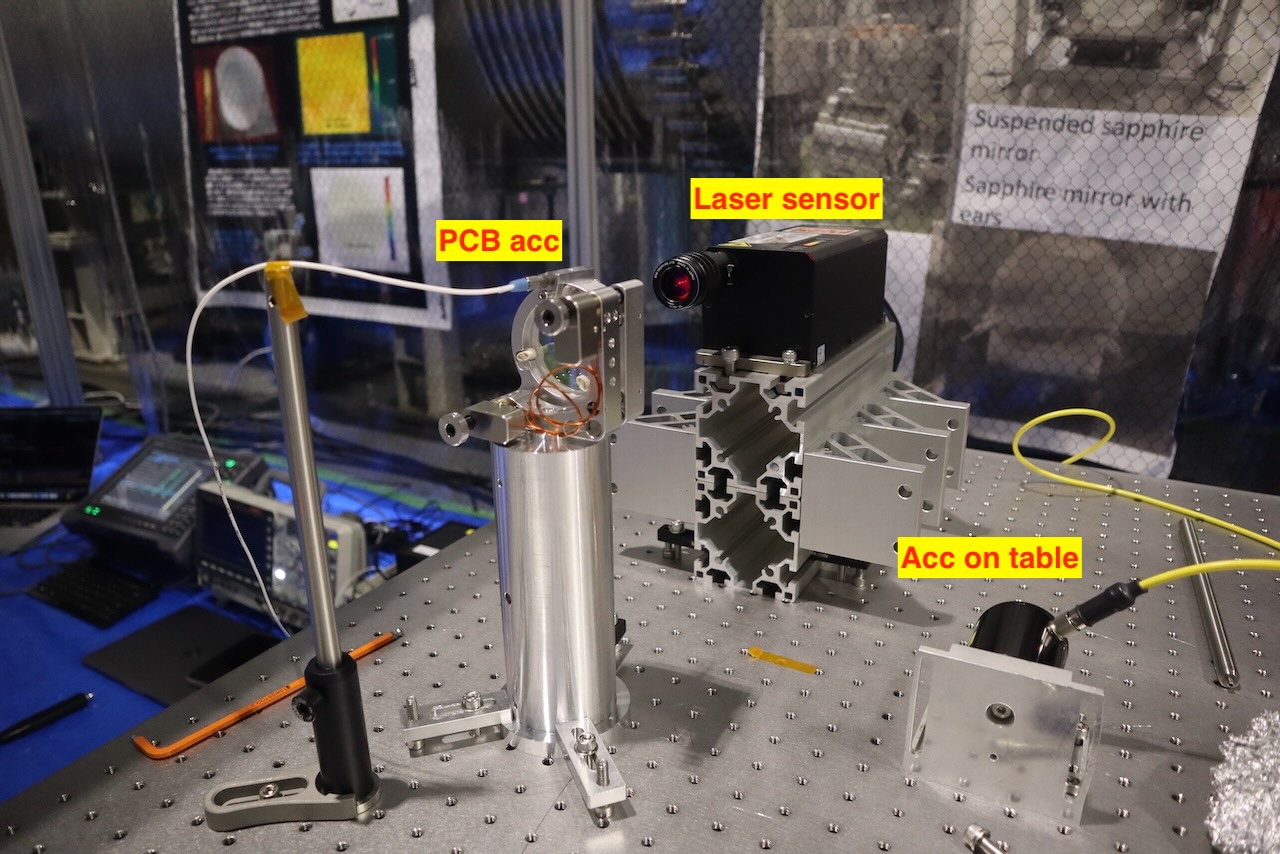
  1. Laser Displacement Meter (LV-9300A):

    • We confirmed the proper usage of the laser displacement meter at the Mozumi office.
  2. Equipment Transport:

    • All required components were transported into the underground site.
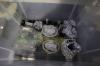
  3. Fixture Preparation & Assembly:

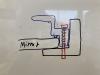
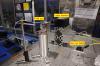
    • A fixture was prepared to secure the laser displacement meter at the appropriate height.
    • The fixture was cleaned by wiping and then assembled.
  4. Measurement Location Setup:

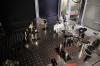
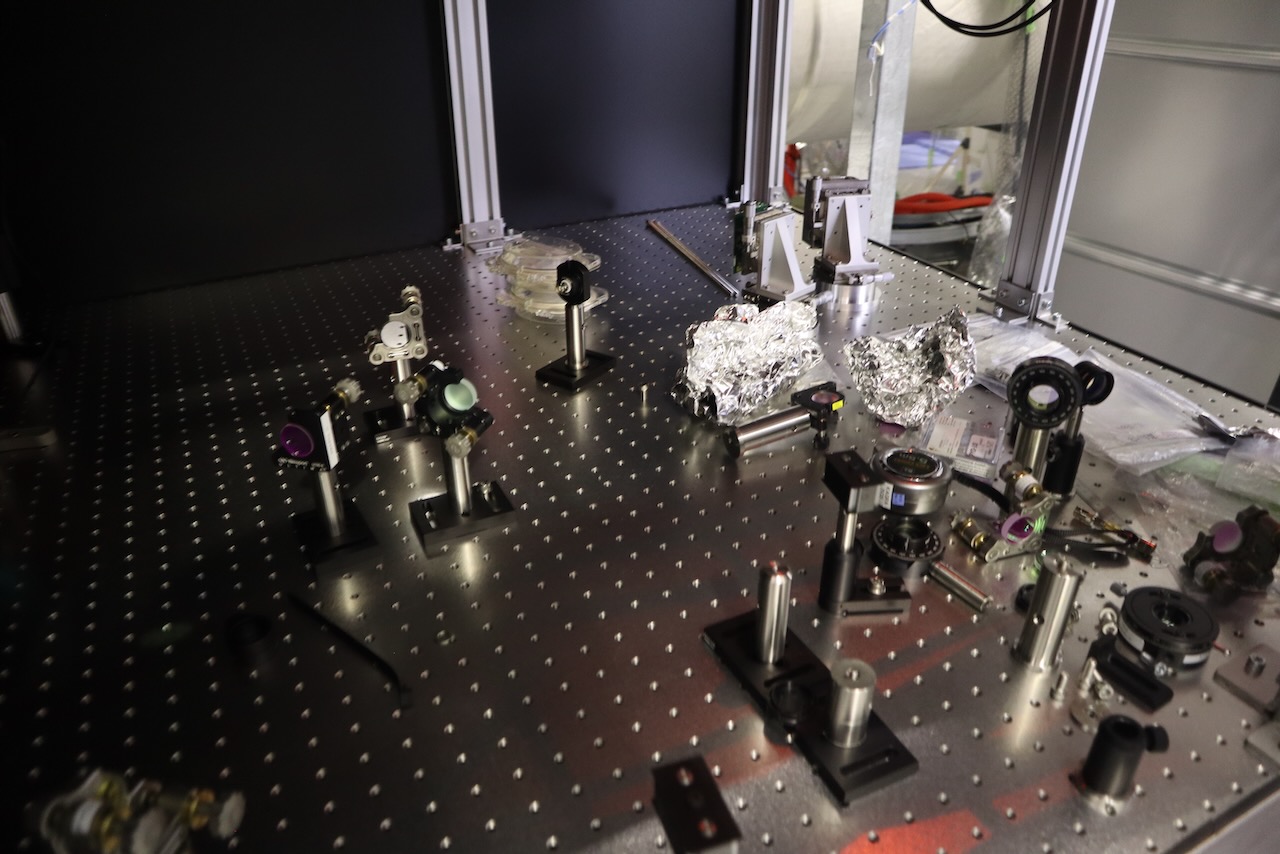
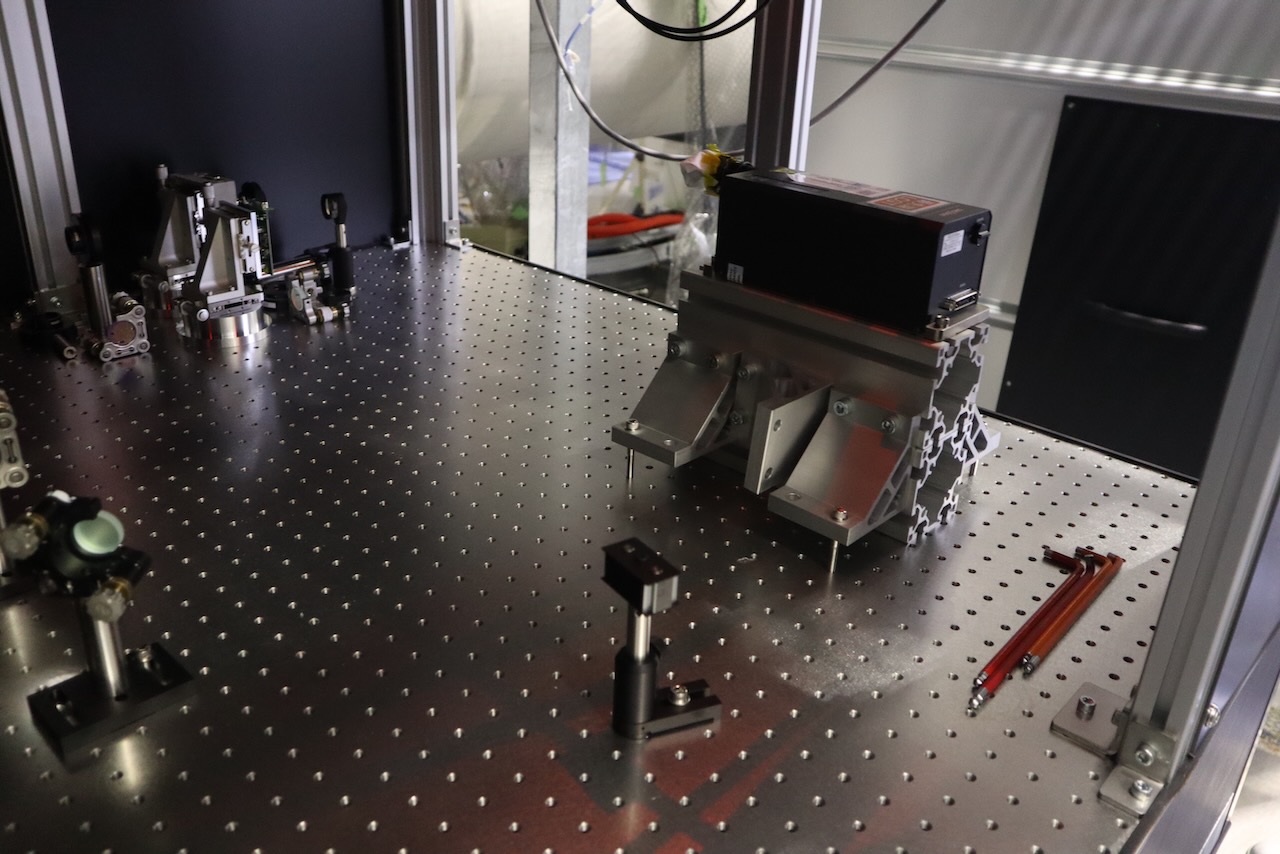
    • Due to concurrent work around the OMC, the measurement will be conducted in the available space on the POS optical table.
    • Upon checking the table, we found many screws and optical components scattered around, so we tidied up:
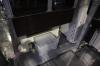
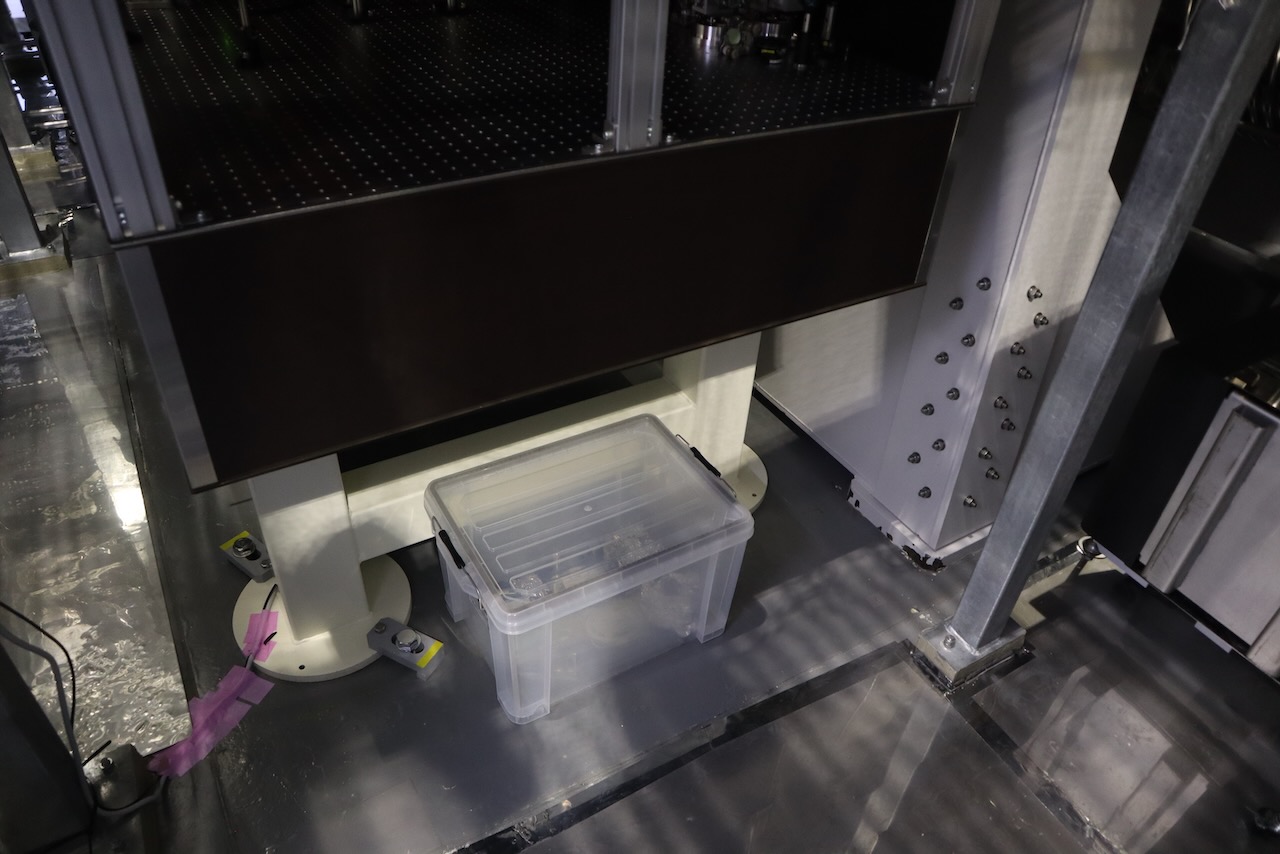
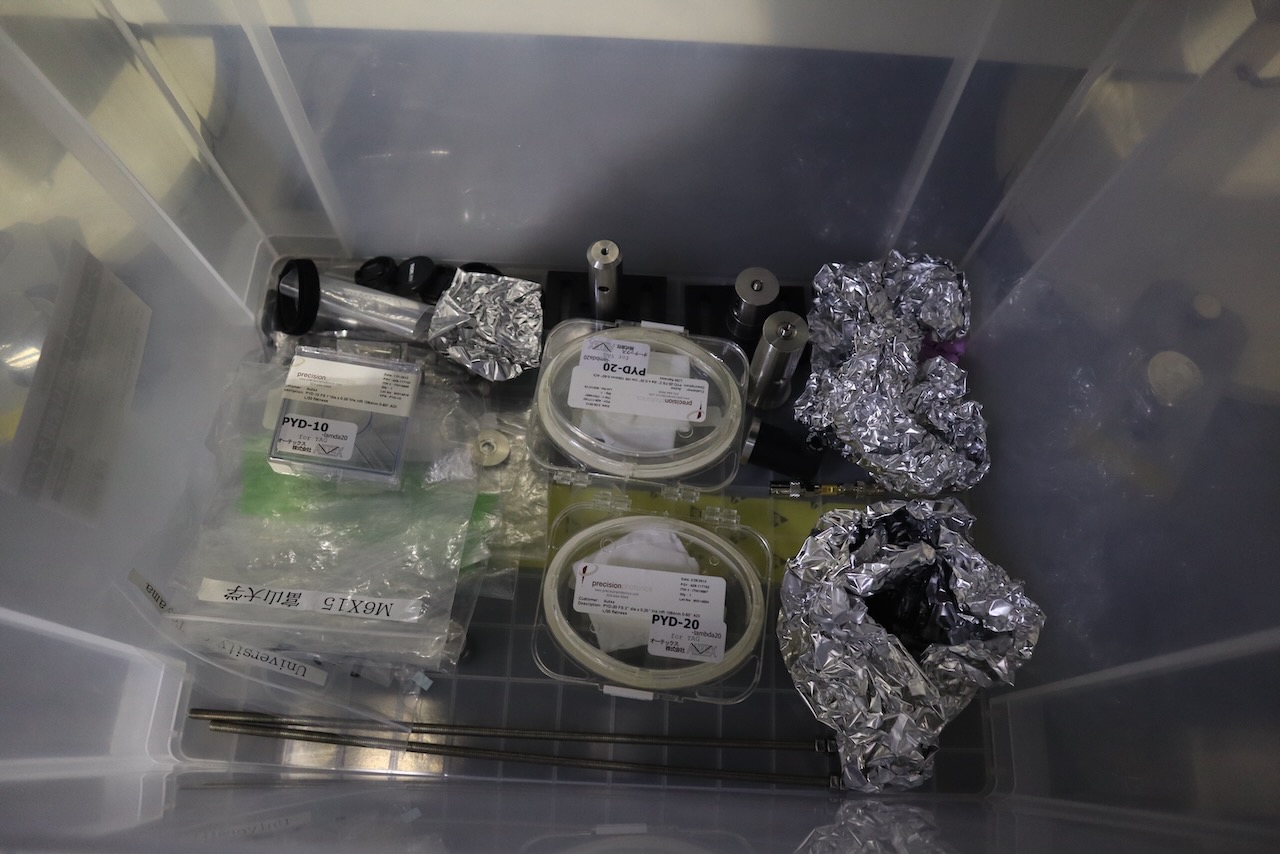
      • Items that could be safely stored in a box were placed in a box and stored under the POS table.
      • Delicate optical components were gathered at the edge of the POS table.
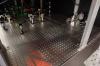
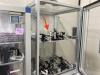
  5. Fixture and Instrument Installation:

    • The fixture for securing the laser displacement meter was installed on the optical table.
    • The laser displacement meter was then mounted onto the fixture.
  6. HEPA Filter Operation:

    • During work on the POS optical table, while the side plate was open, two HEPA filters on the upper table were switched ON.
    • After completing the work, the side plate was closed, and the HEPA filters were switched OFF.

Next Steps

Tomorrow, we will begin the actual measurement.

Images attached to this report
Comments to this report:
dan.chen - 16:45 Wednesday 26 February 2025 (32805) Print this report

With Ikeda-san

We set up the same mirror mount as the STM inside the IFI chamber and started the measurement, but no significant peak was observed around 120 Hz. Further details will be reported later.

dan.chen - 8:38 Thursday 27 February 2025 (32820) Print this report
dan.chen - 10:51 Thursday 27 February 2025 (32819) Print this report

With Ikeda-san

We examined the new mirror mount (8822-AC-UHV). It appears that there are two possible ways to secure a mirror in this mount:

  1. Using the spring-loaded pawls at the back of the mirror.
  2. Using a 5/64 screw on the side of the mount.

The spring-loaded pawls are a unique mechanism that is not commonly seen in other mounts. These components, possibly made of PEEK, press the mirror from the back. Each pawl has a small bolt, but the pawl can be lifted and rotated without turning this bolt, allowing for easy retraction when inserting the mirror.
According to the manufacturer’s webpage:
"Spring-loaded pawls gently, but securely, hold a high-precision 2-inch (50.8 mm) diameter optic from the back against three points on the front plate of the mount."
This suggests that securing the mirror solely with the pawls is also a viable option. A conceptual diagram of the pawl mechanism is attached, illustrating my interpretation of its structure.

The actual method used to fix IFI STM mirrors inside the IFI chamber is unknown. To investigate, we performed vibration measurements under different fixation methods. The mirrors used in this test were the same as those from the previous measurement.
According to klog 18501, the actual IFI STM mirror is a 2-inch mirror with a thickness of 11 mm. The thickness of the mirror used in this test has not yet been verified.

Measurement Setup

The mirror mount was attached to the POS table using a pedestal post secured in three directions. We conducted vibration measurements under four different fixation methods:

  1. Side screw + three rear pawls
  2. Side screw only
  3. Side screw + three rear pawls (with one pawl screw pushed in by ~1.3 mm to mimic the actual STM2 fixation method)
  4. Three rear pawls only (with one pawl screw pushed in by ~1.3 mm to mimic the actual STM2 fixation method)

For each fixation method, we took two types of measurements:

  • "Free" measurement (no external excitation)
  • "Shake" measurement (lightly tapping the pedestal post from the back)

We plan to conduct additional measurements with different fixation methods in the future.

Results

No significant peak near 120 Hz was observed, and no major differences were found between the different fixation methods. However, minor differences around 600 Hz may exist.
The attached graph overlays all measurement results, using the side screw + rear pawl fixation method as the reference, which is assumed to be the standard fixation method..

Pictures

Images attached to this comment
dan.chen - 17:10 Thursday 27 February 2025 (32825) Print this report

With Hido-san,

We investigated how resonance changes depending on different methods of fixing mirror.

We found that the mirrors we had been using were 12 mm thick, so we installed and measured 11 mm thick mirror as well.

As a result, no resonance was observed around 120 Hz, and probably none around 220 Hz either (details to be provided later). A significant resonance was observed at 270 Hz. Upon investigation, we suspect that this resonance may be due to the "neck" of the pedestal.

A detailed report will follow.

dan.chen - 13:38 Friday 28 February 2025 (32847) Print this report

With Hido-san

Objective

The objective of this experiment was to complete the remaining measurements from the previous day and evaluate a newly identified mirror that matches the one inside the IFI chamber. Specifically, the focus was on determining whether different fixation methods affect the resonance frequency, checking for peaks around 120Hz and 220Hz, and investigating the cause of the prominent peak observed at 270Hz.

Procedure

1. Measurements with Variations

  • Conducted measurements under different conditions:
    • With and without shaking.
    • With shaking of the laser source.
    • With the side screw released or tightened.
    • With the pawls in different configurations:
      • Released.
      • Restored to the original position.
      • Fully tightened.
      • Adjusted to simulate the IFI chamber conditions.

Results and Considerations

  • No significant changes were observed regardless of the fixation method, indicating that the 120Hz and 220Hz noise sources are likely unrelated to the mirror mounting configurations.

2. Investigation of 270Hz Resonance

  • Applied force using a wrench to assess its effect on resonance behavior.
  • Inserted a washer between the mirror holder and the mount to study its influence on resonance characteristics.
  • Attached the mirror mount on a thin post and conducted measurements.

Results and Considerations

  • The 270Hz peak remained unchanged when force was applied to the thick pedestal, and it disappeared when the mirror was mounted on a thin pole, suggesting that the source of resonance is neither the pedestal itself nor the mirror mount.
  • Introducing a washer between the mirror mount and the pedestal caused some variation in the peak, leading to the hypothesis that the neck of the pedestal might be the primary source of the 270Hz resonance.

3. Testing Different Mirror Mount Configurations

  • Initially, measurements were conducted using a 12mm mirror.
  • Later, an 11mm mirror(link), identical to the one inside the IFI chamber, was found and tested under the same conditions.
  • The PYD-20 mirror was examined but not measured due to its significantly different thickness.
  • Adjusted the mirror’s positioning to simulate IFI chamber conditions.

4. Thickness Measurements

  • Measured the thickness of the 12mm and 11mm mirrors.
  • The PYD-20 mirror was inspected but not measured.

Conclusion

The various configurations and shaking tests were performed to assess the mechanical stability and potential contributions to noise. The analysis of the collected data showed no peaks around 120Hz and 220Hz. The prominent peak observed at 270Hz is likely due to the resonance of the pedestal’s neck region.

Legend for Attached Graphs

  • "Back: locked(+1.9mm)": Indicates that the back pawls' screws were adjusted to protrude 1.9mm from the front.
  • "Back: locked(only one pawl)": Denotes a condition where only one of the three back pawls was locked while the other two were released, meaning the mirror was held in a very loose state.
Images attached to this comment
dan.chen - 13:40 Friday 28 February 2025 (32848) Print this report

As there are too many graphs, I picked up the data in the case of 11mm thickness mirror and related graphs.

Images attached to this comment
dan.chen - 13:50 Friday 28 February 2025 (32849) Print this report
dan.chen - 6:10 Saturday 01 March 2025 (32857) Print this report

Slides used in a commissioning meeting for this topic: JGW-T2516543

dan.chen - 17:44 Monday 03 March 2025 (32879) Print this report

With Kenta Tanaka

We first attempted to reproduce the same conditions as last week and conducted measurements. As a result, a peak appeared at 120 Hz. The cause of this peak is unknown, but it persisted even after changing the mirror mounting method. Electrical noise is also a possible factor.

To investigate further, we inserted a small optical breadboard plate (MB1515/M) under the pedestal. We then placed the pedestal at the edge of the plate and performed measurements. A broad peak noise around 120 Hz was observed, which varied depending on the mounting method (using two clamps) and the amount of overhang.

In the final measurement, we kept the clamping method as consistent as possible and only varied the overhang. As a result, the peak frequency changed.

Graphs:

  • First graph: The 120 Hz peak observed under the same conditions as last week, without the plate.
  • Second graph: The difference in the final measurement results. A comparison between cases where the overhang was 4.6 mm and 6.3 mm.

Detailed data will be reported later.
The POS table has been neatly cleaned up. All measurement equipment, mounts, and so on have been brought back to the office, making it possible to conduct additional tests at Toyama University or other locations if needed.

Images attached to this comment
dan.chen - 7:38 Tuesday 04 March 2025 (32883) Print this report

With Kenta Tanaka

Report Summary

Measurements Conducted

  1. Reproduction of Last Week's Conditions

    • Measurements were conducted under the same conditions as last week.
    • Differences from last week were observed, so measurements were taken while varying the mirror mounting method.
  2. Edge Placement Measurement

    • A plate (MB1515/M) was inserted, and the pedestal was placed at the edge of the plate for measurement.
  3. Effect of the Number of Clamps

    • Changes were observed depending on the number of clamps, so comparative measurements were conducted at the center of the plate.
  4. Effect of Overhang

    • Finally, the clamping method was kept as consistent as possible, and the effect of overhang was examined.

(All graphs below represent free vibration measurements without external excitation.)


Comparison with Last Week (Fig 1)

Results & Considerations

  • Overall, the noise level was higher compared to last week.
  • Peaks around 120 Hz were observed. The cause is unknown, but electrical interference is a possible factor.

Edge Effect (Fig 2)

Results & Considerations

  • When the pedestal was placed at the edge of the MB1515/M plate with some overhang, a resonance peak appeared around 150 Hz.
  • Since the clamping direction changed each time the pedestal position was adjusted, both edge effects and clamping effects are likely present.

Effect of the Number of Clamps (Fig 3)

Results & Considerations

  • The measurements were conducted at the center of the MB1515/M plate while varying the number of clamps.
  • The results indicate an effect due to the number of clamps, particularly around 150 Hz.
  • This differs from the results mentioned in klog32293, where no significant effect from the number of clamps was observed.

Overhang Effect (Fig 4)

Results & Considerations

  • When the pedestal was overhanging from the MB1515/M plate, a slightly broad resonance appeared around 120 Hz.
  • The resonance frequency shifted as the overhang amount was varied.
  • A larger overhang resulted in a shift toward higher frequencies.

Pictures: link

Images attached to this comment
dan.chen - 8:10 Tuesday 04 March 2025 (32884) Print this report

Additional results.

Shake (Tapping) Test on the Overhanging Section

  • Further testing was conducted by tapping the overhanging section.

Results & Considerations

  • The tapping was applied specifically to the overhanging section.
  • Peaks around 150 Hz and 400 Hz were excited, suggesting the presence of vibration modes related to the overhanging section(?).
  • (We could not excited the narrow prak at 120Hz by tapping even without the plate.)
Images attached to this comment
dan.chen - 17:26 Monday 10 March 2025 (32938) Print this report

With Piernicola-san,

We have continued measurements using the same mount as the IFI STM.

Sensor Noise Measurement

First, we attempted to measure sensor noise. The target was a suspended mirror (25 cm). While we were able to perform the measurement, a comparison with the spectrum of a fixed mirror revealed that the low-frequency noise was larger in the suspended case. Additionally, a slight bump was observed around 120 Hz.

Reference Measurement of the Mirror and Mount

Next, for reference, we conducted measurements of an actual mirror and its mount under the condition that appeared to provide the most stable fixation. Compared to the previous measurement, the low-frequency region was quieter, and a peak was observed around 250 Hz.

Note

This time, we used 1um/V range instead of 0.1um/V range which we used before. This is because we needed larger range for the suspended mirror measurement.
We will continue this measurement tomorrow. The top priority for tomorrow is to reconfirm the impact when placing a pedestal on the edge and to verify the effectiveness of the proposed countermeasures.

Images attached to this comment
dan.chen - 8:31 Tuesday 11 March 2025 (32946) Print this report

With Piernicola-san,

Detailed report for the measurement yesterday.

Experimental Setup

The experiment was conducted using a laser holder system fixed to an optical table. Due to incompatibility between the M6 screws and the optical plate, structural modifications were made to secure the laser holder. Additionally, a suspended mirror system was used as a measurement target. The mirror was an aluminum plate with a diameter of 45 mm and a thickness of 5 mm, left unpolished. The suspension length was approximately 24 cm.

We mainly used 1 μm/V for the sensing sensitivity because the motion of the suspended mirror was large, causing the sensor range to be exceeded at 0.1 μm/V.

After the suspended mirror measurements, we shifted the target to the 8822-AC-UHV mirror holder. We measured it with 3 clamps and 2 clamps to have comparison.

Results

Suspended Mirror Measurements

The suspended mirror measurement itself was possible at 1 μm/V sensor sensitivity. This measurement was assumed to be a sensor noise measurement. A peak was observed at 115 Hz. Efforts to identify the mode of this peak were inconclusive, and the exact cause remains unknown. While it is suspected to be influenced by the fixation method of the laser to the laser holder, no definitive conclusion could be drawn from the measurements. The addition of a screw in front of the laser did not significantly change the noise behavior.

Comparison Between Suspended Mirror and 8822-AC-UHV

We compared the noise of the suspended mirror system with the 8822-AC-UHV system. The mirror mount showed lower noise levels in the low-frequency range but exhibited additional peaks at 260, 280, and 300 Hz, which were consistent with previous measurements. The cause of the low-frequency discrepancy remains unknown but may be attributed to common mode reduction effects, sensor noise, or damping magnet influence.

Effect of Clamp Configuration

A comparison was made between using two clamps and three clamps for pedestal fixation. When the number of clamps was reduced from three to two, the peaks around 280 Hz disappeared, and a new peak emerged at 155 Hz. Additionally, noise around 115 Hz showed a decrease.

More pictures: link

Images attached to this comment
dan.chen - 15:58 Tuesday 11 March 2025 (32961) Print this report

With Piernicola-san,

What We Did

  • Measured noise with a well-fixed pedestal at the center of the plate (fixed with 3 clamps).
  • Moved the pedestal to the edge, gradually increasing the overhang length, while keeping it fixed with 3 clamps:
    • 0mm (fully on the plate)4mm6.1mm9.8mm (maximum overhang).
    • No significant noise change observed, likely due to the stable 3-clamp fixation.
  • Changed the clamp configuration:
    • 2 clamps at 9.8mm overhang → The maximum peak shifted from ~220Hz to ~160Hz.
    • 2 clamps at 5.9mm overhang180Hz peak shifted slightly higher.
    • 4 clamps at 5.9mm overhangPeak shifted to 253Hz, indicating increased rigidity.
  • Returned the pedestal to the center (34mm from the edge) and tested the effect of screw torque:
    • 30cNm showed some noticeable change, suggesting a threshold around 1Nm.
    • Measured at 14cNm, 30cNm, 2Nm, 3Nm.

Next Steps

  • Adjust clamp screw height to mimic IFI chamber conditions.
  • Change clamp angles to target 120Hz.
  • Investigate the hugging-type clamp.
dan.chen - 7:57 Wednesday 12 March 2025 (32968) Print this report

Graphycal results.

Attached graphs

  • Pedestal position
  • Clamp number with 9.8mm overhang
  • Clamp number with 6mm overhang
  • Torque dependance

Discussion

  • Even when changing the overhang of the pedestal, there is no variation as long as it is secured with three clamps. The reason why the peak frequency shifted when moving from the center of the plate to the edge is unknown. (The clamps were re-tightened to move the pedestal to the edge.)
  • The peak frequency changes depending on the number of clamps. Reducing the number of clamps tends to shift the frequency to lower values. It was also confirmed that adding clamps can restore the frequency.
  • The torque applied to the screws fixing the mirror mount to the pedestal affects the peak frequency. The threshold is likely around 1 Nm.

Pictures: link

Images attached to this comment
dan.chen - 17:40 Wednesday 12 March 2025 (32972) Print this report

With Piernicola-san

Objective

Investigate the impact of clamp configurations and enclosing holders on mirror mount vibrations.

Experimental Summary

  1. Clamp Tilting

    • Tested effects of tilting two clamps by adjusting screw heights (from no tilt = 10mm to 6.35mm/5.70mm, then to 0mm).
    • No significant change observed in vibration spectrum.
  2. Clamp Angle Dependence

    • Measured with different angles (180°, 90°, 60°) to examine resonance shift.
    • Found that narrower angles lowered the resonance frequency (~50Hz shift).
    • While torque was sufficient, indicating angle alone affects frequency.
  3. Enclosing Holder Effects

    • Installed at different heights (80mm, 153.7mm) and measured impact.
    • The spectral changes around 300Hz, but no significant improvement.
    • Removing bottom clamps left only enclosing holders securing the pedestal, leading to instability.
    • In the 2-clamp case, enclosing holders introduced disturbances around 400Hz.
    • A single enclosing holder on the pedestal leg was insufficient; additional screws may improve performance (Virgo doc).

Key Findings

  • Clamp Tilting: No effect on vibration.
  • Clamp Angle: Alters resonance frequency (~50Hz shift).
  • Enclosing Holders: Minor changes observed, but they do not improve stability and may introduce unwanted effects.

Next Steps

  • Investigate vibration measurement in the IFI chamber.
    • Consider using PCB 352c68 accelerometer with proper power supply for the measurement of the real STM in the chamber.
    • Test the method with the current in-air setup.
Images attached to this comment
dan.chen - 7:53 Thursday 13 March 2025 (32976) Print this report

Pictures on 3/12: link

dan.chen - 16:43 Thursday 13 March 2025 (32988) Print this report

With Onishi-san and Piernicola-san,

We performed 3 kinds of measurement for the mirror mount.
The main target today was to figure out how we can measure the vibration of the real IFI STM.
One candidate it using a very small accelerometer (pcb 352c68 ~ 4mm phi * 10mm length) attaching on the mirror mount.

IFI STM Experiment Summary

1. Effect of Clamp Number on Noise

  • Test: Compared noise levels using 3 clamps vs. 7 clamps.
  • Result: Minor improvement around 300 Hz, but 3 well-placed clamps were sufficient.

2. Small Accelerometer Test

  • Test: Installed PCB 352C68 accelerometer on mirror mount to confirm that its installation does not significantly affect the resonance frequency.
  • Result: Peak frequency shifted by 10 Hz, no other significant impact was observed.

3. Transfer Function (TF) Measurements

  • Test: Measured TF from table accelerometer to laser sensor and small accelerometer attached on the mirror mount, relocating it to different positions to determine the optimal placement for installation.
  • Result: Small accelerometer can be attached to mirror mount with minimal impact on resonance frequency, making it viable for STM measurements. We could see the resonant frequency with/without shaking.

Care must be taken to avoid altering the alignment when attaching the small accelerometer to the mirror mount.
(I will report the measurement result and picture later...)

dan.chen - 6:23 Friday 14 March 2025 (32992) Print this report

Vibration noise with more clamps: Fig 001

  • There are some improvements around 300Hz a little.

Vibration noise with attaching the small acc (PCB 352c68) on the mirror mount: Fig 002

  • There are peak shifts by ~20Hz caused by the attaching acc on the mirror mount.
  • The PCB acc could sense the peaks without any tapping.

TF Measurements

  • The measurement system: Fig 003
    • Measured TF from "Acc on table (ch1)" to "Laser sensor (ch2)" and from "Acc on table (ch1)" to "PCB acc (ch3)".
  • PCB acc at top of the mirror: Fig 004
  • PCB acc at side of the mirror: Fig 005
  • PCB acc at pico of the mirror: Fig 006

Comment

  • The side case was most rigid.
  • If the PCB acc holder is thin enough, the attaching risk should be small.

More pictures: link

Images attached to this comment
dan.chen - 7:50 Tuesday 25 March 2025 (33083) Print this report

Yesterday(3/24), we placed the mirror mount (8822-AC-UHV) used in this test into a desiccator in the PSL room for storage.

Images attached to this comment
dan.chen - 17:18 Tuesday 25 March 2025 (33097) Print this report

With Washimi-san, Yokozawa-san, Ushiba-san, Uchiyama-san

Background
There is a possibility that STM1 and STM2 inside the IFI chamber are sources of noise around 120 Hz and 220 Hz.
Since the actual IFI chamber was opened, we performed measurements before adding clamps.
Laser displacement sensor was used to measure resonances by directing laser beams onto the STM1 and STM2 mirrors.
Preliminary test measurements conducted outside the vacuum chamber are documented here.

Measurement Procedure
In all cases, the laser beam was aimed at the mirror surface, and the reflected signal was used for measurements.
Although STM2 has a damper between the mirror and the sensor, we assume that the reflection from the mirror dominates the signal.
We compared three conditions:

  1. A quiet state with no external excitation
  2. Tapping the optical table of the IFI chamber by hand
  3. Excitation using a shaker installed on the optical table, sweeping specific frequency bands

Results

  • For STM1, no prominent peaks were observed around 120 Hz or 220 Hz.
  • For STM2, however, a clear peak was observed at approximately 220 Hz.
  • The attached figure shows the data taken during the shaker excitation.
    (Detailed plots and further analysis will be reported separately.)
Images attached to this comment
dan.chen - 6:38 Wednesday 26 March 2025 (33102) Print this report

Detailed Analysis

STM1(fig 001 and 002)

Discussion:

  • Vibrations due to the tripod also appeared at a few hundred Hz, indicating that excitation of the target (STMs) is necessary.
  • No clear peaks were observed either with hand excitation of the IFI table or with shaker excitation in specific frequency bands, suggesting that no resonance was excited by these methods.

STM2 (fig 003 and 004)

Discussion:

  • A slight excitation was observed at 128 Hz, which might be related to the 128 Hz noise seen in the interferometer.
  • A strong excitation was observed around 220 Hz, which is probably connected to the 220 Hz noise in the interferometer.
  • Another large excitation was seen at 286 Hz. We need to check whether there is noise around this frequency.

Pictures: link

Images attached to this comment
Search Help
×

Warning

×