After the success of PRFPMI DC readout with low bandwidth PRMI controls (klog27839), I tried to identify ETMX violin mode peaks.
First, I measured the spectra of DARM IN1 for the reference and measured spectra with several conditions:
1. White noise injection from TM_TEST_L_EXC with 100 cnts from 165 Hz to 195 Hz.
2. White noise injection from TM_TEST_L_EXC with 1000 cnts from 165 Hz to 195 Hz.
3. Just after turnng off white noise injection with 1000 cnts from 165 Hz to 195 Hz.
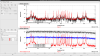
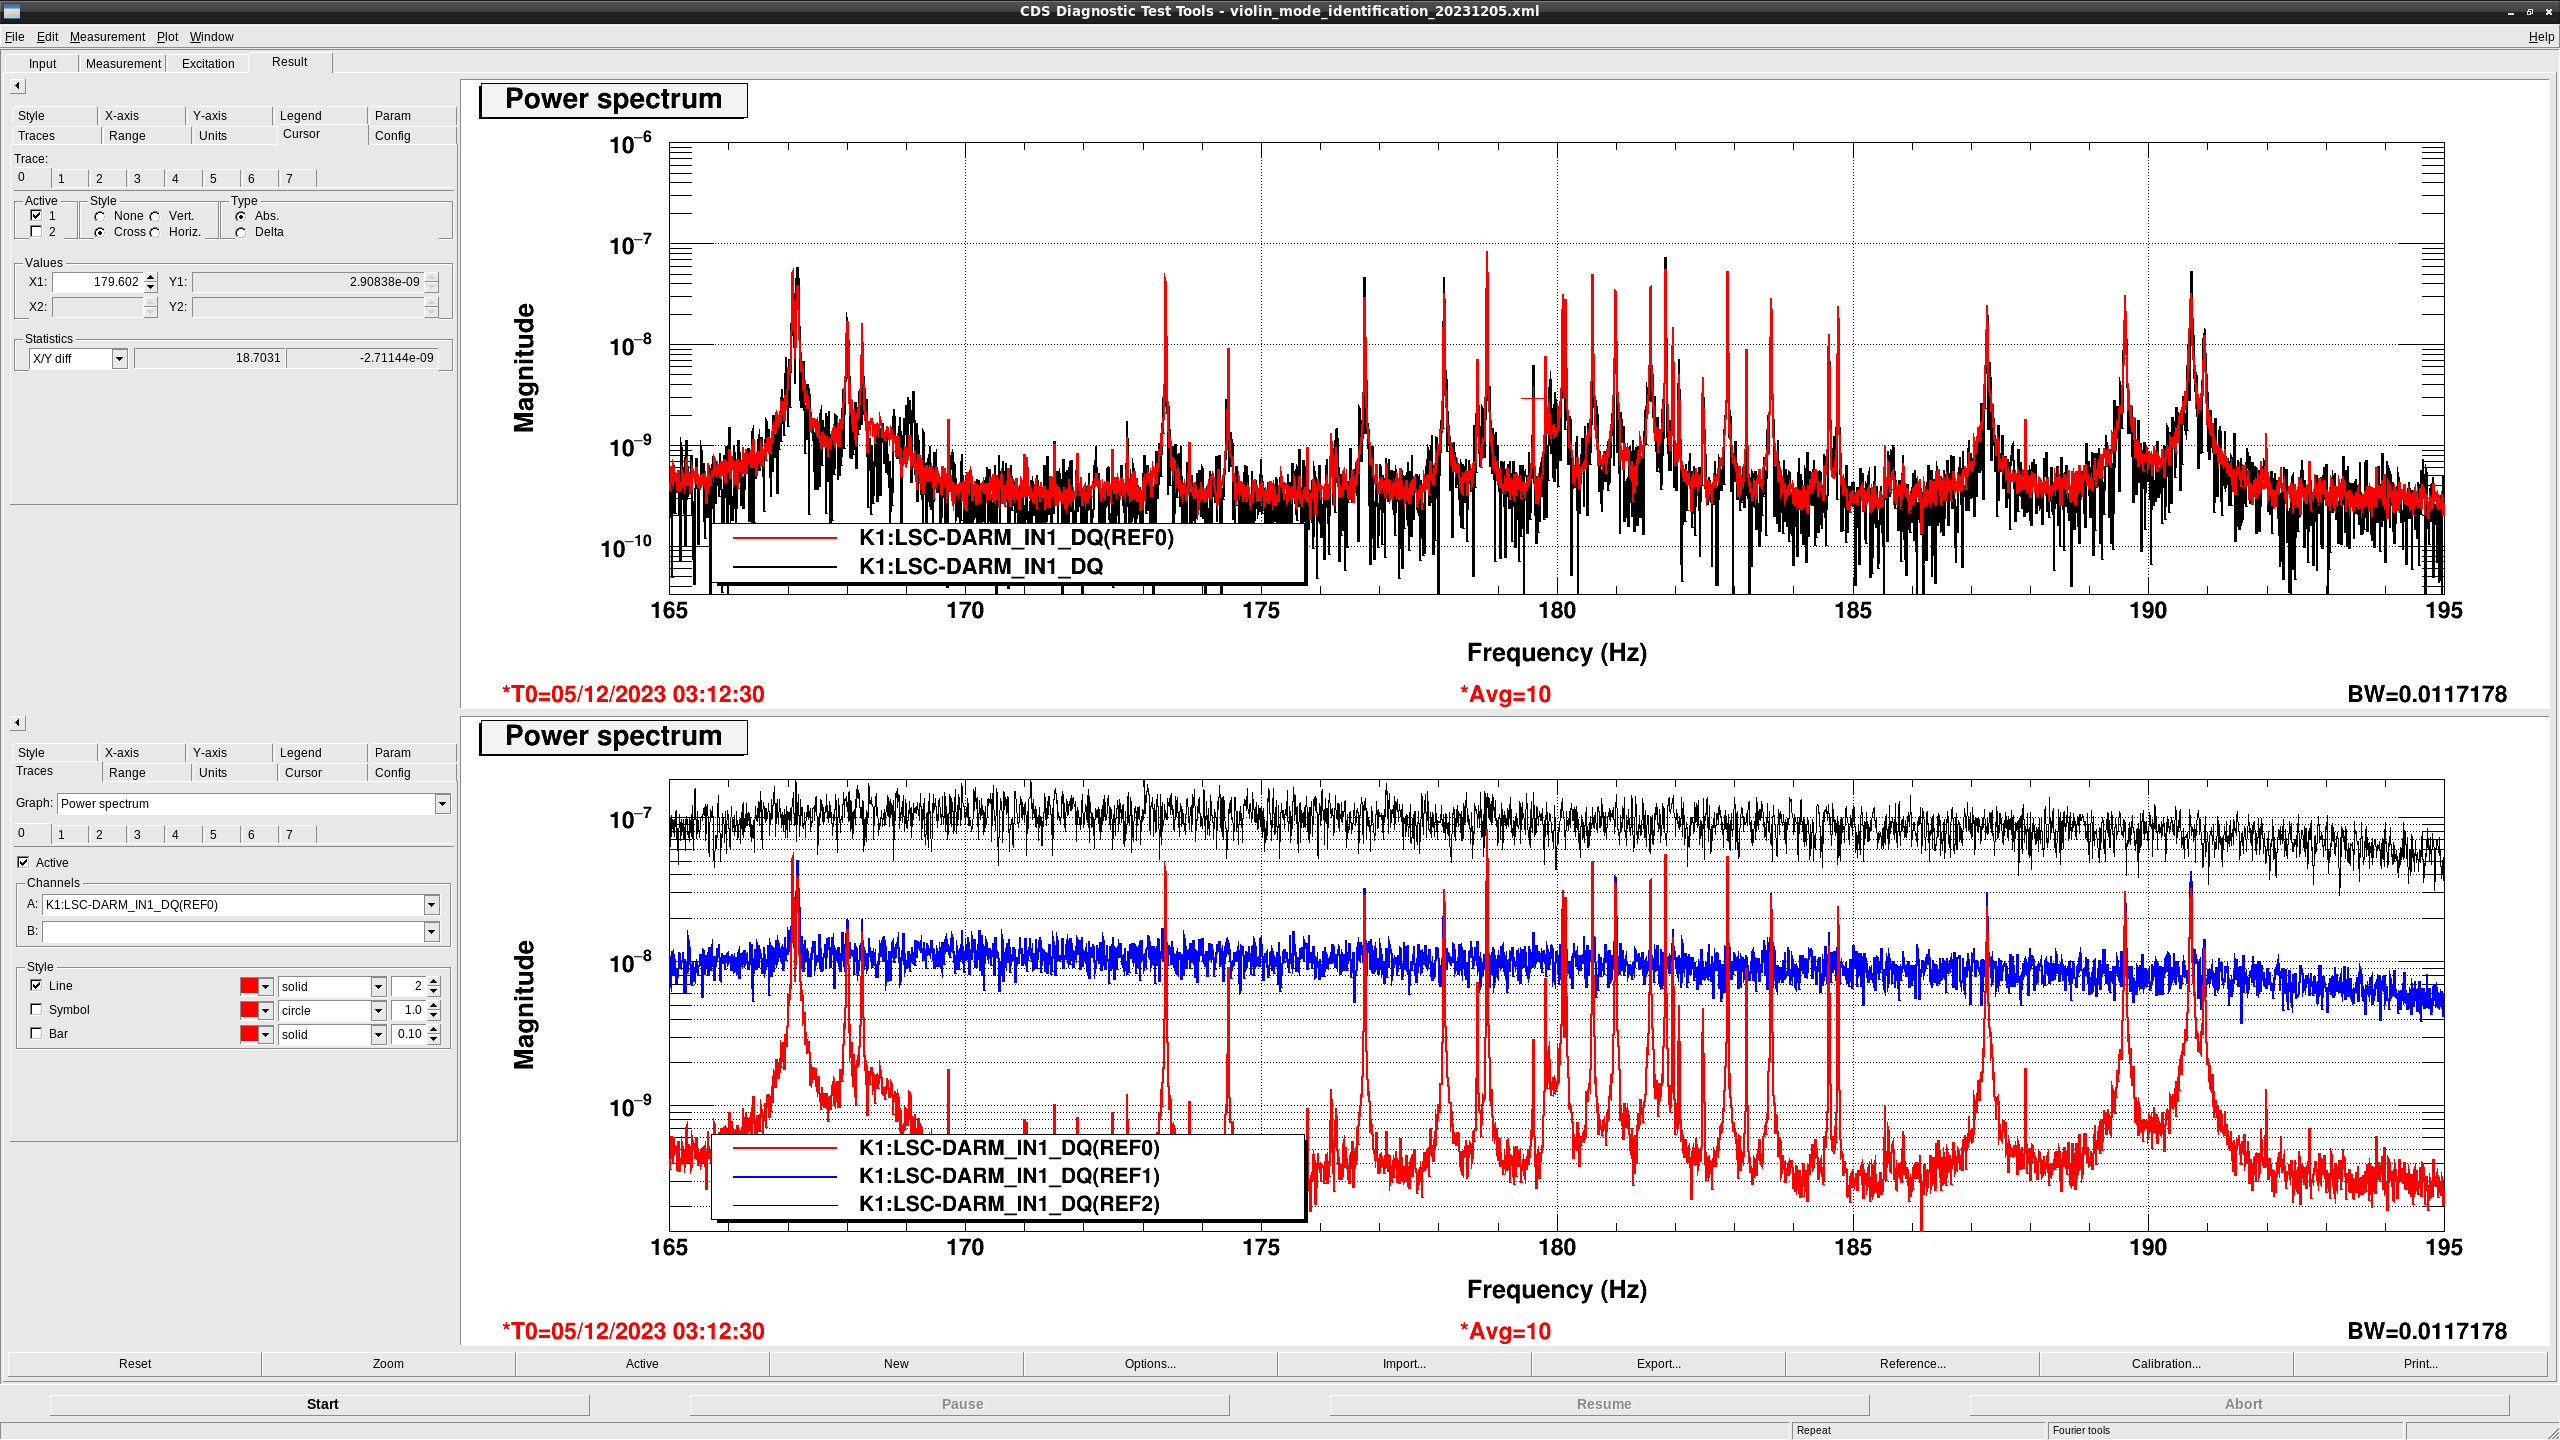
Figure 1 shows the spectra of DARM IN1 with the above condition.
REF0 is the reference without excitations.
REF2 and REF3 represent the spectra during white noise injection with 100 and 1000 cnts, respecively.
Raw data is the spectrum with the condition 3.
With 100 cnts excitation, many peaks excited thermally can be seen in the spectrum and it is hard to identify which peaks are coming from ETMX.
In addition, though I had been exciting for more than 10 mins, there were no peaks with 1000 cnts excitation, which implies that TM longitudinal excitation cannot be excited violin mode effectively.
However, we could see slight enhancement of some of peak heights just after stopping excitations while some were decreased, so it might be a good way to find the peaks after turning off the ecitation.
Followings are the peak frequencies, which enhanced by ETMX excitations.
| 1 | 2 | 3 | 4 | 5 | 6 |
| 167.17Hz | 176.75Hz | 178.09Hz | 179.60Hz | 181.84Hz | 190.72Hz |
I will prepare the diaggui templates and automeasurement scripts for the other suspensions.