I'm performing the statistical evaluation of silent run. In this thread, I will post the result.
- date of silent run
- start : 2022/12/28 9:18 UTC = 18:18 JST, gps = 1356254298
- related klog klog#24317
- end : 2023/01/03 7:00 UTC = 16:00 JST, gps = 1356764418
- start : 2022/12/28 9:18 UTC = 18:18 JST, gps = 1356254298
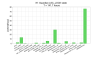
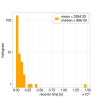
- duty cycle
- 54% = 275878 s / 510120 s
- total run time : 510120 s
- livetime of K1:GRD-LSC_LOCK_STATE_N == 10000 : 275878 s
- number of lock segment, that is, how many times K1:GRD-LSC_LOCK_STATE_N == 10000 from DOWN state.
- 913
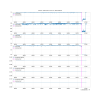
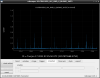
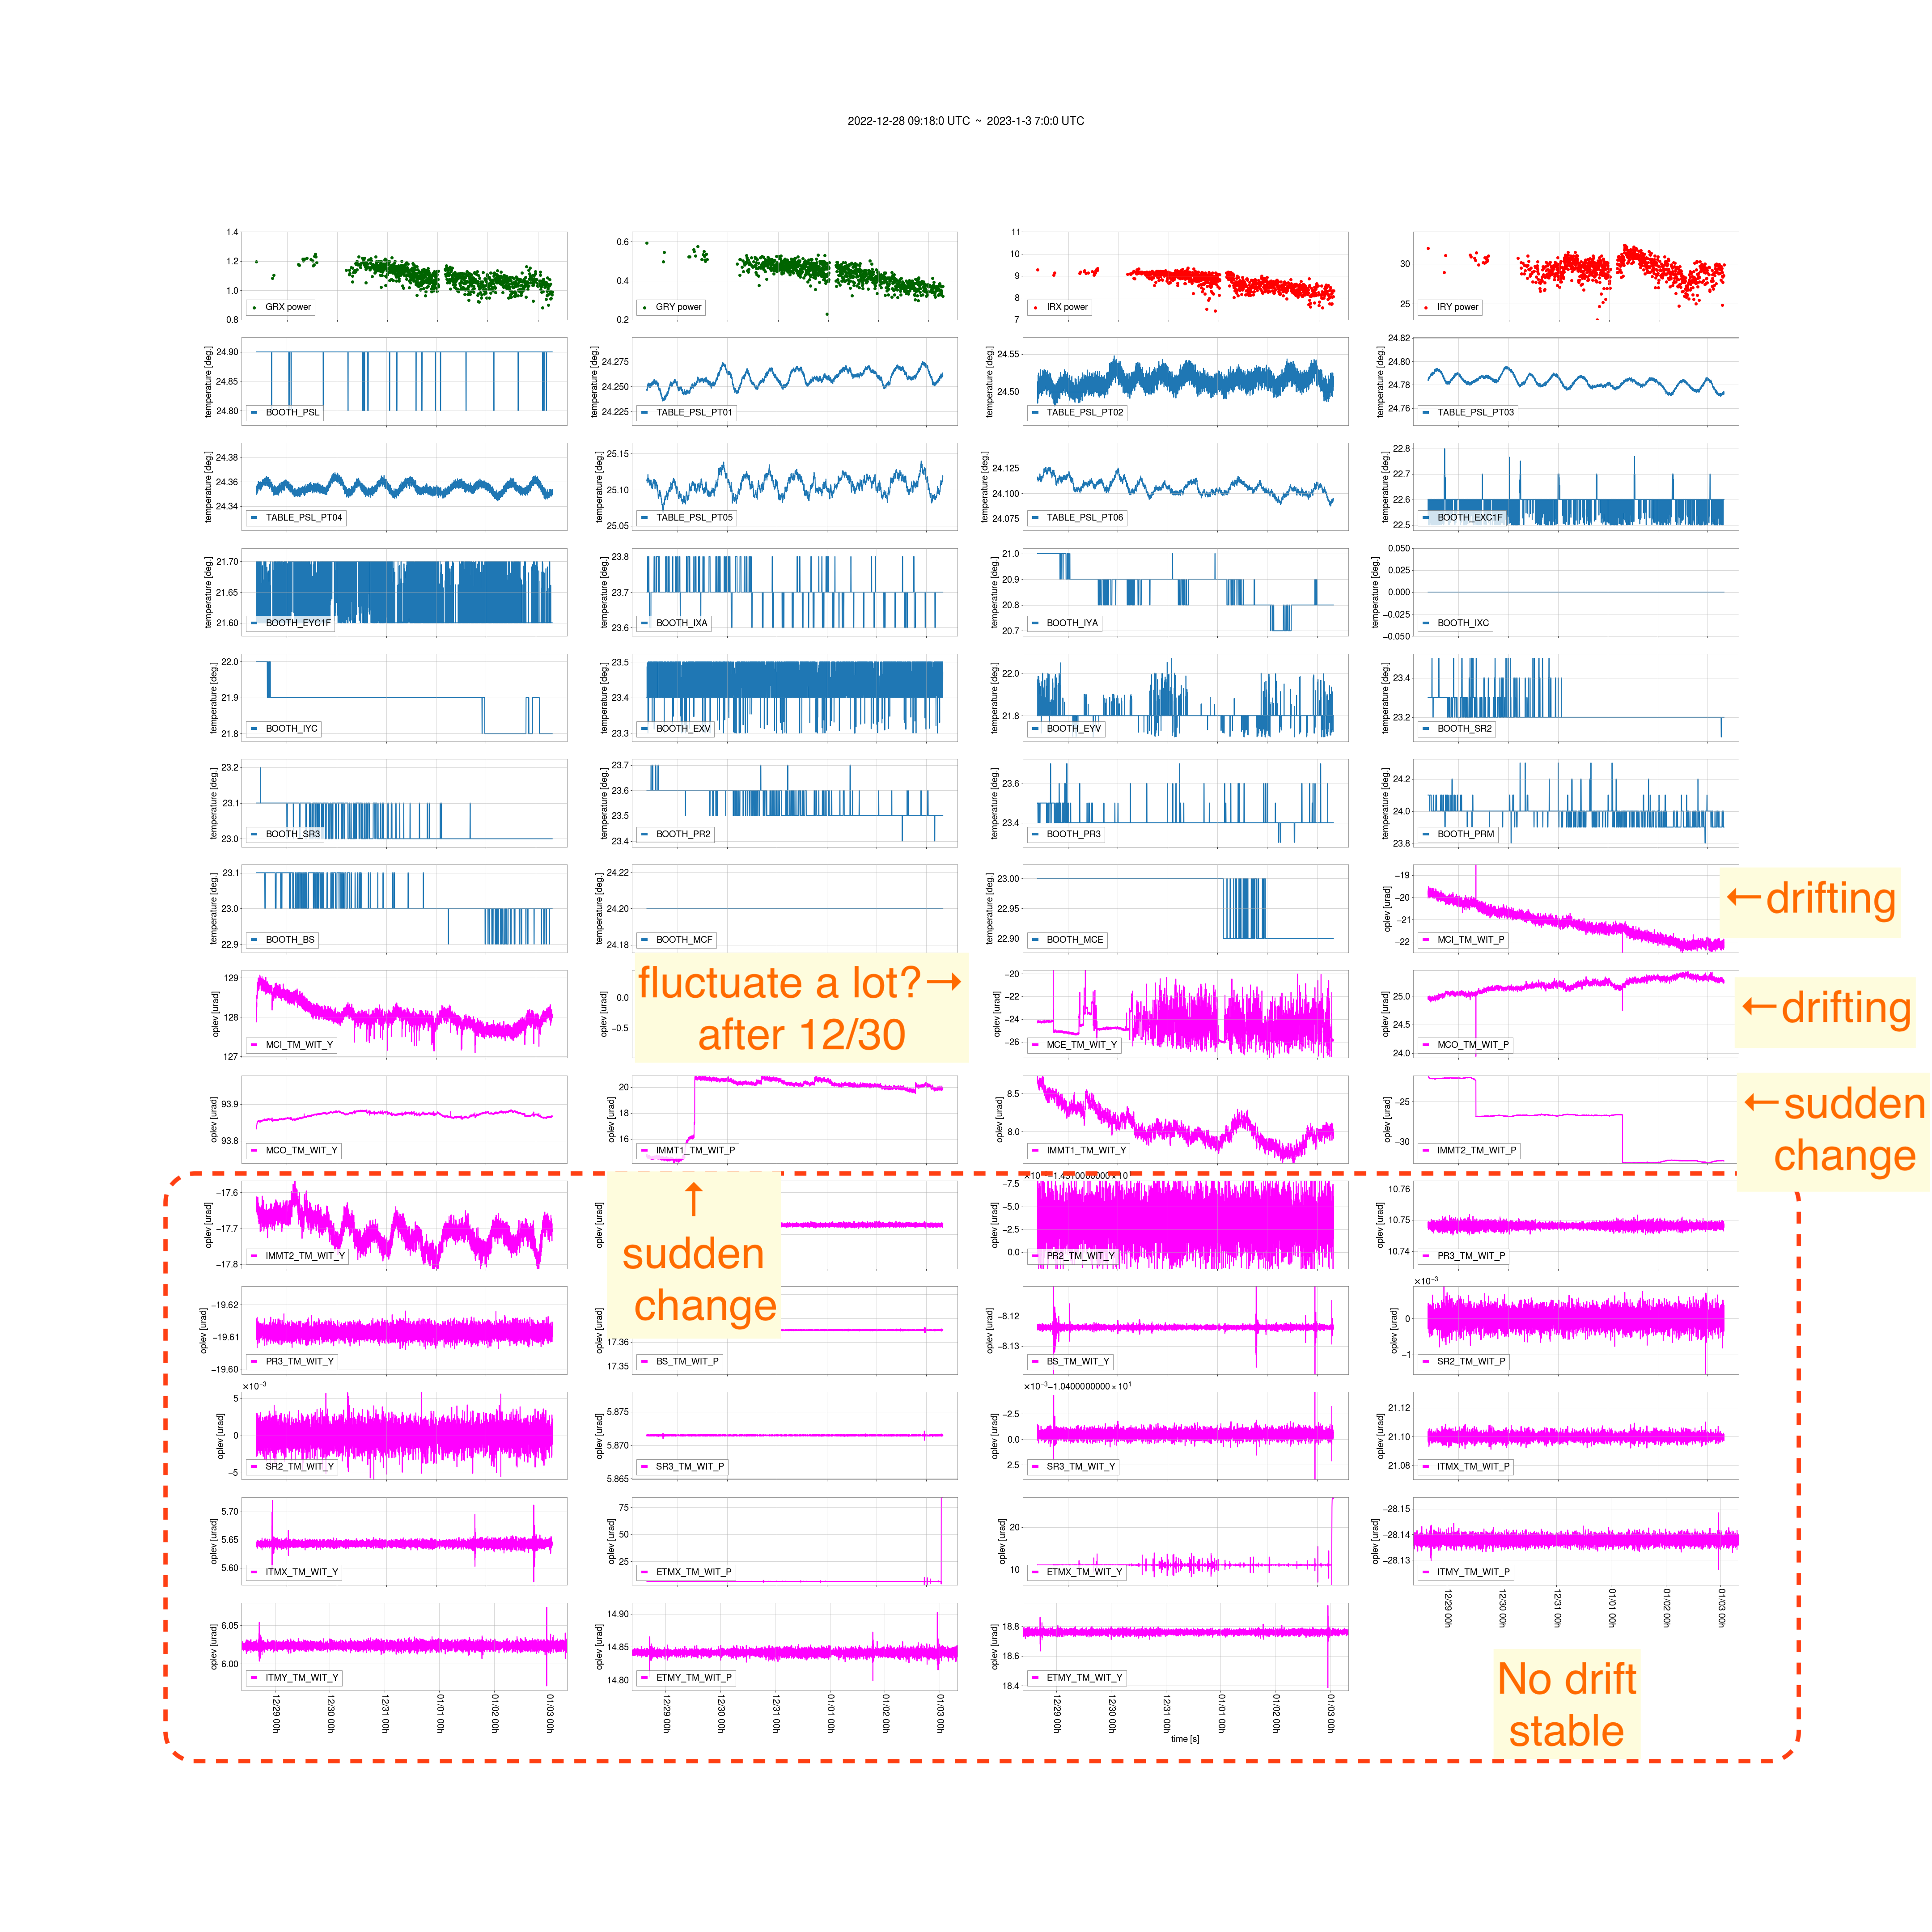
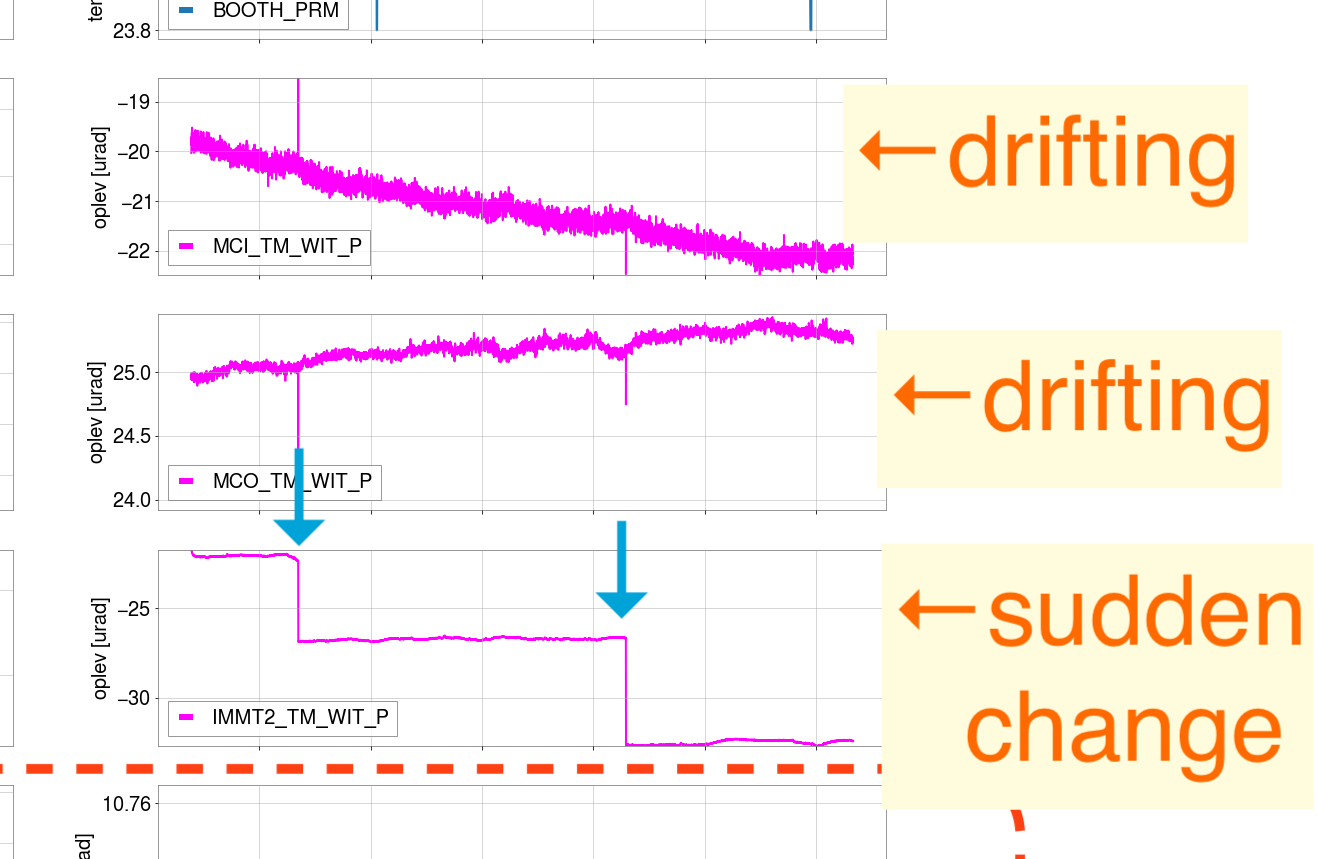
- I re-generated the summary page of LSC duardian


![[image]](https://klog.icrr.u-tokyo.ac.jp/osl/uploads/23611_1673941440_23613_1673941411_Screenshot%20from%202023-01-17%2016-32-02.png)
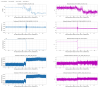
![[12/29]](https://klog.icrr.u-tokyo.ac.jp/osl/uploads/23650_1674117212_ACC1.png)
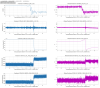
![[1/1]](https://klog.icrr.u-tokyo.ac.jp/osl/uploads/23650_1674117215_ACC2.png)
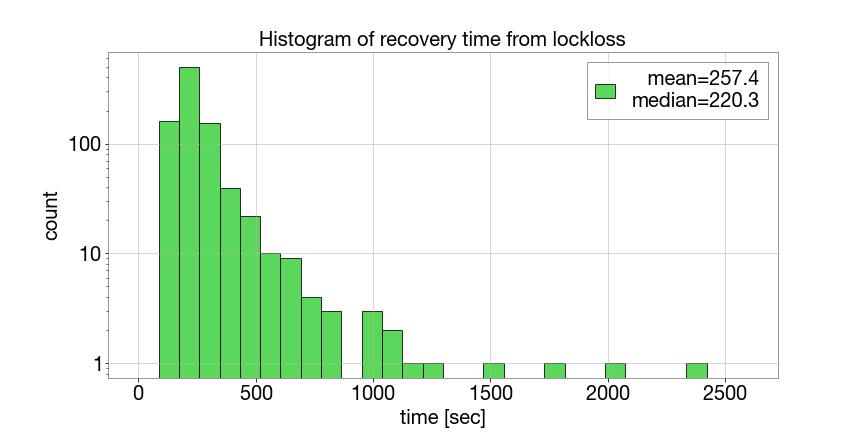
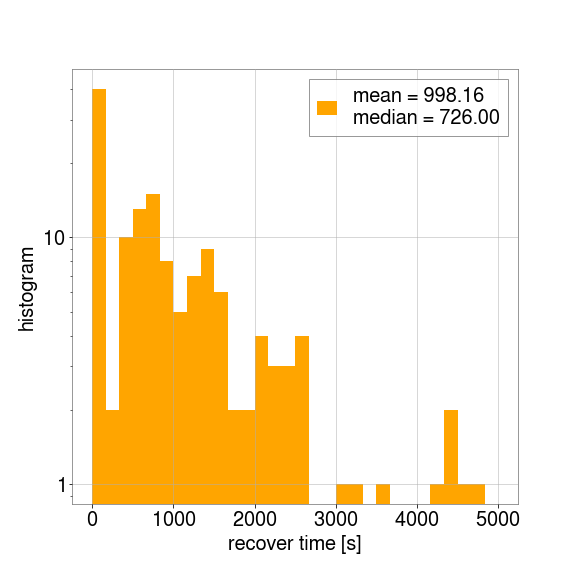
![[histogram is here]](https://klog.icrr.u-tokyo.ac.jp/osl/uploads/23767_1675148731_hist_O3GK_rem.png)