In the context of the sensor correction filter design (klog 22835), I identified an upper limit of the microseismic motion that can be used in the process of filter optimization.
As described in klog 22835, the seismic motion, and the noises of the siesmometer and LVDT are used to optimize the shape of the sensor correction filter. The amplitude of the seismic motion, used for such an example, is not the maximum it has been experienced at the KAGRA site (see Fig. 5). Therefore, with the aim of designing a filter that would work in a larger variety of conditions, it seems convenient to find an upper limit of the microseismic motion amplitude.
I followed these steps:
- Using the time series reported in KAGRA summary pages, I Identified the dates and times of high microseismic motion, typically, when it was higher than 1 um/s.
- I also considered the cases in which the microseismic peaks were at their lowest and highest frequencies, regardless of their peak values.
- For each date, using one-hour data segments in which the amplitude seemed constant, I requested to the Pastavi server an amplitude spectral density (ASD) with a resolution of 5 mHz (200 seconds chunks).
- Using all the ASD samples, an upper limit was constructed using the maximum values at each frequency.
- Because I inspected the plots in the summary pages visually, I only checked November and December in 2021 and January, February, October, November, and December in 2022.
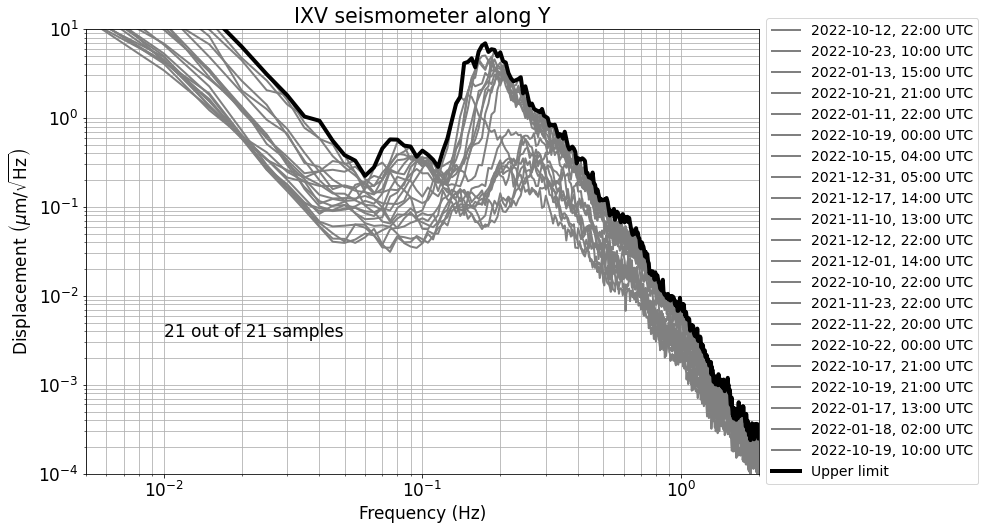
- The set comprises 21 ASD samples from the IXV seismometer (center, 2nd floor).
The description of the figures is this:
- All samples along Y and the upper limit. (There are similar plots for X and Z, but are not shown here.)
- Samples that contribute with at least one data point between 60 mHz and 1.5 Hz. They are 13 out of 21 samples. (Again, there are similar plots for X and Z, but are not shown here.)
- Ground displacement upper limits in X, Y and Z.
- Ground velocity upper limits in X, Y and Z.
- Comparison of the upper limits reported here (Fig. 3), with those used for klog 22835: the ones reported here are higher (above 60 mHz for Z).
The last three text files contain the upper limit data, with comments.


