This entry outlines the method of calibrating the seismometer on the ground, with respect to the LVDT in the top GAS filter F0, and provides an example using data I found for the BS.
Although the concept has already been explained for the case of the IP (klog 20873, 22229), the difference is that the F0 doesn't have the geophone. Therefore, the formula a * SEIS = GEO-LVDT, where a is the inter-calibration factor, cannot be used straightforwardly. In the case of F0, the term GEO represents the displacement of the keystone with respect to an inertial reference frame.
The strategy is to write the formula above in terms of the transfer function from the seismometer on the ground to the LVDT in F0. Let's begin by writing:
GEO = a × SEIS + LVDT ⇒ T × a × SEIS = a × SEIS + LVDT
where T is the transfer function from the ground SEIS to the keystone displacement GEO. This formula can be written as:
LVDT / SEIS = a × ( T - 1 ).
The ratio LVDT / SEIS is a transfer function we can measure.
In order to calculate the inter-calibration factor a, it's necessary to provide a mathematical model of T, and fit the expression a × ( T - 1 ) to the measured transfer function. An important property of T is that it must equal to one at low frequencies, because the keystone follows the ground motion below the resonant frequency.
As an example of this scheme, I calculated the inter-calibration factor for the seismometer on the 2nd floor and the BS F0 LVDT. I used the data in the file /kagra/Dropbox/Subsystems/VIS/vis_commissioning/bs/IP_diag/20221115/F0_spectra_noSC.xml. I don't know the conditions of the measurement, therefore, the numerical results should be considered as an example only.
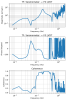
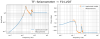
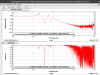
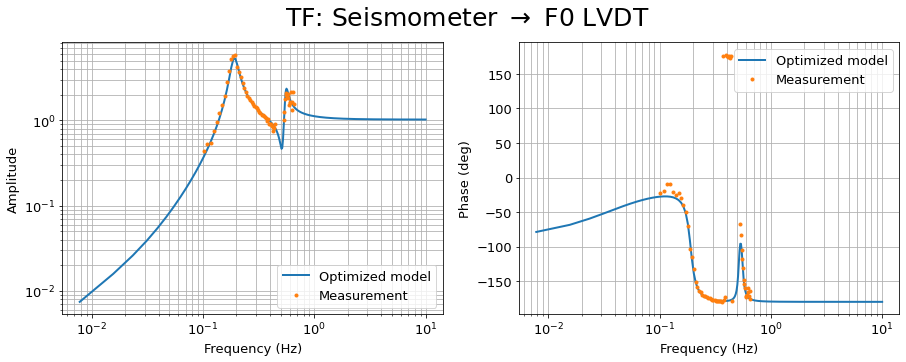
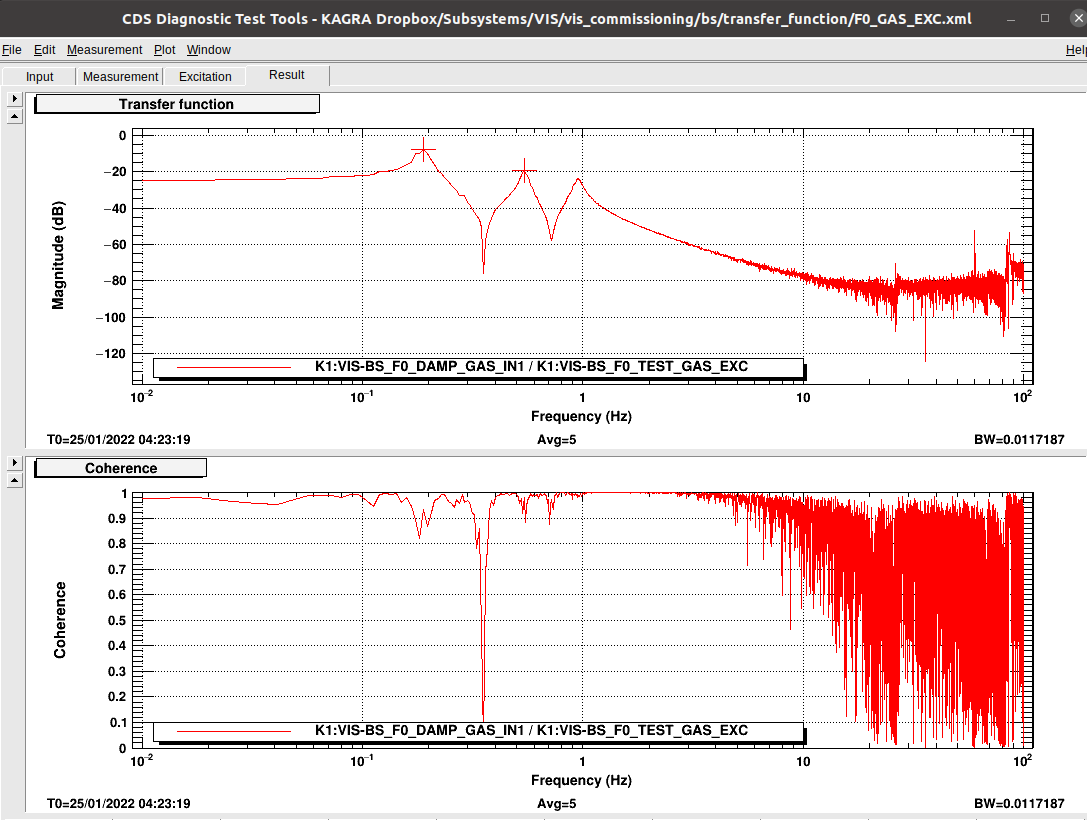
Fig. 1 shows the measured transfer function LVDT / SEIS and the coherence. Fig. 2 shows the plot of the fitted model of a × ( T - 1 ), and the data points used for the fit. The data that was used was between 0.1 and 0.7 Hz with coherence higher than 0.75. The frequency of the resonance peaks and of the notch in the model are consistent with a measurement of the force TF stored at /kagra/Dropbox/Subsystems/VIS/vis_commissioning/bs/transfer_function/F0_GAS_EXC.xml (see Fig. 3). Namely, the resonance peaks are at 190 and 553 mHz in the fit, and at 189 and 541 mHz in the force TF. The position of the notch between the peaks is slightly different (385 and 353 mHz respectively), nevertheless, around the notch the coherence is low. The resolution is 10 mHz.
The value of the calibration factor obtained is a = 1.0218.
The implementation is carried out and explained in a Jupyter notebook:
- Directory: /kagra/Dropbox/Subsystems/VIS/vis_commissioning/bs/IP_diag/20221115/
- File name: seismometer_F0_lvdt_intercalibration.ipynb and tools.py
- Conda environment: vishack.