Reports 1-1 of 1 Clear search Modify search
VIS (IX)
masahide.tamaki - 23:07 Thursday 03 November 2022 (22784) Print this report
Contribution of control update (ITMX MN P)

Continuation from klog22767.

I did the noise budget of IX MN P to assess how much noise the OBS filter (klog22767) put.

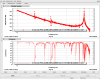
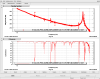
First, I measured transfer function from ITMX_MN_P to DARM (and ITMY_MN_P to DARM for comparision).
They are shown in Fig1&2.
Corresponding xml files are located at /users/Commissioning/data/NoiseBudget/TFs/2022/1103 (and aso in /kagra/Dropbox/Measurements/NoiseBudget/TFs).

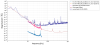
Then, I plotted control noise with noise budget mode on Pastavi (klog22627).

The result is shown in the figure below.
Fig3

Orange line shows the data when the noise budget was performed before (klog22513), but it looks pink because it is covered by summation.
Blue line shows current contol noise level of ITMX_MN_P.
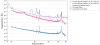
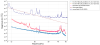
(A wider frequency view is shown in Fig4.)
►  Summation line is meaningless in Fig3 and Fig4, because I just wanted to make a comparison with past data.
    (I would have to ask developer to adjust the script to get rid of these lines, but we wouldn't need such a feature in this tool. All I have to do is write my own scripts.)
►  For now, it seems current DARM sensitivity can't be shown at least from Pastavi web page (navy blue line is current best, so it is not same as the DARM line in klog22513). 

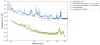
The noise compared to ITMY_MN_P is as shown in the figure below.
Fig5

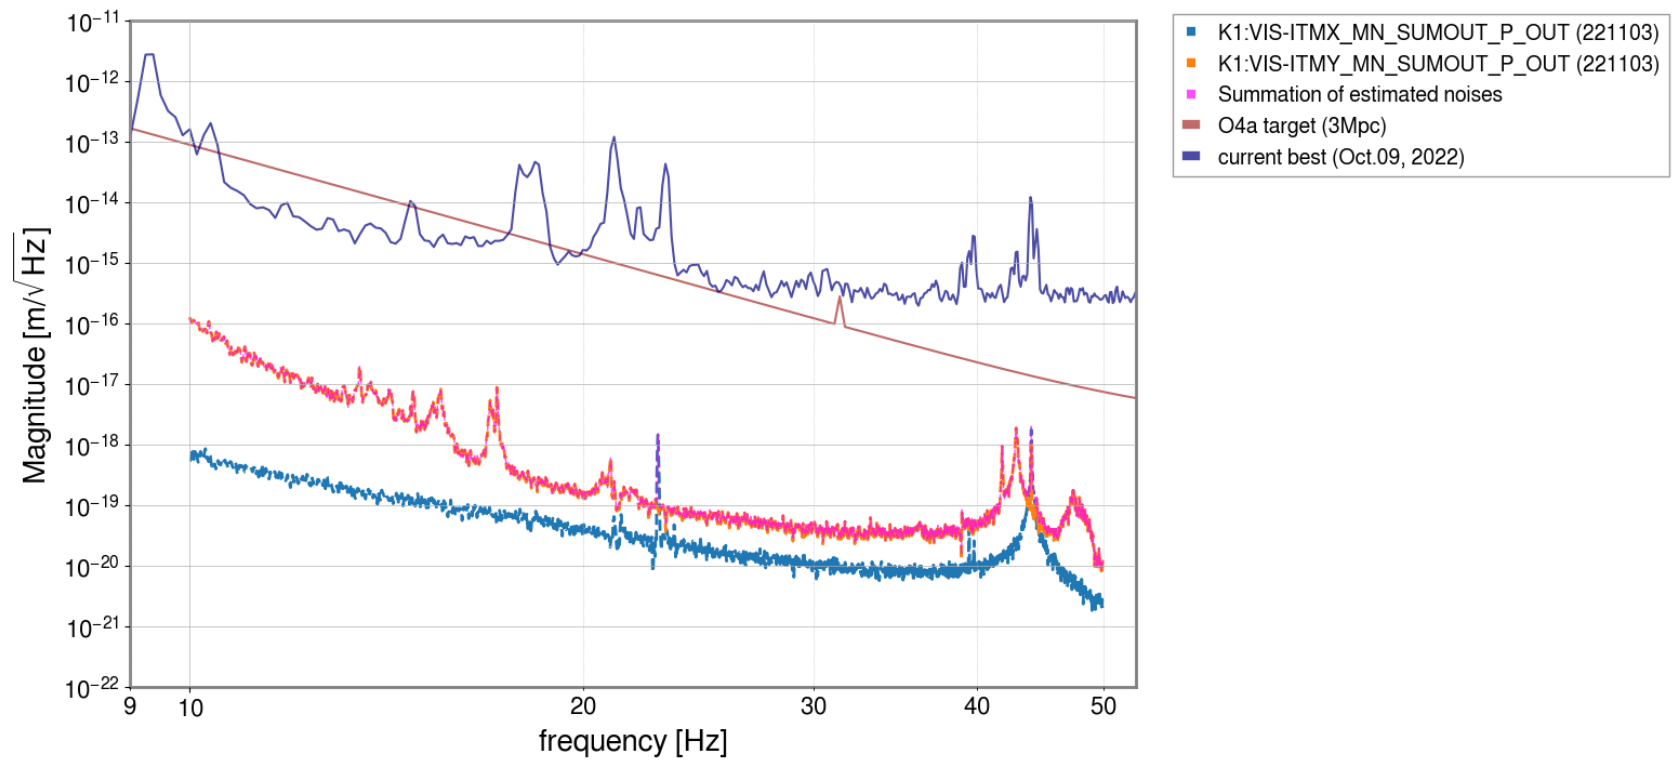
In this figure, blue line shows current ITMX_MN_P and orange line shows current ITMY_MN_P.

As long as I judge from these figures, it is ok to say that the local control noise in ITMX_MN_P (also ITMY_MN_P) is sufficiently small.

Images attached to this report
Comments to this report:
tomotada.akutsu - 8:59 Friday 04 November 2022 (22791) Print this report

It is useful if the pastavi noise budgetting can

  • select which noise contirbution curves will be included into a single summation curve
  • become possible to display such summation curve"s", and
  • select which DARM would be displayed, as commissioners sometimes want to compare some noise projection curves with the " current" DARM (or MICH or PRCL or...) to understand the noise landscape.

for the sake of commissioning. > Yuzurihara-dono

Can pastavi extract the DARM noise curves from a measured .xml file?

hirotaka.yuzurihara - 15:21 Sunday 06 November 2022 (22806) Print this report

Akutsh-san, thank you for your comments!!

  • > Can pastavi extract the DARM noise curves from a measured .xml file?
    • It is not implemented yet.
  • > select which noise contirbution curves will be included into a single summation curve
    • There are two options in the bottom table. If you select `for reference`, that noise curve will not be included in the summation.
  • > select which DARM would be displayed, as commissioners sometimes want to compare some noise projection curves with the " current" DARM (or MICH or PRCL or...) to understand the noise landscape.
    • I agree with that. In (near) future, the noise budget tool will be very important to judge the priority for the noise hunting activity and the improvement of inspiral range.
    • The current tequnical issue for your suggestion is to implement the (whitening and de-whitening) filters which are used in diaggui and foton.
    • In the current Pastavi, the latest whitening filter for DARM is implmeneted by hardcoded. But, to extend the tool for MICH, PRCL, and so on, the tool need to be able to treat any filter on foton.
hirotaka.yuzurihara - 15:23 Sunday 06 November 2022 (22805) Print this report

Tamaki-san,

thank you for using the noise budget tool and also helpful feedback.

About the issue that one noise curve is hidden by summation curve, you can handle this issue by selecting `for reference` checkbox instead of `for noise budget`.

If you select `for reference`, the summation will not appear on the result plot.


> For now, it seems current DARM sensitivity can't be shown at least from Pastavi web page (navy blue line is current best, so it is not same as the DARM line in klog22513). 

I think if you specify the date and the proper channel name, you can overplot the current sensitivity. The procedure is as follows: 

  • In the upper page of Pastavi, please select the date when FPMI was locked. To check such date, summary page is convenient. There is a button to check the lock segment by the summary page.
  • Write down the channel name is `K1:CAL-CS_PROC_C00_STRAIN_DBL_DQ` in the form of `channel for ASD`. 
  • Select the option `no transfer function + with filter (require : only channel for ASD)` in the top of table. If this checkbox is on, you don't neet xml file. And the generated noise curve is just sensitivity curve with multiplying the proper filter.

(I'm sorry for requesting the complitcated procedure. When I got the good idea, I can implement that more conveniently.)

hirotaka.yuzurihara - 11:18 Monday 07 November 2022 (22811) Print this report

I correct my post.

  • The channel name was incorrect. Please use `K1:CAL-CS_PROC_DARM_DISPLACEMENT_DQ`. I attach the example of noise budget  including the current sensitivity.

Future work memo

  • Implement the checkbox to tuen on/off the noise curves for `current best` and `O4a target (3Mpc)`.
  • Implement the arbitral color options (to keep robustness, the usage will be not so simple)
  • Implement the category (group?) appearance in the legend. There are two categories in the legend : refernce and noise budget. By using indent, it might be possible to implement.
Images attached to this comment
Search Help
×

Warning

×