The BS TM QPDs of the OpLev were calibrated and reported in 18834.
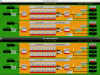
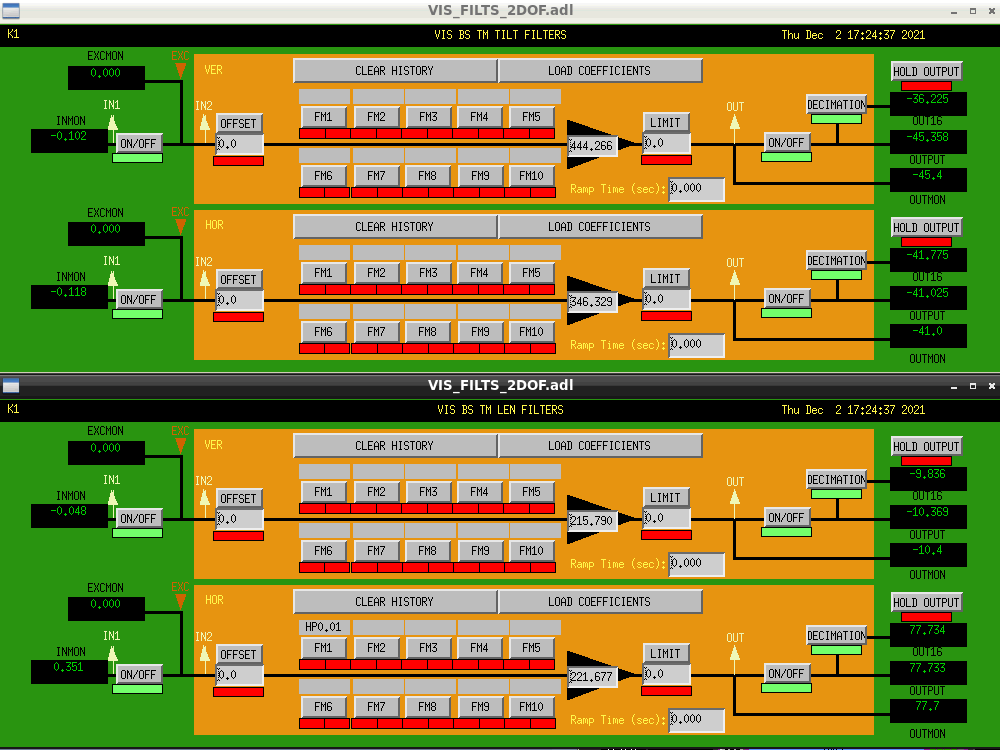
I have put these calibration factors in MEDM. See figure 1.
Note the values are all positive, as opposed to negative obtained from the calibration.
This is because the matrix prior to these gains was set to align pitch/yaw/longitudinal with positive calibration gains But this may be changed later when unification happens.
Using length information from 8481 and 8417:
Optics to viewport: 996 mm (8481 says it's optics to steering mirror but I think it's a typo).
Viewport to steering mirror: 120 mm
Steering mirror to TILT QPD: 185 mm
Steering mirror to BS: 65 mm
BS to lens: 45 mm
lens to LEN QPD: 397.4 mm
Focal length of the lens: 300 mm (Common for Type-B)
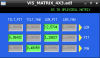
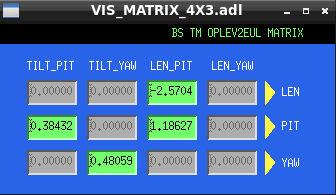
I obtained the sensing matrix shown in Fig.2
I tested the calibration by offsetting IP L and Y and comparing the displacement readouts from the IP and TM.
One sidenote: The IP needs diagonalization. Actuating in L and Y at DC gives large L and Y offsets in both IP and TM. We need to do something to fix this later.
Second sidenote: The IP is close to unstable. It doesn't return to its original position after applying an offset. It's always shifting.
Nevertheless, the TM L readout agrees with IP L but IP Y to TM Y ratio is like 1.5:1. I won't fix this unless this becomes an issue.
I then proceed to diagonalize the TM OpLev.
It started with huge observable couplings. P2L was ~14%, which indicates that the position of the length sensing QPD might not be optimal. Others couplings were somewhere around 1-5 %.
I didn't measure L2Y coupling because it could be degenerating with P2Y.
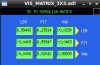
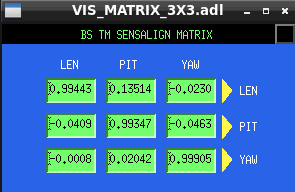
I obtained a decoupling matrix (TM_SENSALIGN also shown in Fig.3:
[[ 9.94434160e-01, 1.35138629e-01, -2.30238668e-02],
[-4.09170584e-02, 9.93466380e-01, -4.63889460e-02],
[-8.41221986e-04, 2.04248740e-02, 9.99046280e-01]]
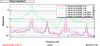
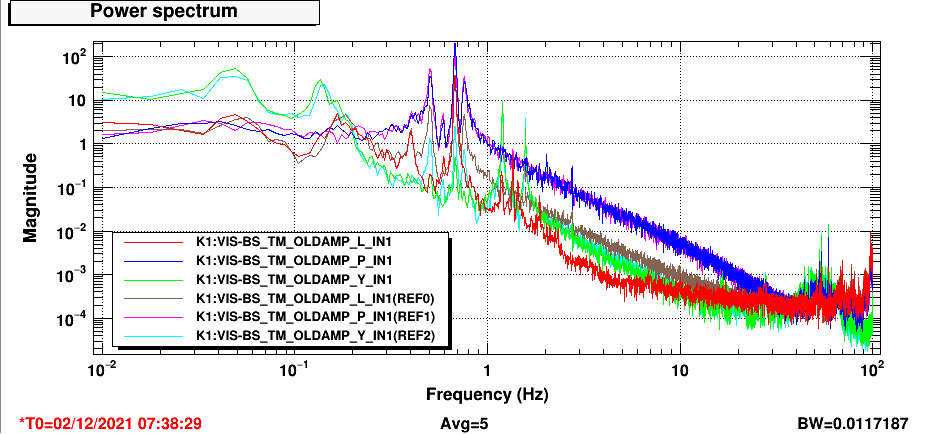
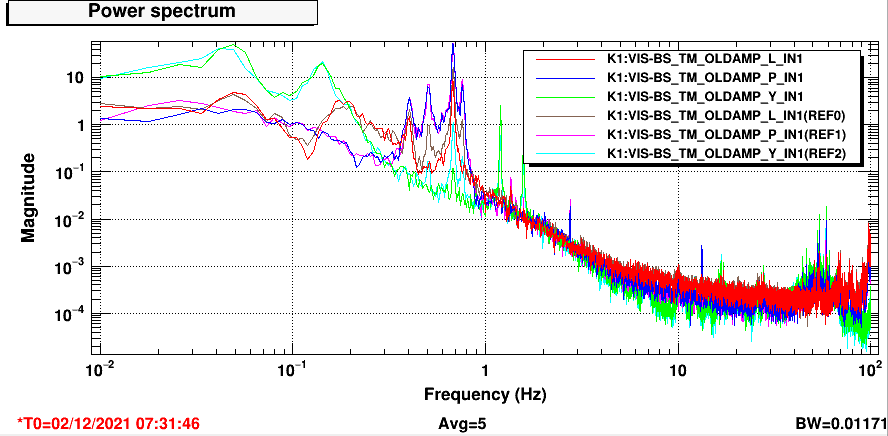
Fig.4-6 shows the ASDs of the TM L, P, Y readouts when excited in L, P, Y with white noise. Reference plots show the ASDs before diagonalization.
As can be seen, the diagonalization resulted in cross-coupling below/around 1%. L2Y coupling is observable but it's around 1% so I didn't proceed to further reduce that.

