Data avaliable at /kagra/Dropbox/Subsystems/VIS/vis_commissioning/bs/calibration/
Jupyter notebook used to generate the plot available at /kagra/Dropbox/Subsystems/VIS/vis_commissioning/bs/notebook/calibration/
Undoubtedly, there're infinitely many ways to reasonably calibrate the QPDs and I struggled to settle on one. Here, I compared two methods and for the sake of unification, I will use the first one.
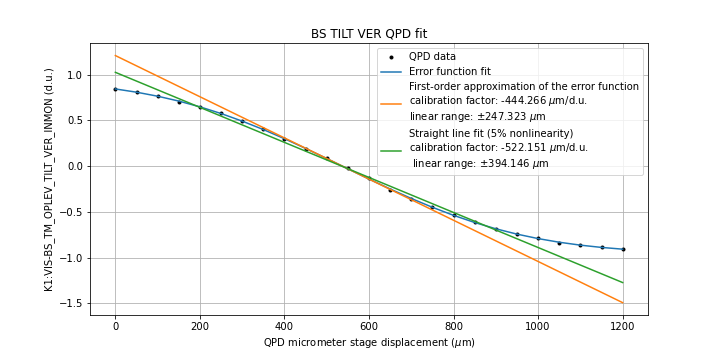
Method 1 (by Miyo-san): Fit an error function
and use slope the first-order approximation of this model,
i.e. to derive the calibration factor.
The benefit of this method is that the model fits the data very well because the calibration curve of the QPD behaves exactly like an error function.
However, the calibration factor is only accurate when the beam is exactly at the center and will start to degrade as the beam is offset.
Method 2: Starting with data points at the center, 1) fit a straight line, 2) select points that are within certain linearity specification of this line, 3) include them to the dataset, 4) repeat until no points can be added.
This method is better at retaining the scale of readout at a larger range. And, we can specify a target nonlinearity as well, which was chosen to be 5% randomly.
Please see the results from the figures.
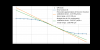
A summary from the error function fit:
LEN_HOR:
calibration factor: -221.677 µm/d.u.
linear range (5% nonlinearity): 114.441 µm
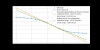
LEN_VER:
calibration factor: -215.790 µm/d.u.
linear range (5% nonlinearity): 112.330 µm
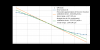
TILT_HOR:
calibration factor: -346.329 µm/d.u.
linear range (5% nonlinearity): 194.239 µm
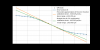
TILT_VER:
calibration factor: -444.266 µm/d.u.
linear range (5% nonlinearity): 247.32 µm