Here comes the data.
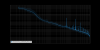
The plot below shows two spectra of the PLL X feedback signals when the mystery peak was visible and when it wasn't.
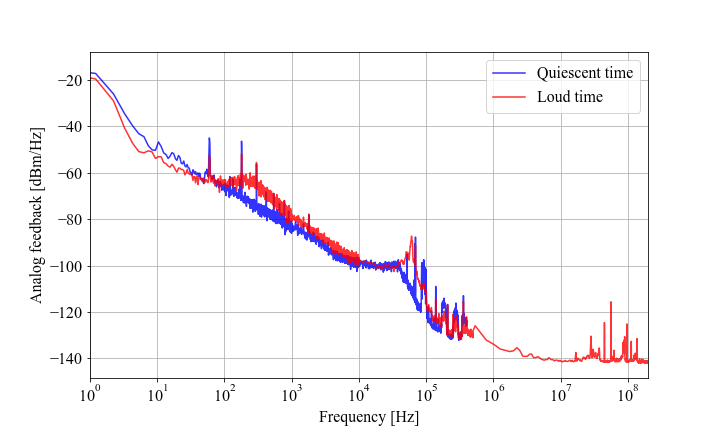
The red trace is the one with the mystery peak visible at around 250 Hz, labeled as "loud time." The blue was the same signal but measured when the mystery peak was not visible, labeled as "quiescent time". The raw data are attached as text files to this log entry. There are two data files as follows.
- quiescent_feedback.txt
- loud_feedback.txt
Note that the spectra are stitched together from multiple measurements with different bandwidth settings. Therefore, the variance of the power spectra don't look consistent across the frequency band. The measurements were all done by a Moku-lab configured for
- DC coupling,
- 1 MOhms impedance, and
- 1 V input range.
Some observations
- It is evident that the mystery peak is not an aliasing of some high frequency components.
- Therefore, the mystery peak is real and exists at 250 Hz.
- When the mystery peak is visible, a structure at around 60 kHz is developed at the same time.
- Not sure if this is just a coincident
- Decrease of the noise level below 100 Hz is clearly seen
- Therefore, what we have seen in the control room is real in the analog world too.
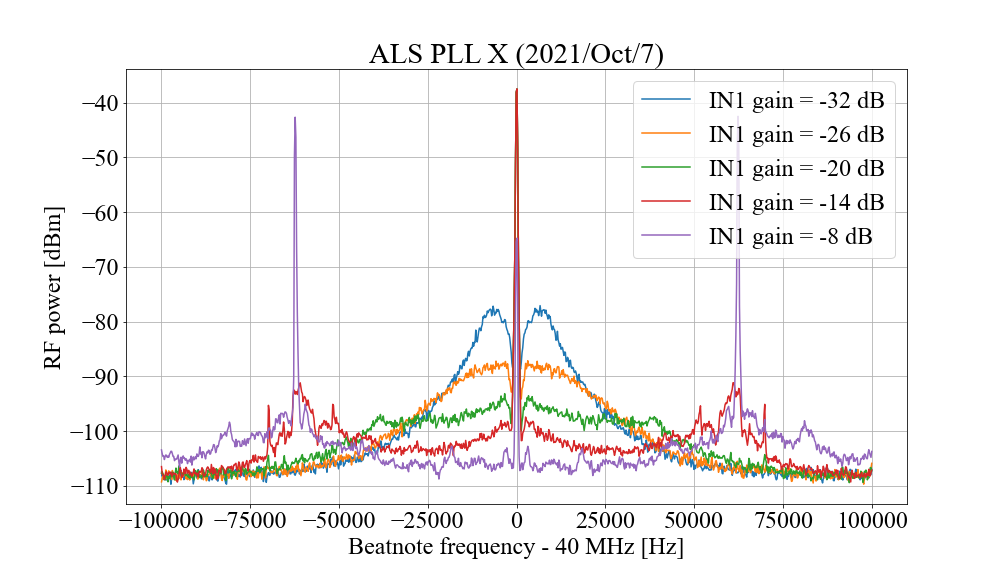
Morphology of the beat note
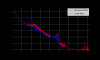
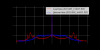
The last one I would like to show here is the beatnote signals. The plot below shows the comparison of the beatnote when it was in loud and quiescent states.
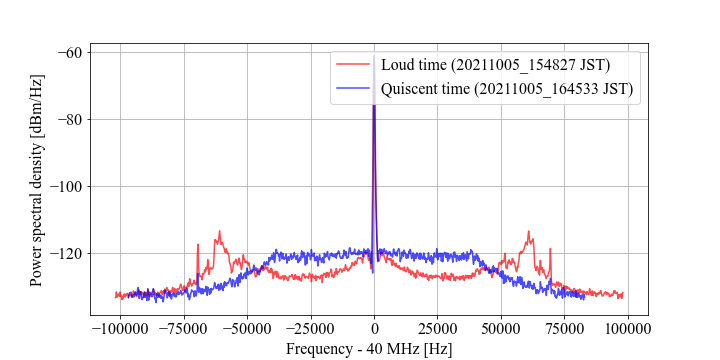
The legend and color scheme are identical to the plot for the feedback signals. As expected, the data for the loud time show an excess at around 60 kHz.
However, something is wrong below 40 kHz because the noise level for the quiescent time is greater than the one for the loud time. This is counterintuitive given the feedback spectra show at the top. Now, I have to confess that I made a mistake which I believe is properly corrected. The quiescent data was taken with a different physical unit setup i.e., dBm rather than dBm/Hz. I thought I corrected the data back to dBm/Hz by normalizing the data by the resolution bandwidth. But, I might have made another mistake there. Otherwise, this feature may be a hint for resolving the mystery.
Anyhow, I plan to repeat the same measurement to make sure that the blue trace is really greater than the red (or vice versa), hopefully tomorrow.