Now all user process were running on k1script0.
Some of them will be moved to k1script1 for balancing CPU load.
Tanaka, Kimura(remote), Uchiyama
Slack issued an alarm at 22:06 on June 12 due to a low cooling water supply level for the Xend chiller used for cryocoolers. We promptly checked the chiller.
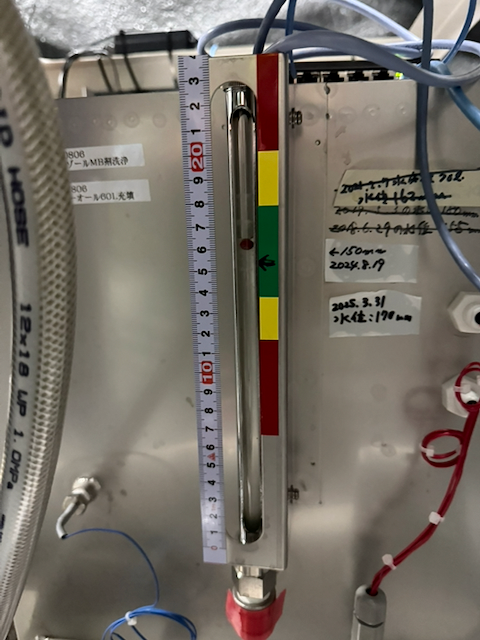
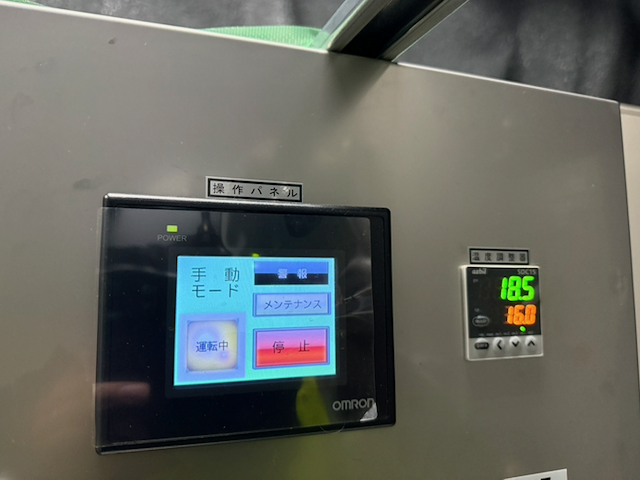
Upon inspection, we noticed that the chiller displayed an alarm number of 5 (Photo 1), indicating a low cooling water supply. We verified the water supply level and confirmed that it met the requirement (Photo 2, Requirement: 50L/min. Current level: 80L/min). Additionally, we checked the water level in the chiller tank and confirmed that it also met the requirement (Photo 3, Requirement: 55cm. Current level: 63cm). We confirmed the situation was normal.
Finally, we reset the alarm displayed in the chiller (Photo 4).


I performed the regular alignment for PMC with PICO because PMC trans. power was lower than 20 W and PMC REFL camera image got brighter than before.
Now, PMC trans. power was back to 23.2 W and the REFL camera image got darker.

Joshua, Chiaki, Kenta
We tried to improve the SRC flash size on OMC REFL PD by tweaking the alignment of two mirrors and the two lens relative position. However, any improvement could not be seen even though the alignment and the mode matching seem to be optimized. Fig.1 shows the time series when we finished the adjustment. Before the adjustment, we implemented the calibration factor from DGS cnts to uW, which is estimated from PDA100A2 and DGS parameters, into FM2 in the K1:OMC-REFL_DC filter bank. And we subtracted the dark offset. So, the unit of K1:OMC-REFL_DC_OUT is uW if our calculation is correct. In Fig.1, the interval between Y cursors represents the fringe size before adjustment. As you can see, the fringe size seems to be not changed so much, unfortunately.
There are some mysterious points
- fringe size seems to be breathed slowly
During the adjustment, we could not restore the fringe size just by restoring an alignment of one mirror or a position of lens. At first, we used SRM free swinging to obtain the flash fringe. So, we suspected the SRM swing was too small to sweep the FSR. So, the size depends on whether SRM position is close to resonance. Therefore, we tried to drive laser frequency with laser PZT by injecting a sine wave (1Hz, 2 Vpp) so that the laser frequency acrosses the resonance point. However, the situation was not changed. Fig. 2 shows the time series of the fringe. At the vertical cursor, we started the injection to PZT. Fringe size seems to be changed even though we did not touch anything. the interval of the breath seems to be ~60 secs. We are not sure of the cause of this breath for now. - Input Beam profile seems to be strange
Since we moved the lens location, we attempted to check the beam waist positon after the adjustment. Then we found that the beam profile seems to be strange (fig.3). The beam profile was measured at the 13 holes far from the 1st beam splitter. We are not sure that the mode match ratio can be acheived to 80% with such an ugly beam profile. We measured the power in front of the 1st beam splitter. And it is still 1 W even though the beam profile is strange, and is the same value with the power after the reflection from R:T = 9:1 beam splitter.
We are not sure what shoud we do next to improve the situation.


Date: 2026/06/12
Member: Dan Chen, Misato Onishi, Seiya Matsuo
We performed our usual WSK calibration at UToyama.
The results look no problem.
Results
| Case | Alpha (Main Value) | Alpha (Uncertainty) |
| Front WSK, Back GSK | -0.910912 | 0.000182 |
| Front GSK, Back WSK | -0.909303 | 0.000162 |
Comparison with Previous Results
Comparing with previous results, no significant issues were found.
Attached graph is the result summary including the latest measured data.

[Ushiba, Smith, Hirose, Saito]
The optical layout was slightly modified to make the alignment procedure easier. The beam profile of the sub-laser was measured, and the beam waist position and waist radius were determined. Comparing these values with those of the main laser measured in klog:36730, the mode-matching ratio was estimated to be approximately 89%. In addition, the alignment of the sub-laser beam incident on the SRC was performed using two irises. When the sub-laser PZT was driven, flashes were observed with the OMC REFL PD (K1:OMC-REFL_DC_OUT_DQ). By adjusting one mirror to maximize the signal while the PD gain was set to 40 dB, the maximum signal reached approximately 478 counts. Further improvements in alignment and mode matching are expected to increase the signal to approximately 1700 counts.
-
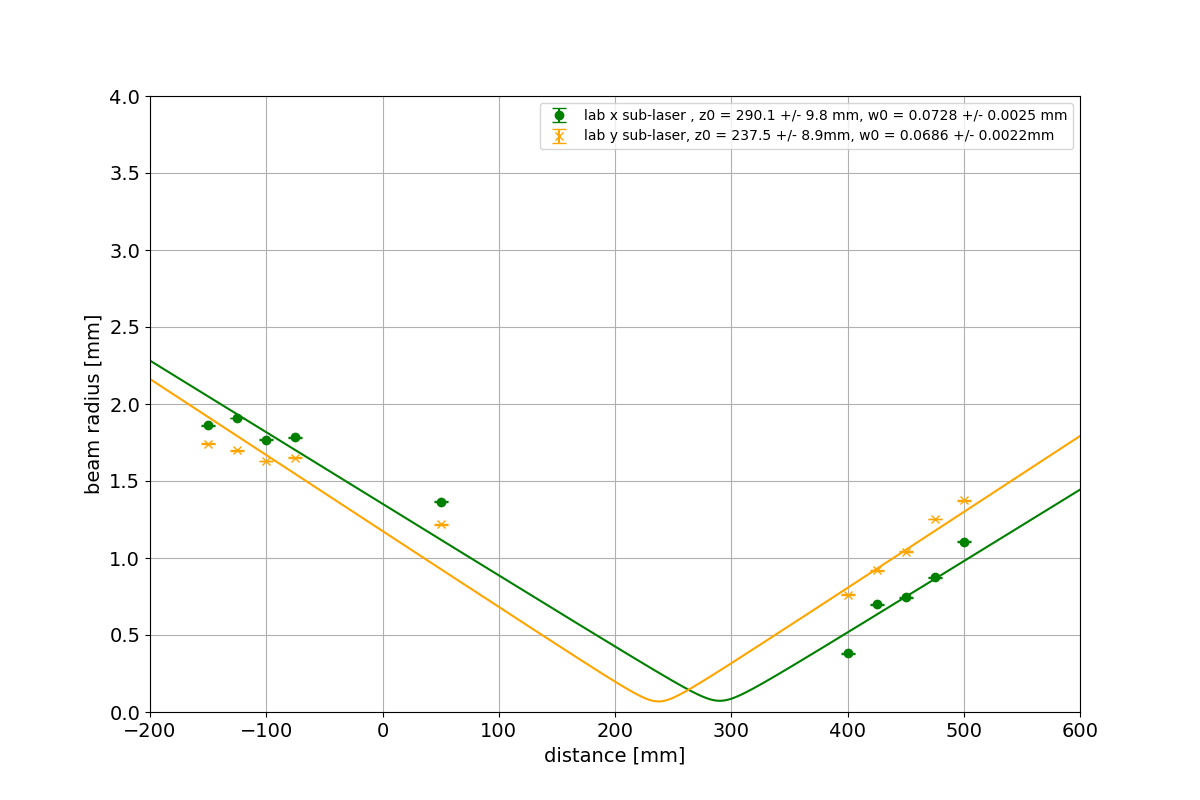
First, the optical layout was modified slightly to facilitate alignment (Figure 1). Using the sub-laser beam, the alignment was adjusted to avoid beam clipping. Next, the beam profile of the sub-laser was measured at locations far from the beam waist using a beam profiler, and a fit was performed (Figure 2). The resulting waist positions and waist radii were as follows:
Sub-laser
x-direction: Waist position = 290.1 ± 9.8 mm, Waist radius = 0.0728 ± 0.0025 mm
y-direction: Waist position = 237.5 ± 8.9 mm, Waist radius = 0.0686 ± 0.0022 mm
→Average: Waist position = 264 mm, Waist radius = 0.071 mmFor comparison, the main-laser beam profile measured in klog:36730 was used. The results were:
Main laser
x-direction: Waist position = 264.3 ± 5.1 mm, Waist radius = 0.0526 ± 0.0025 mm
y-direction: Waist position = 253.6 ± 2.3 mm, Waist radius = 0.0555 ± 0.0013 mm
→Average: Waist position = 259 mm, Waist radius = 0.054 mmUsing these results, the mode-matching ratio was calculated to be approximately 89%.
-
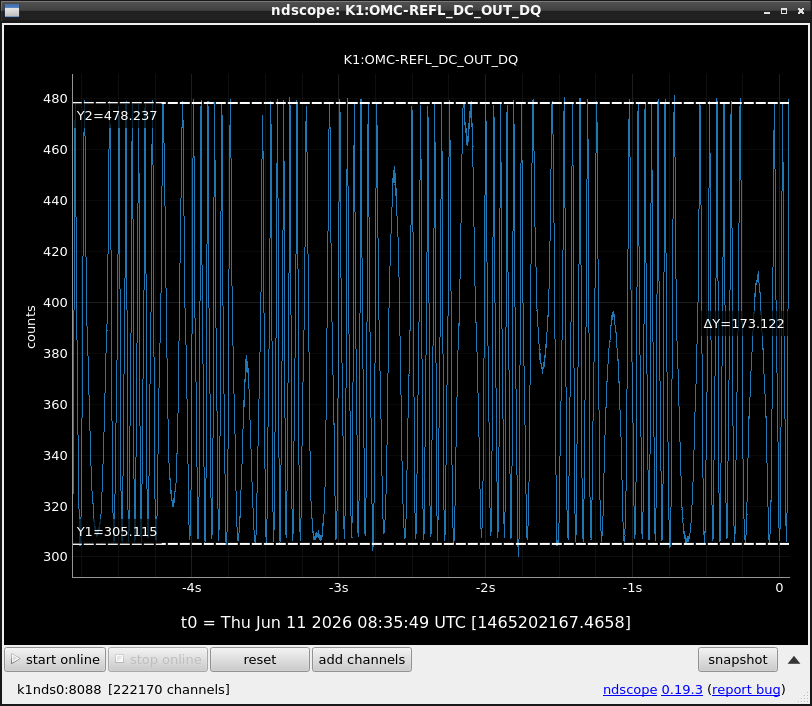
Next, two irises were used to ensure that the optical paths of the main laser and the sub-laser coincided. The alignment was adjusted using the BS and a nearby mirror. The main laser was then blocked so that only the sub-laser beam was present in the SRC. The sub-laser PZT was driven with a sinusoidal signal generated by the Moku:Lab function generator, and the OMC REFL PD (K1:OMC-REFL_DC_OUT_DQ), which had been installed by Tanaka-san(klog:37057), was monitored for flashes. Initially, no flashes were observed. However, after adjusting the mirror associated with the BS, flashes became visible (Figure 3). By adjusting one mirror to maximize the signal, the signal amplitude oscillated between approximately 305 counts and 478 counts.
-
Assuming that the optical power of the sub-laser incident on the SRC is 500 mW, the optical power reaching the OMC REFL PD at resonance is expected to be approximately 16 μW. The responsivity of the OMC REFL PD (Thorlabs PDA100A2) is approximately 680 V/W, and the PD gain was set to 40 dB. Therefore, the output voltage at resonance is expected to be approximately 1.1 V. Using the calibration factor of 610 μV/count, this corresponds to approximately 1700 counts at resonance. Therefore, by using the second mirror to further improve the alignment, the signal should be increased further.

Joshua, Chiaki, Kenta
We tried to improve the SRC flash size on OMC REFL PD by tweaking the alignment of two mirrors and the two lens relative position. However, any improvement could not be seen even though the alignment and the mode matching seem to be optimized. Fig.1 shows the time series when we finished the adjustment. Before the adjustment, we implemented the calibration factor from DGS cnts to uW, which is estimated from PDA100A2 and DGS parameters, into FM2 in the K1:OMC-REFL_DC filter bank. And we subtracted the dark offset. So, the unit of K1:OMC-REFL_DC_OUT is uW if our calculation is correct. In Fig.1, the interval between Y cursors represents the fringe size before adjustment. As you can see, the fringe size seems to be not changed so much, unfortunately.
There are some mysterious points
- fringe size seems to be breathed slowly
During the adjustment, we could not restore the fringe size just by restoring an alignment of one mirror or a position of lens. At first, we used SRM free swinging to obtain the flash fringe. So, we suspected the SRM swing was too small to sweep the FSR. So, the size depends on whether SRM position is close to resonance. Therefore, we tried to drive laser frequency with laser PZT by injecting a sine wave (1Hz, 2 Vpp) so that the laser frequency acrosses the resonance point. However, the situation was not changed. Fig. 2 shows the time series of the fringe. At the vertical cursor, we started the injection to PZT. Fringe size seems to be changed even though we did not touch anything. the interval of the breath seems to be ~60 secs. We are not sure of the cause of this breath for now. - Input Beam profile seems to be strange
Since we moved the lens location, we attempted to check the beam waist positon after the adjustment. Then we found that the beam profile seems to be strange (fig.3). The beam profile was measured at the 13 holes far from the 1st beam splitter. We are not sure that the mode match ratio can be acheived to 80% with such an ugly beam profile. We measured the power in front of the 1st beam splitter. And it is still 1 W even though the beam profile is strange, and is the same value with the power after the reflection from R:T = 9:1 beam splitter.
We are not sure what shoud we do next to improve the situation.
Though this issue comes from a bad design of some of site networks such as the old PICO network, it cannot be fixed soon because VLAN settings and/or cabling work are required. So I tried to apply a temporal network configuration on the script servers and was able to avoid this issue. Detailed settings can be seen in JGW-T2617213. After changing the network configuration, I could confirm the picomotor drivers in the old PICO network work well on the new script servers. So all downgraded scripts were moved to the new system again and they are now running on the k1script0.
Now all user process were running on k1script0.
Some of them will be moved to k1script1 for balancing CPU load.
KAGRA Pcal-Y updates (2026/06/11)
Workers: Dan Chen, Misato Onishi, Seiya Matsuo
We performed monthly Pcal-Y calibration on 2026/06/11.
After the calibration, we updated EPICS parameters related to the Pcal-Y system. No issues were found.
| EPICS Key | Before | After | Δ (After − Before) |
|---|---|---|---|
| K1:CAL-PCAL_EY_1_OE_R_SET | 0.98970 | 0.98975 | 0.00004 |
| K1:CAL-PCAL_EY_1_OE_T_SET | 0.98970 | 0.98975 | 0.00004 |
| K1:CAL-PCAL_EY_1_PD_BG_RX_V_SET | -0.00468 | -0.00479 | -0.00011 |
| K1:CAL-PCAL_EY_1_PD_BG_TX_V_SET | 0.02250 | 0.01468 | -0.00782 |
| K1:CAL-PCAL_EY_1_RX_V_R_SET | 0.50286 | 0.50316 | 0.00030 |
| K1:CAL-PCAL_EY_2_INJ_V_GAIN | 0.52009 | 0.51741 | -0.00268 |
| K1:CAL-PCAL_EY_2_OE_R_SET | 0.98588 | 0.98594 | 0.00006 |
| K1:CAL-PCAL_EY_2_OE_T_SET | 0.98588 | 0.98594 | 0.00006 |
| K1:CAL-PCAL_EY_2_PD_BG_TX_V_SET | 0.02476 | 0.01706 | -0.00770 |
| K1:CAL-PCAL_EY_2_RX_V_R_SET | 0.49714 | 0.49684 | -0.00030 |
| K1:CAL-PCAL_EY_WSK_PER_RX_SET | 1.84385 | 1.84525 | 0.00140 |
| K1:CAL-PCAL_EY_WSK_PER_TX1_SET | 0.33366 | 0.33352 | -0.00014 |
| K1:CAL-PCAL_EY_WSK_PER_TX2_SET | 0.90553 | 0.90694 | 0.00141 |


Detailed report.
Before starting the alignment work, we confirmed that all Type-A suspensions went to LOCK_ACQUISITION.
Xarm alignment
We followed the MEDM procedure for the Xarm alignment. First, we requested IRX_LOCKED, and then requested GRX_LOCKED_WITH_IRX. At this step, it took some time to lock the arm. Therefore, PR3 was slightly moved to improve the locking condition.
After that, we requested ALIGNING_XARM. Since the GRX transmitted power was not good enough, we manually adjusted ETMX and ITMX. As a result, the transmitted powers became approximately GRX ~ 0.96 and IRX ~ 0.95.
Then, we requested RECORD_GOOD_VALUES_XARM and performed OFFLOAD.
Yarm alignment
We also followed the MEDM procedure for the Yarm alignment. We requested IRY_LOCKED, GRY_LOCKED_WITH_IRY, and then ALIGNING_YARM. The alignment condition was already not bad, so we did not perform any manual adjustment.
Then, we requested RECORD_GOOD_VALUES_YARM and performed OFFLOAD.
OMC alignment
For the OMC alignment, we followed the MEDM procedure as well. We requested IRY_LOCKED_FOR_OMC and then INCREASE_LAS_POW_FOR_OMC. We waited until the Guardian comment showed READY.
Then, we requested ALIGNING_TO_OMC. We monitored K1:OMC-TRANS_DC_SUM_OUT16. The value was around 30, which was acceptable. We note that a value larger than about 60 may be dangerous for the OMC DC PD.
Finally, we requested RECORD_GOOD_VALUES_OMC. After recording the good values, the OMC alignment state automatically went down.
PRMI alignment
For the PRMI alignment, we requested ALIGNING_PRMI following the MEDM procedure. At this step, ADS was engaged for IMMT2, PRM, and BS.
After the alignment became stable, we requested RECORD_GOOD_VALUES_PRMI and then performed OFFLOAD.
With Yokozawa-san
We performed the initial alignment for Xarm, Yarm, OMC and PRMI.
Detailed report.
Before starting the alignment work, we confirmed that all Type-A suspensions went to LOCK_ACQUISITION.
Xarm alignment
We followed the MEDM procedure for the Xarm alignment. First, we requested IRX_LOCKED, and then requested GRX_LOCKED_WITH_IRX. At this step, it took some time to lock the arm. Therefore, PR3 was slightly moved to improve the locking condition.
After that, we requested ALIGNING_XARM. Since the GRX transmitted power was not good enough, we manually adjusted ETMX and ITMX. As a result, the transmitted powers became approximately GRX ~ 0.96 and IRX ~ 0.95.
Then, we requested RECORD_GOOD_VALUES_XARM and performed OFFLOAD.
Yarm alignment
We also followed the MEDM procedure for the Yarm alignment. We requested IRY_LOCKED, GRY_LOCKED_WITH_IRY, and then ALIGNING_YARM. The alignment condition was already not bad, so we did not perform any manual adjustment.
Then, we requested RECORD_GOOD_VALUES_YARM and performed OFFLOAD.
OMC alignment
For the OMC alignment, we followed the MEDM procedure as well. We requested IRY_LOCKED_FOR_OMC and then INCREASE_LAS_POW_FOR_OMC. We waited until the Guardian comment showed READY.
Then, we requested ALIGNING_TO_OMC. We monitored K1:OMC-TRANS_DC_SUM_OUT16. The value was around 30, which was acceptable. We note that a value larger than about 60 may be dangerous for the OMC DC PD.
Finally, we requested RECORD_GOOD_VALUES_OMC. After recording the good values, the OMC alignment state automatically went down.
PRMI alignment
For the PRMI alignment, we requested ALIGNING_PRMI following the MEDM procedure. At this step, ADS was engaged for IMMT2, PRM, and BS.
After the alignment became stable, we requested RECORD_GOOD_VALUES_PRMI and then performed OFFLOAD.
[Smith, Hirose, Saito]
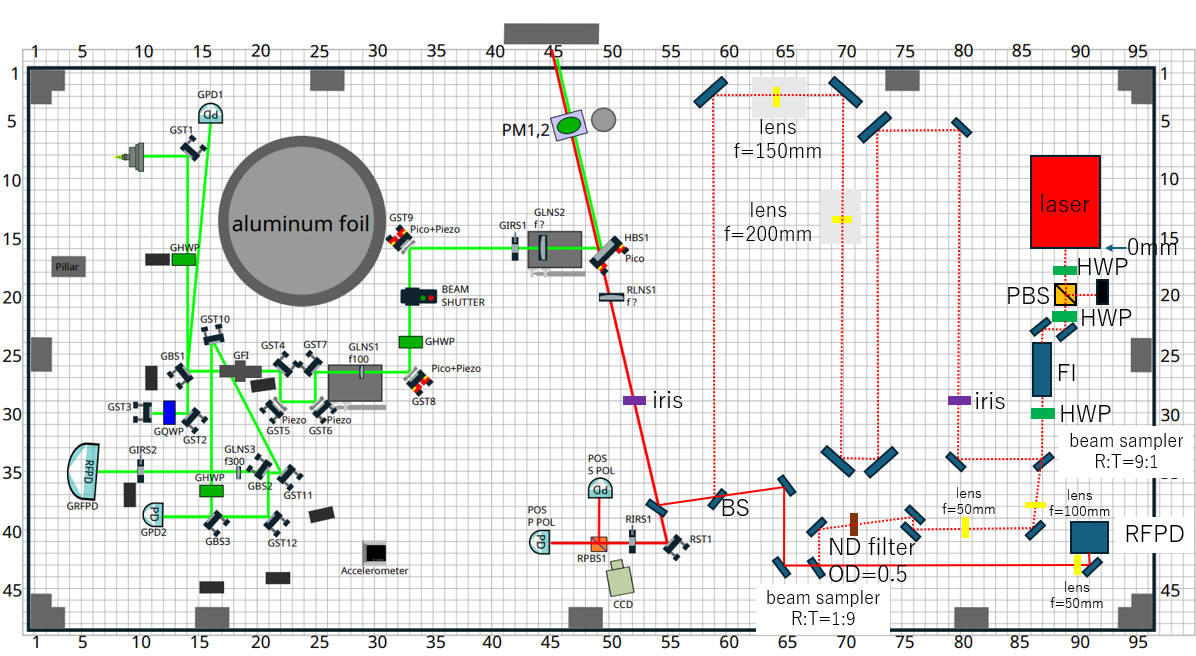
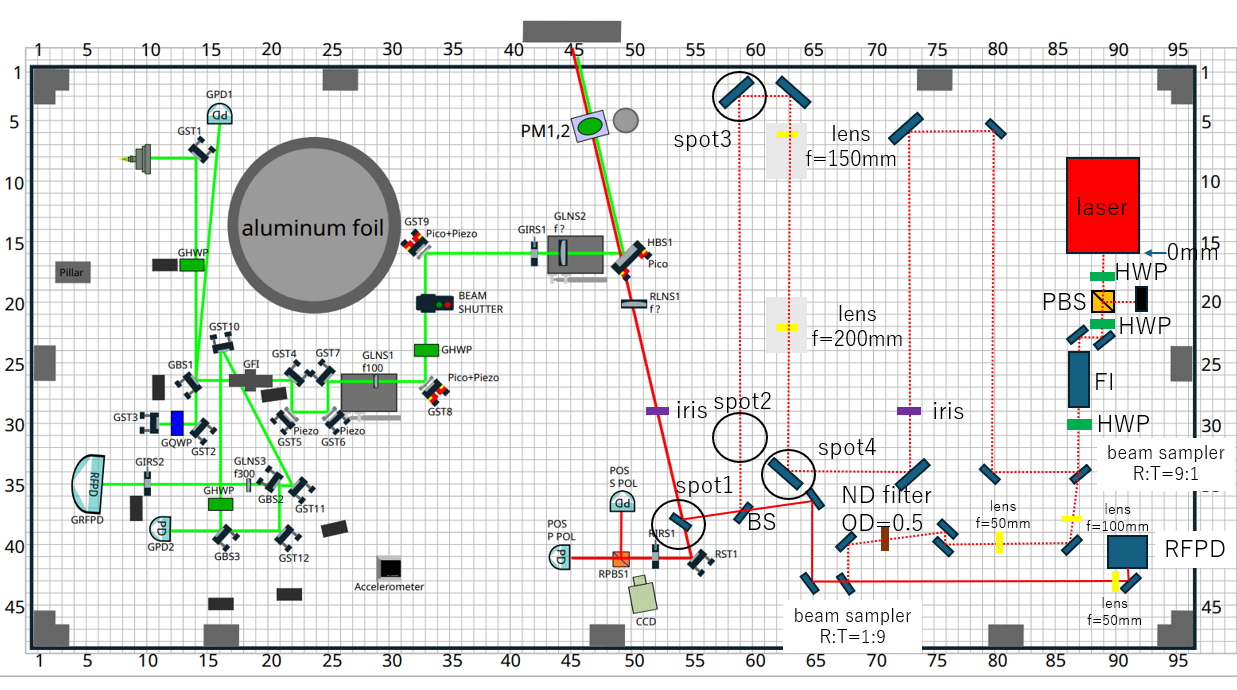
The optic that was identified as a BS in the previous experiment (klog:37052) was replaced with a mirror. In addition, while attempting to correct beam clipping on the edge of a mirror, it was found that the beam was not passing through the center of the 150 mm focal-length lens. Since the beam was laterally displaced, an attempt was made to move the lens sideways. However, due to the mounting configuration, the lens could not be translated laterally. Modifying the mount to allow lateral adjustment would likely cause interference with a nearby mirror and shift the lens from its original position. Therefore, it will be necessary to move the mirror instead. Furthermore, because two lenses were removed during the alignment procedure, mode matching must be redone. In addition, the short distance between the 150 mm focal-length lens and the nearby mirror, as well as the difficulty of adjusting the mirror near the lens, have led us to consider redesigning the optical layout.
- First, the optic at Spot 1 in the photograph, which had been identified as a BS in the previous experiment (klog:37052), was replaced with a mirror. (Please note that although a mount labeled "NON POL 50:50" was used, the optic itself is a mirror (HYD-10).) The alignment of the main laser was then readjusted, and the alignment of the sub-laser was performed using two irises.
- However, when the sub-laser power was measured at Spot 2 in the photograph, it was found to be approximately 830 mW. Therefore, Spot 3 was inspected, and it was discovered that the beam was clipping on the edge of a mirror. The alignment was then adjusted so that the main laser beam was centered on the mirror. However, under these conditions, when the beam was adjusted to pass through the center of the 200 mm focal-length lens, it clipped on the side edge of the mirror at Spot 4. To correct this, the alignment was adjusted using mirrors located upstream of the two lenses so that the beam would pass through the centers of both the lenses and the mirrors. However, this was not successful. It was suspected that the presence of the lenses was making the alignment process difficult, so the two lenses were temporarily removed. With the lenses removed, the beam was aligned to pass through the centers of the mirrors, and the 150 mm focal-length lens was then reinstalled. However, the beam became laterally displaced. An attempt was made to adjust the lateral position of the lens, but this was not possible because of the way the lens was mounted. Furthermore, modifying the mount to allow lateral adjustment appeared impractical because the lens was located very close to a mirror, making it difficult to reinstall the lens in its original position.
- Therefore, it will be necessary to move the mirror located before the lens. In addition, because the two lenses were removed, mode matching must be performed again. Considering this, together with the short distance between the 150 mm focal-length lens and the nearby mirror and the difficulty of adjusting the mirror in that region, we are considering redesigning the optical layout.

To align the Aux. beam axis with SRC axis more precisely, we would like to use the flash transmitted from SRC. We estimated the flash power on AS PD when 1W Aux. input power was injected from the SR2 AR side. The power just after trasmitting SRM seems to be ~65 uW and this beam is transmitted to AS port via OSTM (T = 3%). Then, the estimated power on AS DC PD is ~2 uW. Therefore, it maybe too low to obtain the flash with AS PD.
So we put new DC PD (Thorlabs, PDA100A2) in OMC REFL path for monitoring the flash instead of AS PD. The channel for OMC REFL DC is already existed (maybe it was used previously but now it is not used.). So I connected the new DC PD to the channel (K1:OMC-REFL_DC). I confirmed the PD response with DGS.
However, the alignment work on POS table seems not to be completed (Maybe Saito-kun reported detail later). So I put the beam dumper in front of the PD and blocked the beam by the dumper for now.
Some notes on the measurement setup:
1. For the single-bounce configuration, the following suspension states were requested:
PRM: MISALIGNED_BF
ITMX: MISALIGNED_BF
ETMY: MISALIGNED
SRM: MISALIGNED
All others: LOCK_ACQUISITION
2. In the case of locking with 7.8 mW and 16.2 mW on DC PD B, OMMT2 and OSTM were actively controlled to optimize their alignment using the in-vacuum OMC QPDs, whereas no alignment control was applied during locking with 1.6 mW.
This is because the alignment control using the in-vacuum OMC QPDs did not work well due to the very low power on the OMC QPDs; however, this is expected to have little impact on the results.
We did a (weak) health check of the OMC DC PD B and saw no signs of excess noise in the dark state or in the single bounce configuration.
In klog 36277, excess noise was seen on DC PD B following a lock loss on February 3, 2026. In klog 36569, later in March 2026, DC PD B showed no excess dark noise. So did DC PD B have some intermittent noise that went away? Or could it have some damage that only makes excess noise when there is a DC power? We tried to test this by looking again at the dark noise and comparing with the noise in a single bounce configuration (IMC locked, ITMX misaligned).
Dark noise:
9/6/2026 05:38:30 UTC dark noise: shutter closed, 1 stage whitening transimpedence 400 ohm (to match settings in klog 36569)
The DC PD dark noise agrees with previous measurements made in klog36569. No excess noise in DC PD B.
Single bounce:
OMC locked with single bounce configuration, OMC DCPD settings the same as above.
9/6/2026 05:47:40 UTC Single bounce with 7.8mW on DCPD B.
The noise here of 1.4e-7 mW/rt(Hz) is higher than shot noise (7.8mW should give a shot noise of 5.4e-8 mW/rt(Hz)).
To double check that this is not shot noise, we increased power by a factor of 2 and look at how the noise scales.
9/6/2026 05:56:20 UTC Single bounce with 16.2mW of power on DCPD B.
The noise scales close to linearly. Turning the power up a factor of (both in mW): 16.2/7.8 = 2.08 the high frequency noise went up a factor (both in e-7 mW/rt(Hz)) 2.8/1.4 = 2. So there is some noise on the light hitting the DC PDs that’s scaling close to linearly with power. We’re not sure what the source of that noise is.
So we try to reduce the linear noise by reducing the power on the DC PDs. Locked OMC with IMC output of 0.9W.
10/6/2026 00:21:45 UTC Single bounce with 1.6mW on DC PD B.
Using the photodiode powers for DC PD B, we can make some estimates for the various noise components, comparing the 7.8mW and the 1.65mW single bounce cases.
The power (mW) reduced by factor 7.8/1.65 = 4.7
The unknown linear noise should now be at the level 1.4e-7/4.7=2.98e-8 mW/rt(Hz)
The shot noise for 1.65mW should be 2.48e-8 mW/rt(Hz)
The dark noise was measured to be 1.4e-8 mW/rt(Hz)
So for 1.65mW on DC PD B, the quadrature sum of dark+shot+linear = sqrt(2.48^2+2.98^2+1.4^2) = 4.122 e-8 mW/rt(Hz)
And we measure just a little higher, about 5e-8 mW/rt(Hz). Pretty close to shot+dark+linear noise.
From these tests, there is not any evidence of excess noise in OMC PD B. But the unknown linearly-scaling noise on the light in the single bounce configuration isn’t allowing us to make a shot-noise-limited test.

Some notes on the measurement setup:
1. For the single-bounce configuration, the following suspension states were requested:
PRM: MISALIGNED_BF
ITMX: MISALIGNED_BF
ETMY: MISALIGNED
SRM: MISALIGNED
All others: LOCK_ACQUISITION
2. In the case of locking with 7.8 mW and 16.2 mW on DC PD B, OMMT2 and OSTM were actively controlled to optimize their alignment using the in-vacuum OMC QPDs, whereas no alignment control was applied during locking with 1.6 mW.
This is because the alignment control using the in-vacuum OMC QPDs did not work well due to the very low power on the OMC QPDs; however, this is expected to have little impact on the results.
After the calibration work, we moved the RxPD back to its nominal position and found that its output had changed from the pre-work value. We investigated the cause and found that the alignment between the integrating sphere and the plate underneath it had slightly shifted. We realigned the integrating sphere with the plate, and the RxPD output returned almost to its original value.
[Tanaka, Hirose, Saito]
A 10 dB attenuator was added, reducing the beat signal level from 23 dBm to 10 dBm. The open-loop transfer function of the PLL was then measured. The results suggest that the sub-laser PZT responds with a frequency change to the frequency-difference signal from the PFD, rather than responding with a frequency change to a phase-difference signal. In addition, the alignment of the sub-laser beam incident on SRY was performed using two irises. The sub-laser PZT was then driven, but no flashes were observed at the AS port. This is likely because one of the optics expected to be a mirror was actually a BS, the beam was clipping on the edge of a mirror, and the observation was being made at the AS port. In the next experiment, the BS will be replaced with a mirror, the alignment will be redone, and a PD will be installed at the OMC reflection port to observe the flashes.
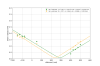
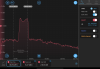
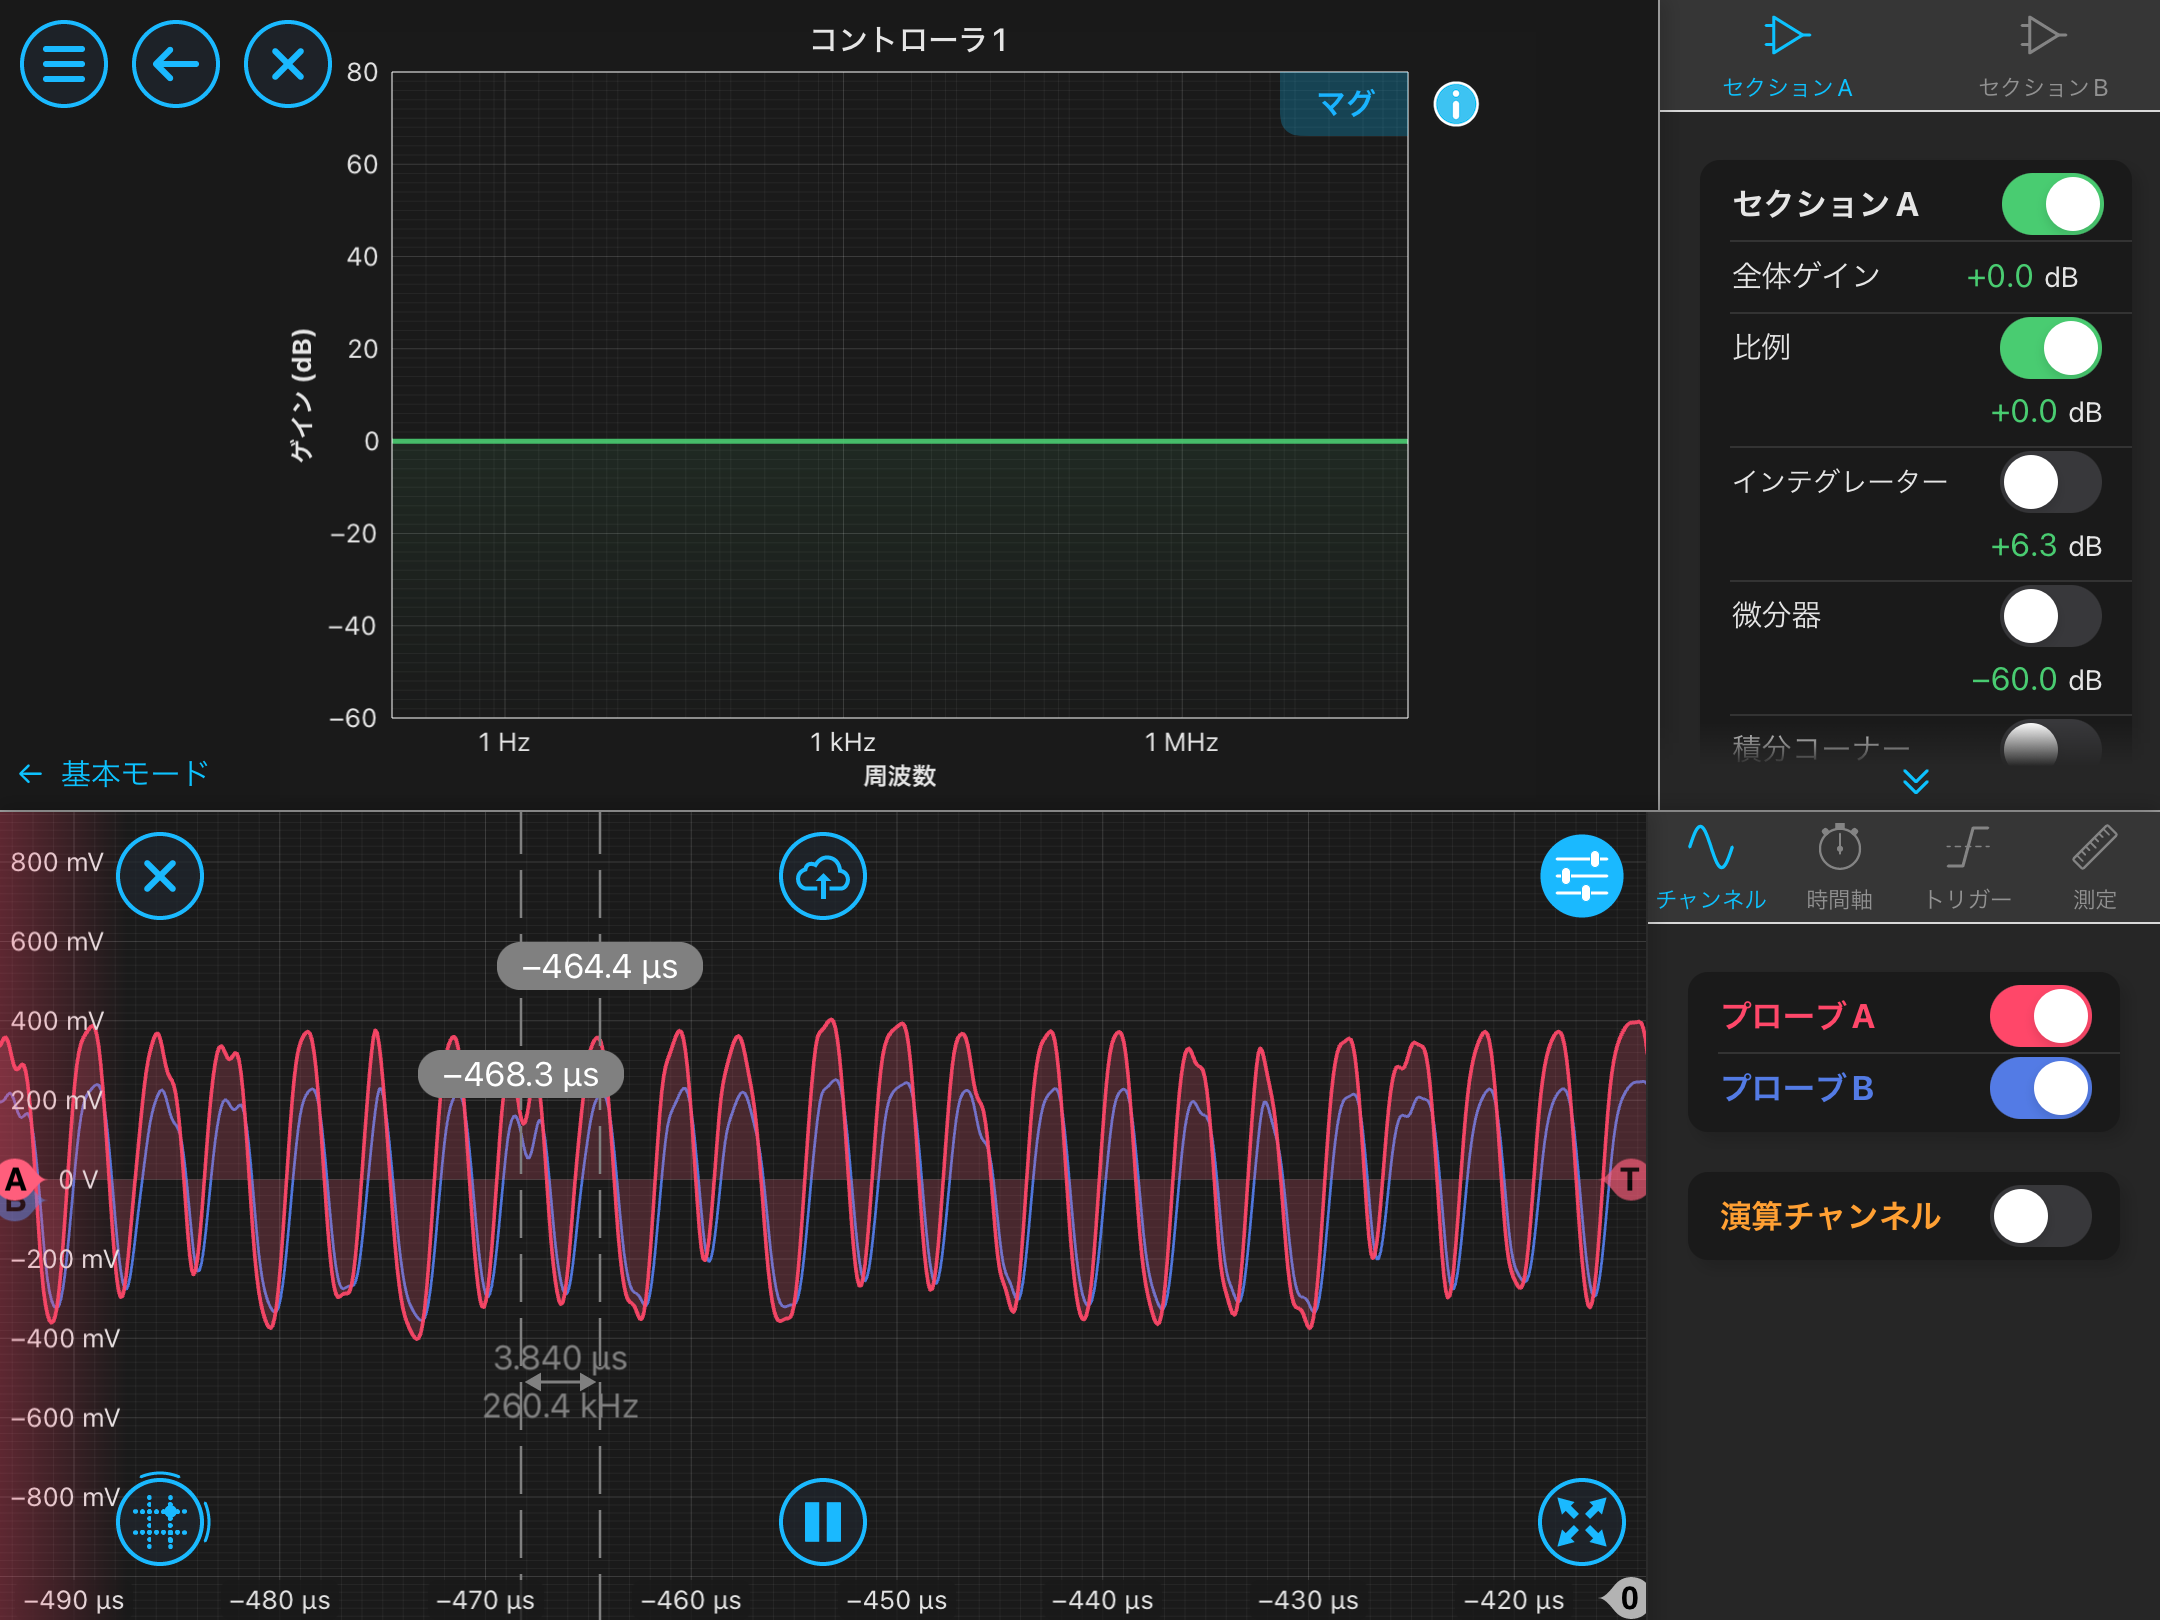
- First, a 10 dB attenuator was added to reduce the input power to the PFD. As a result, the beat signal level decreased from 23 dBm to 10 dBm. Next, the 1 MHz low-pass filter in the SR560 used for feedback to the sub-laser PZT was replaced with either a 100 kHz or a 10 kHz low-pass filter. Under these conditions, the approximately 260 kHz oscillation previously observed in the error signal (klog:37046) disappeared. The open-loop transfer function was then measured, revealing a flat region. This was unexpected. We had assumed that the feedback loop operated by changing the sub-laser frequency via the PZT to eliminate the phase difference, which should behave as an integrator. However, the observation is consistent with the PFD producing a frequency-difference signal and the sub-laser PZT responding with a frequency change. Therefore, a 10 kHz low-pass filter was applied in the SR560 feedback path to the sub-laser PZT, and the gain and integrator cutoff frequency in Moku:Lab were varied. The measured open-loop transfer function then closely matched the designed filter response (Photo 1).
-
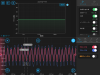
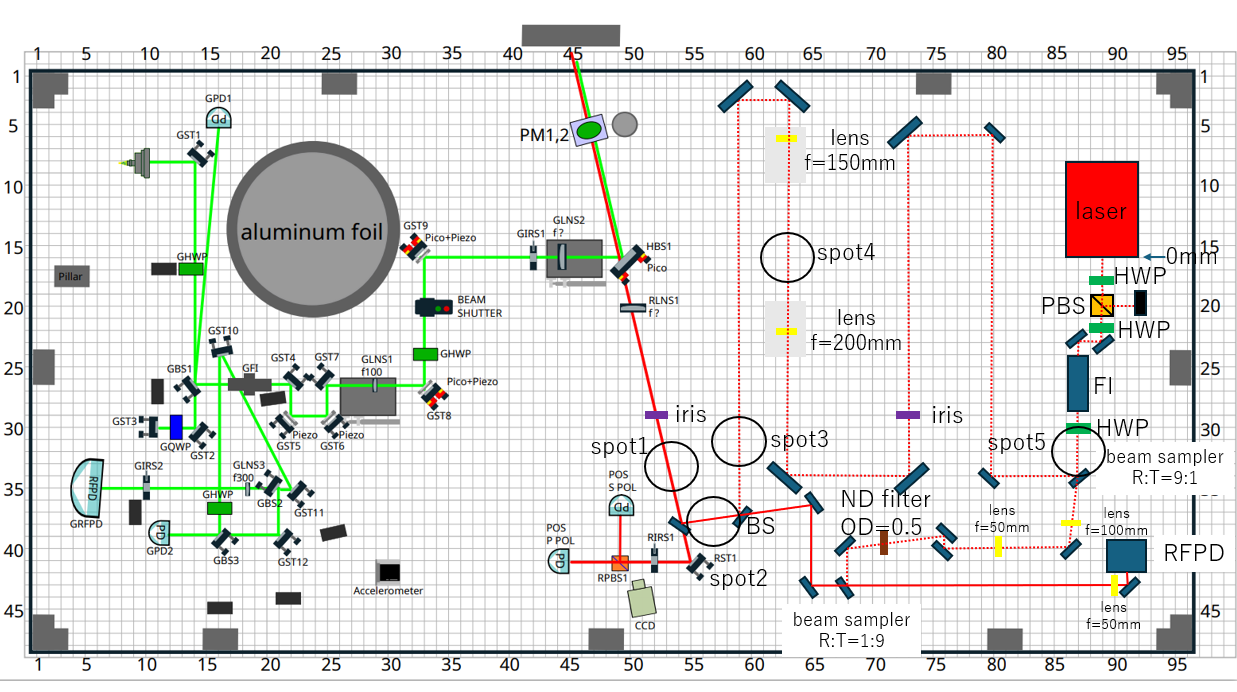
Next, the mirrors were adjusted so that the main laser beam followed the optical path intended for the sub-laser beam entering the interferometer. Two irises were then installed along this path and aligned to the main laser beam. The sub-laser alignment was subsequently adjusted so that it also passed through the two irises. The main laser was then blocked, leaving only the sub-laser beam incident on SRY. The sub-laser PZT was driven with a triangular waveform generated by the Moku:Lab function generator, and the AS port was monitored for flashes. However, no flashes were observed. This is likely because the optical power incident on SRY was too low. The laser powers measured at Spots 1~5 in Photo 2 were as follows:
Spot 1: approximately 130 mW
Spot 2: approximately 390 mW
Spot 3: approximately 780 mW
Spot 4: approximately 1.0 W
Spot 5: approximately 1.1 WFrom these measurements, the laser power incident on SRY is estimated to be approximately 130 mW, which corresponds to only about 0.25 μW at the AS port. Such a small signal is likely buried in noise. The reduction in laser power between Spot 2 and Spot 1 occurred because the optic between them was a BS rather than a mirror. In addition, the reduction in power between Spot 4 and Spot 3 may be due to the beam clipping on the edge of the mirror.
-
Therefore, in the next experiment, the BS between Spot 2 and Spot 1 will be replaced with a mirror, and the alignment will be adjusted so that the beam does not clip on the edge of the mirror between Spot 4 and Spot 3. However, even after these modifications, the power at the AS port is expected to increase only to approximately 0.97 μW. Therefore, a PD will be installed at the OMC reflection port, and flashes will be monitored there instead.


KAGRA Pcal-X updates (2026/06/09)
Workers: Dan Chen, Jiahui Xiong, Misato Onishi
We performed monthly Pcal-X calibration on 2026/06/09.
After the calibration, we updated EPICS parameters related to the Pcal-X system. No issues were found.
| EPICS Key | Before | After | Δ (After − Before) |
|---|---|---|---|
| K1:CAL-PCAL_EX_1_OE_R_SET | 0.98353 | 0.98379 | 0.00027 |
| K1:CAL-PCAL_EX_1_OE_T_SET | 0.98353 | 0.98379 | 0.00027 |
| K1:CAL-PCAL_EX_1_PD_BG_RX_V_SET | -0.00390 | -0.00384 | 0.00006 |
| K1:CAL-PCAL_EX_1_PD_BG_TX_V_SET | 0.00483 | 0.00477 | -0.00006 |
| K1:CAL-PCAL_EX_1_RX_V_R_SET | 0.50217 | 0.50205 | -0.00012 |
| K1:CAL-PCAL_EX_2_INJ_V_GAIN | 0.95152 | 0.95265 | 0.00113 |
| K1:CAL-PCAL_EX_2_OE_R_SET | 0.97404 | 0.97473 | 0.00069 |
| K1:CAL-PCAL_EX_2_OE_T_SET | 0.97404 | 0.97473 | 0.00069 |
| K1:CAL-PCAL_EX_2_PD_BG_TX_V_SET | 0.00389 | 0.00389 | 0.00000 |
| K1:CAL-PCAL_EX_2_RX_V_R_SET | 0.49783 | 0.49795 | 0.00012 |
| K1:CAL-PCAL_EX_WSK_PER_RX_SET | 1.49025 | 1.49085 | 0.00060 |
| K1:CAL-PCAL_EX_WSK_PER_TX1_SET | 0.52750 | 0.52749 | -0.00001 |
| K1:CAL-PCAL_EX_WSK_PER_TX2_SET | 0.38816 | 0.38837 | 0.00021 |


After the calibration work, we moved the RxPD back to its nominal position and found that its output had changed from the pre-work value. We investigated the cause and found that the alignment between the integrating sphere and the plate underneath it had slightly shifted. We realigned the integrating sphere with the plate, and the RxPD output returned almost to its original value.
A CAL Tcam session was performed to obtain beam position information necessary for Pcal. The parameters have already been updated, and SDF has been accepted.
Operator: Dan Chen
Update Time: 2026/06/09 05:54:18
| EPICS Key | Before [mm] | After [mm] | Δ (After - Before) [mm] |
|---|---|---|---|
| K1:CAL-PCAL_EX_TCAM_PATH1_X | -0.87474 mm | -2.41683 mm | -1.54209 mm |
| K1:CAL-PCAL_EX_TCAM_PATH1_Y | 66.37439 mm | 65.57365 mm | -0.80074 mm |
| K1:CAL-PCAL_EX_TCAM_PATH2_X | -0.37755 mm | 1.41852 mm | +1.79607 mm |
| K1:CAL-PCAL_EX_TCAM_PATH2_Y | -67.02710 mm | -66.64088 mm | +0.38622 mm |
Update Time: 2026/06/09 05:54:58
| EPICS Key | Before [mm] | After [mm] | Δ (After - Before) [mm] |
|---|---|---|---|
| K1:CAL-PCAL_EY_TCAM_PATH1_X | 0.76950 mm | -0.69068 mm | -1.46018 mm |
| K1:CAL-PCAL_EY_TCAM_PATH1_Y | 65.80570 mm | 62.58426 mm | -3.22144 mm |
| K1:CAL-PCAL_EY_TCAM_PATH2_X | 1.39102 mm | 0.14883 mm | -1.24219 mm |
| K1:CAL-PCAL_EY_TCAM_PATH2_Y | -69.21742 mm | -69.03655 mm | +0.18087 mm |
Similar work: klog#36572 (IX1), klog#36625 (IY1), klog#36654 (EX0), klog#36692 (EY0), klog#36909 (EX1)
Preparation for this work: klog#36986
IO chassis for K1EX1 was replaced from V1 (S1706995) to V2 (S2416122) chassis.
All PCIe boards were just moved from V1 to V2 chassis with keeping their card numbers on the real time models.
There was no PCIe problem on this work.
Because IRIG-B issue was occurred, IRIG-B card was also replaced as one without any issue on the test bench.
After replacement work, We confirmed VIS_ETMY can reach ALIGNED and MISALIGNED states.
ADC/DAC noise measurement will be done in the next week.
[Tanaka, Hirose, Saito]
Using the 20 dB RF amplifier and the 40 dB RF amplifier, the beat signal amplitude was increased to 23 dBm. After replacing the phase detector with a Phase Frequency Discriminator (PFD), it was confirmed that the beat signal frequency followed changes in the LO frequency. However, the error signal appeared to oscillate at approximately 260 kHz. This oscillation may be caused by a resonance of the sub-laser PZT.
-
First, the alignment was adjusted to maximize the beat signal. The signal level under various RF amplifier configurations was as follows:
No RF amplifier: -51 dBm
40 dB RF amplifier only: -5 dBm
20 dB RF amplifier only: -20 dBm
40 dB RF amplifier followed by the 20 dB RF amplifier: 8 dBm
20 dB RF amplifier followed by the 40 dB RF amplifier: 23 dBm
-
Therefore, lock acquisition was attempted using the phase detector with the 20 dB RF amplifier followed by the 40 dB RF amplifier. A 1 MHz low-pass filter was applied in the SR560 used for feedback to the sub-laser PZT, while a flat filter was implemented in Moku:Lab. Various gains and integrator settings were tested. However, no behavior indicating that the beat frequency was being pulled toward the LO frequency was observed.
-
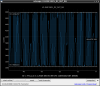
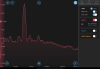
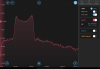
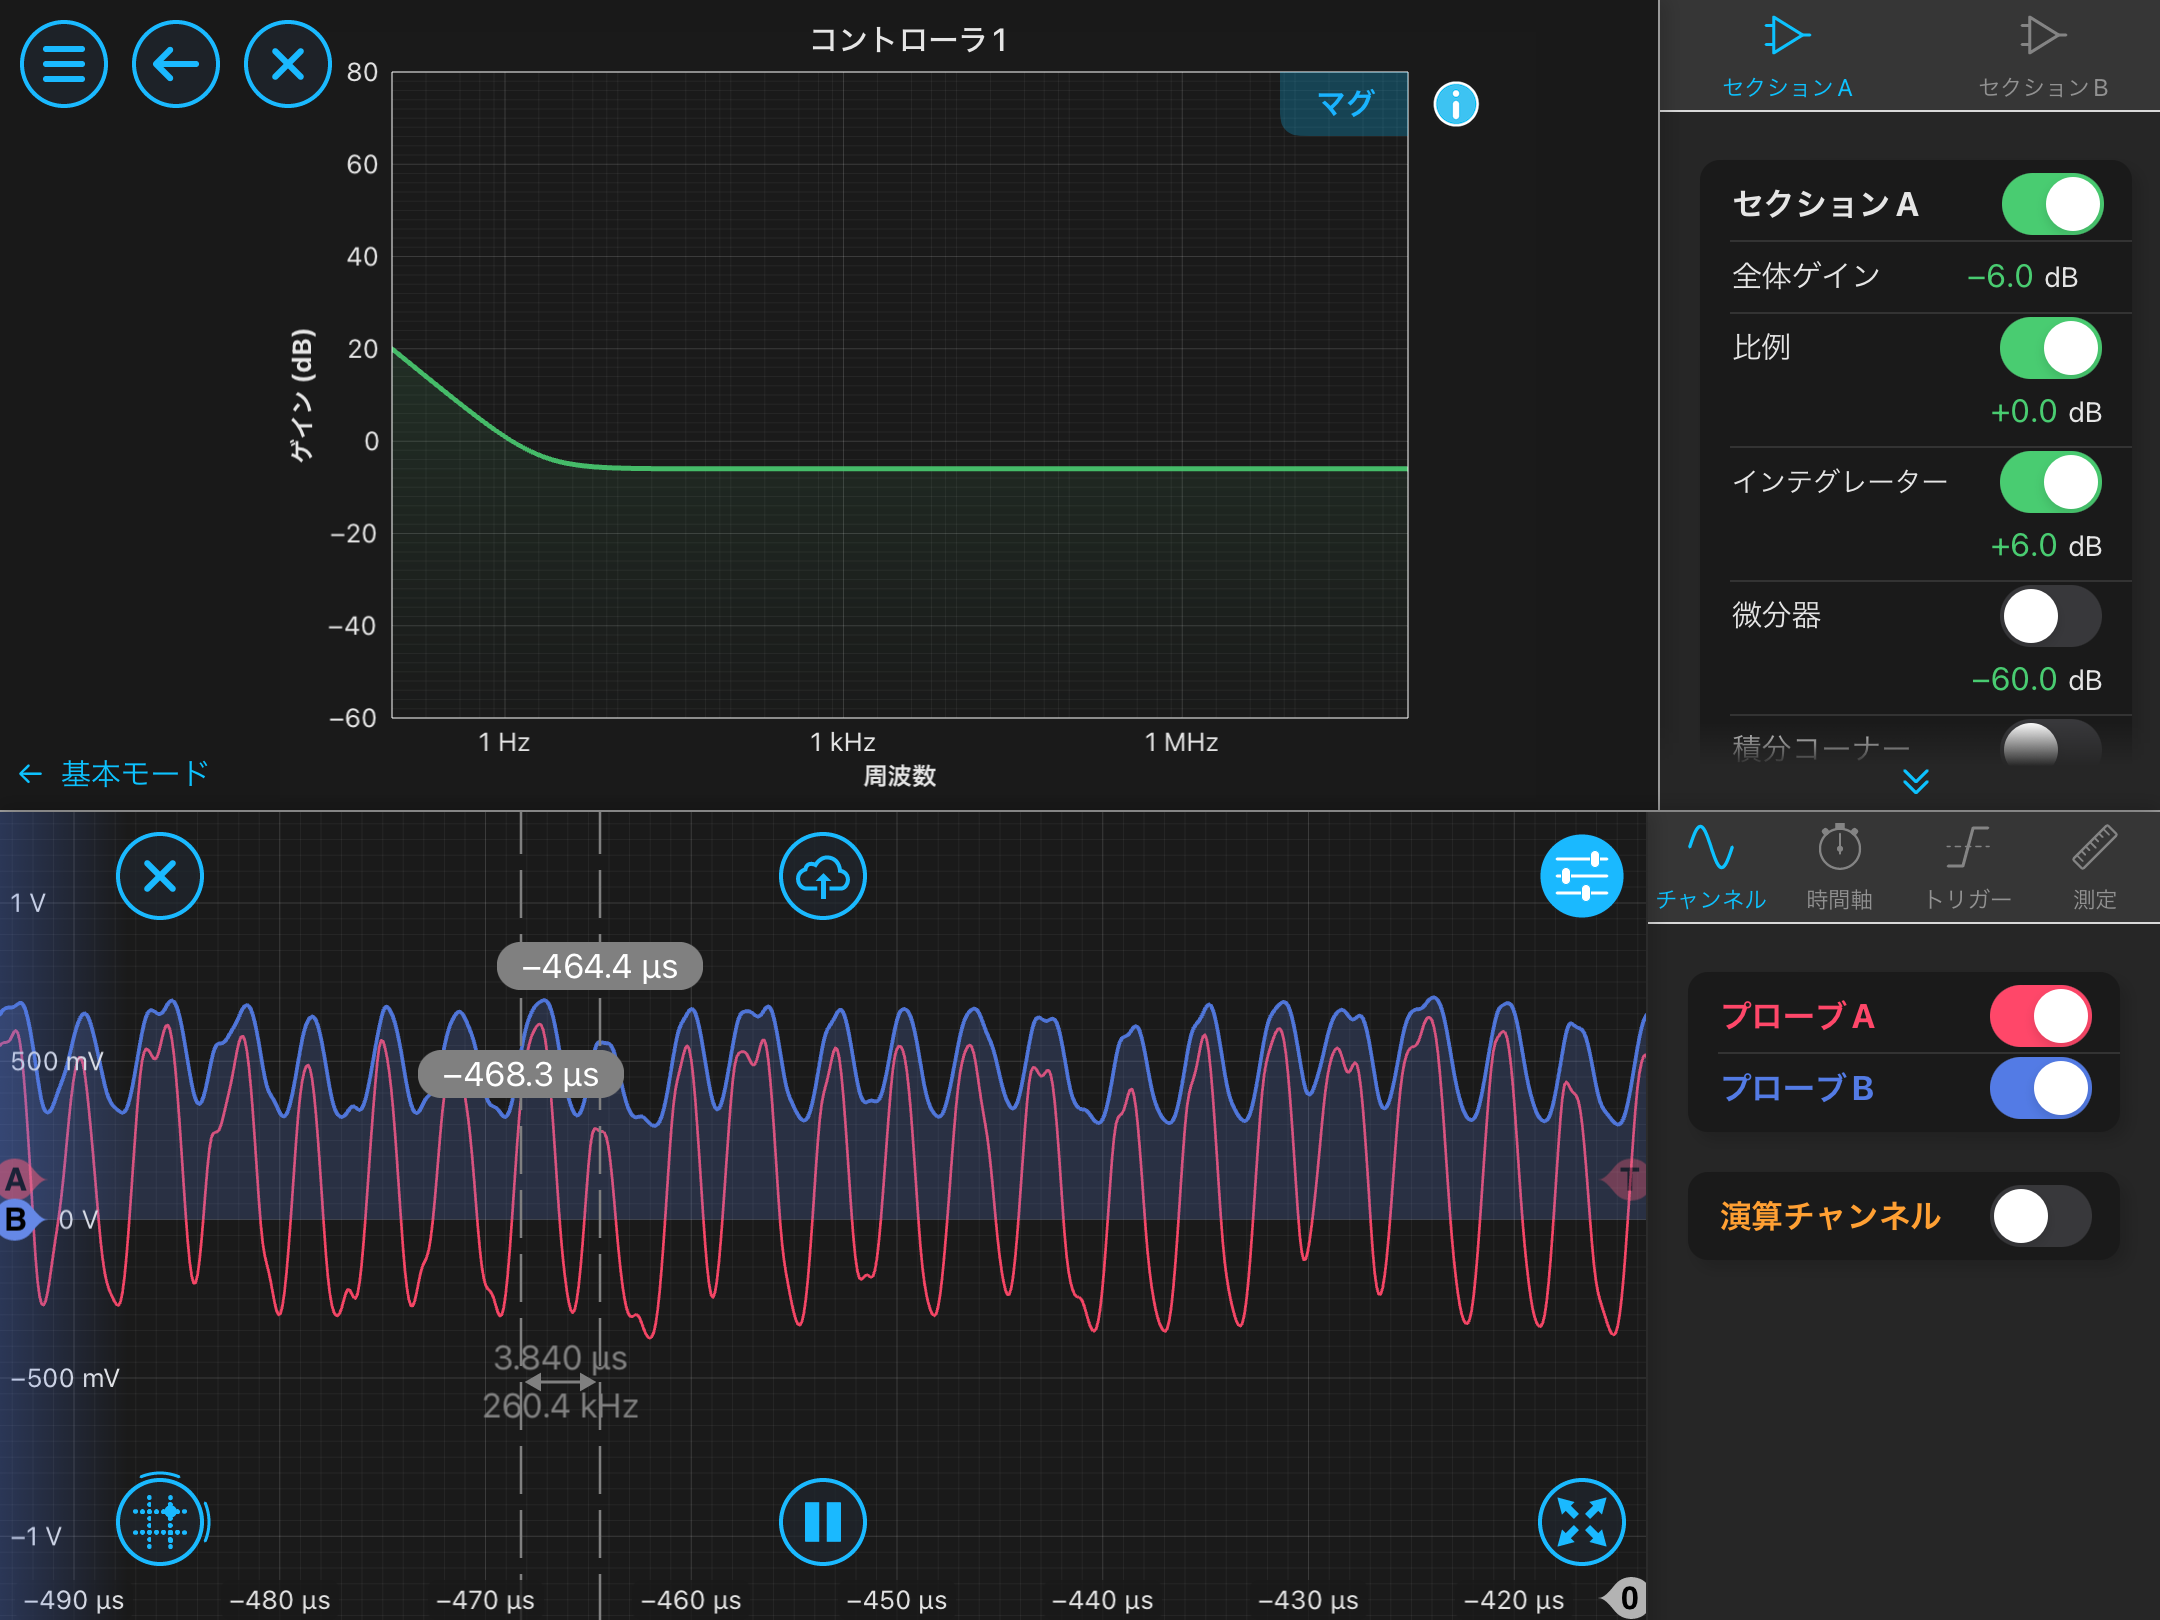
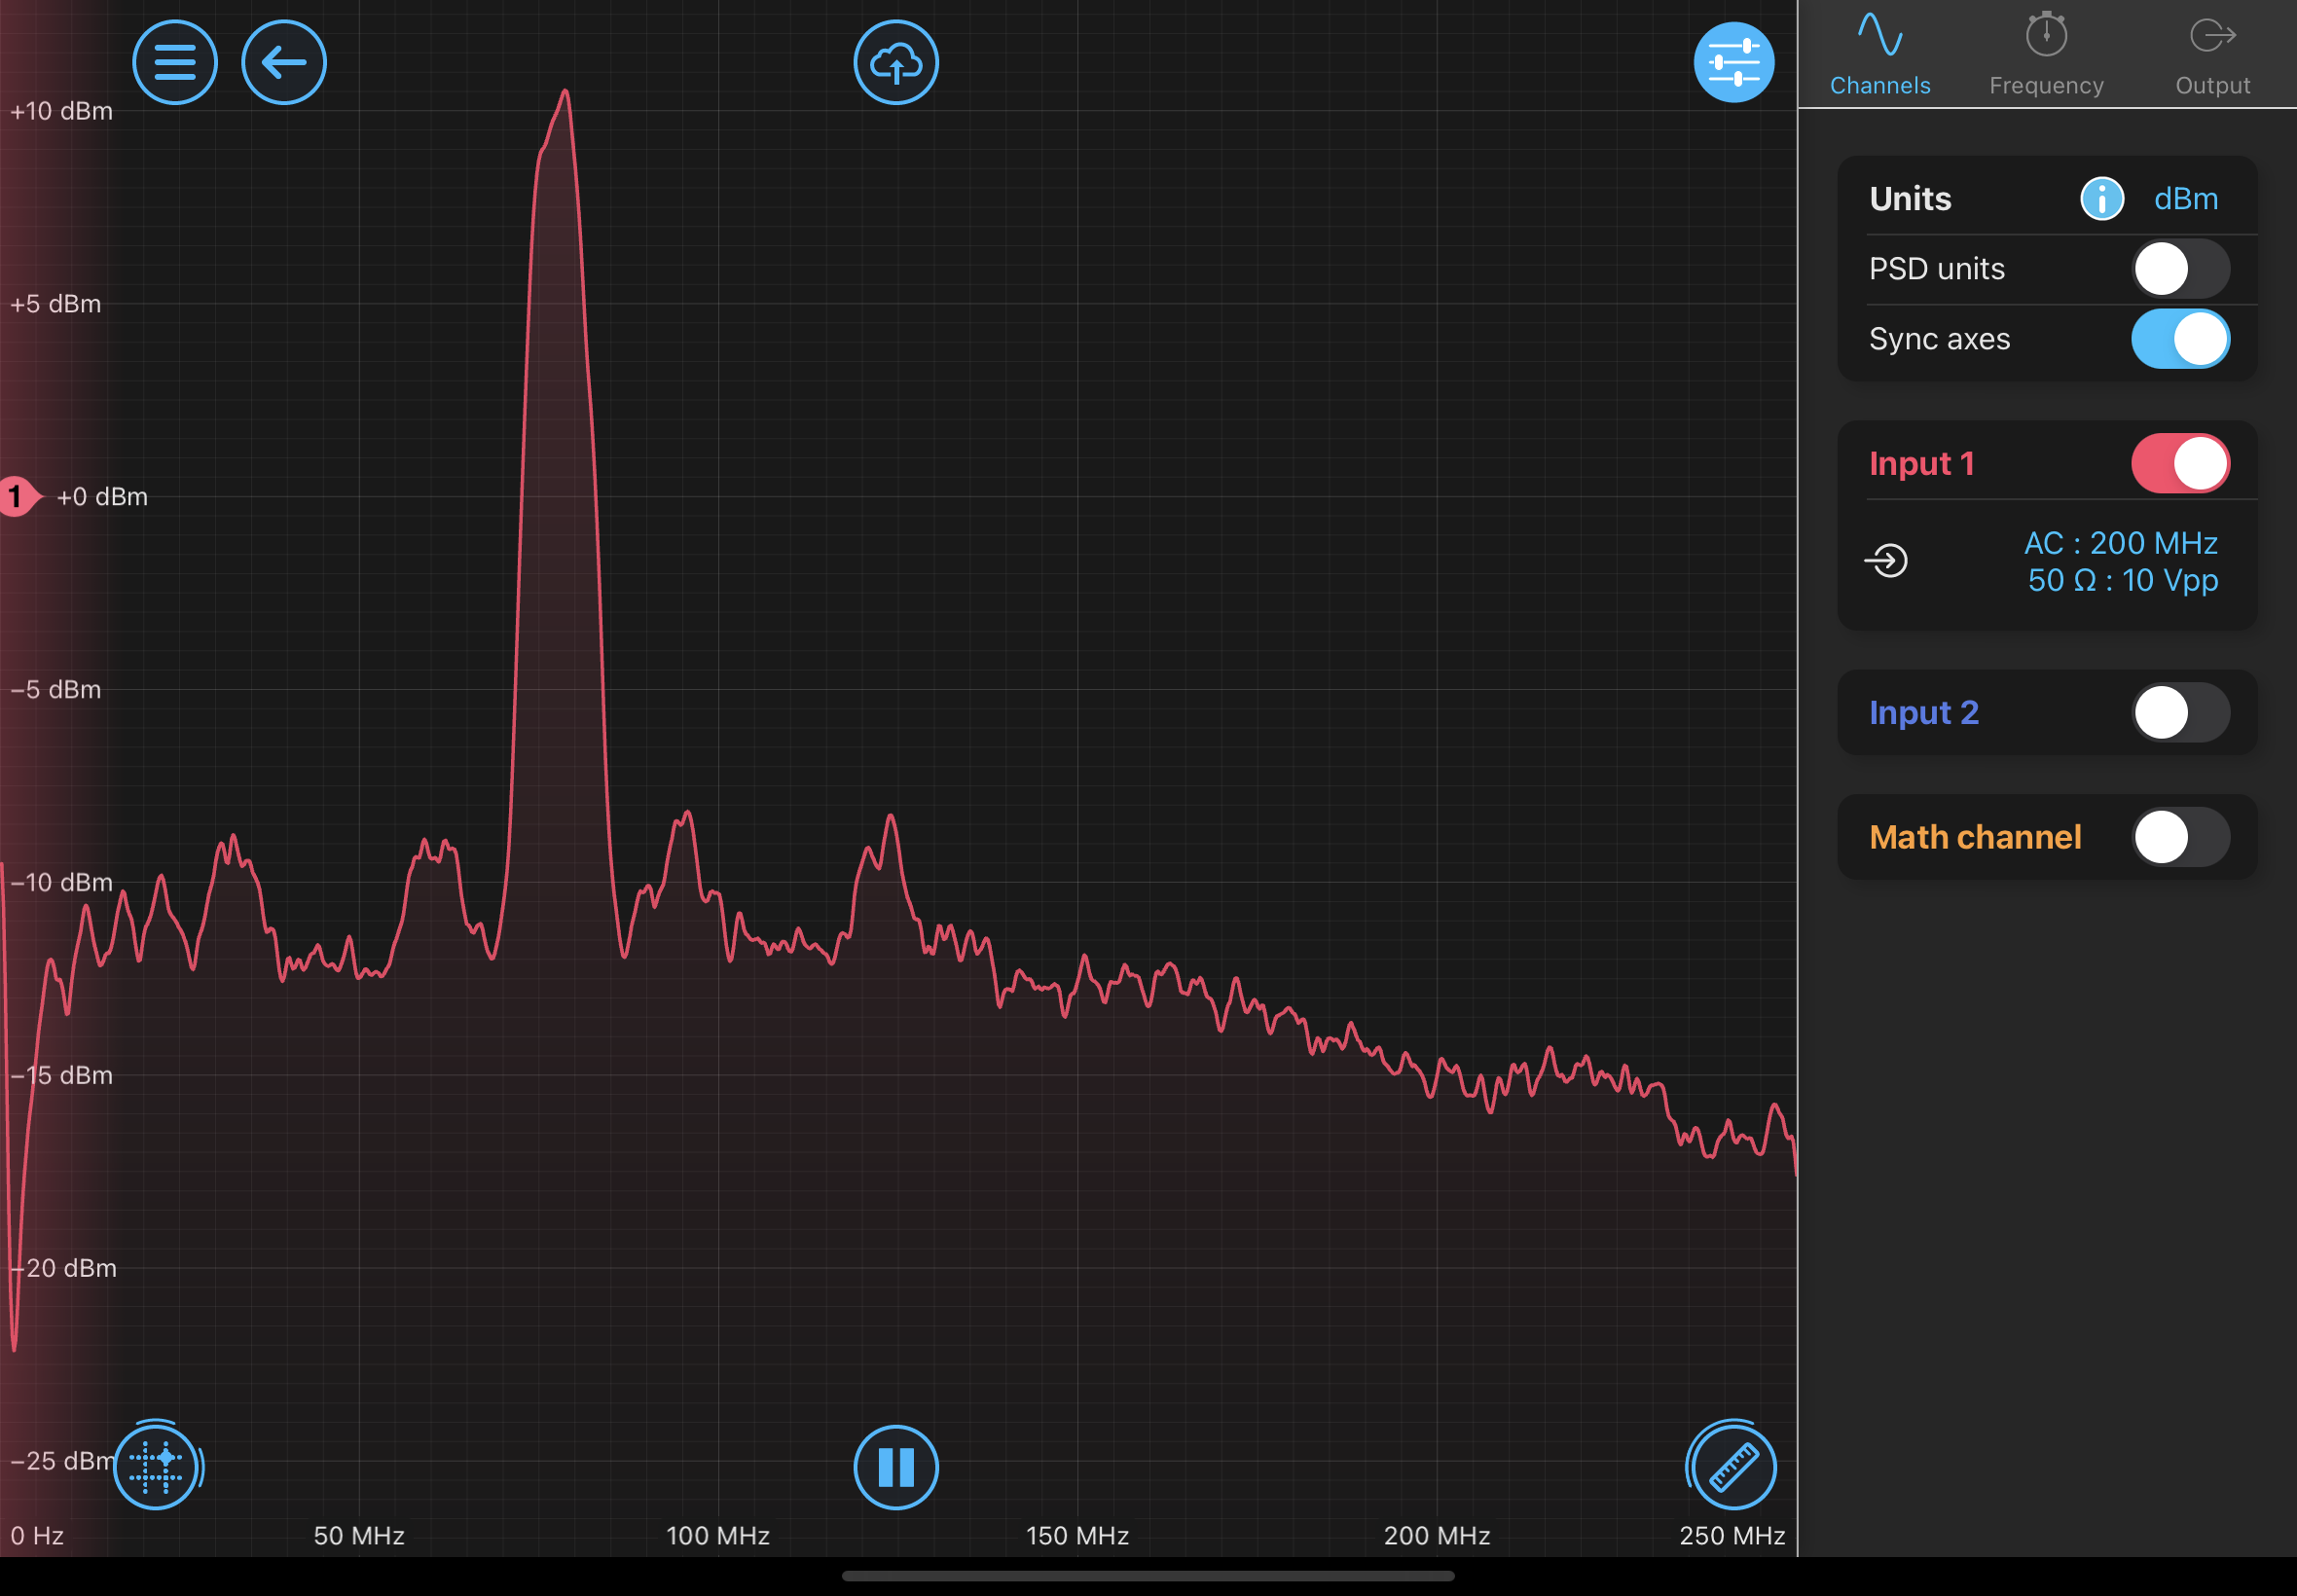
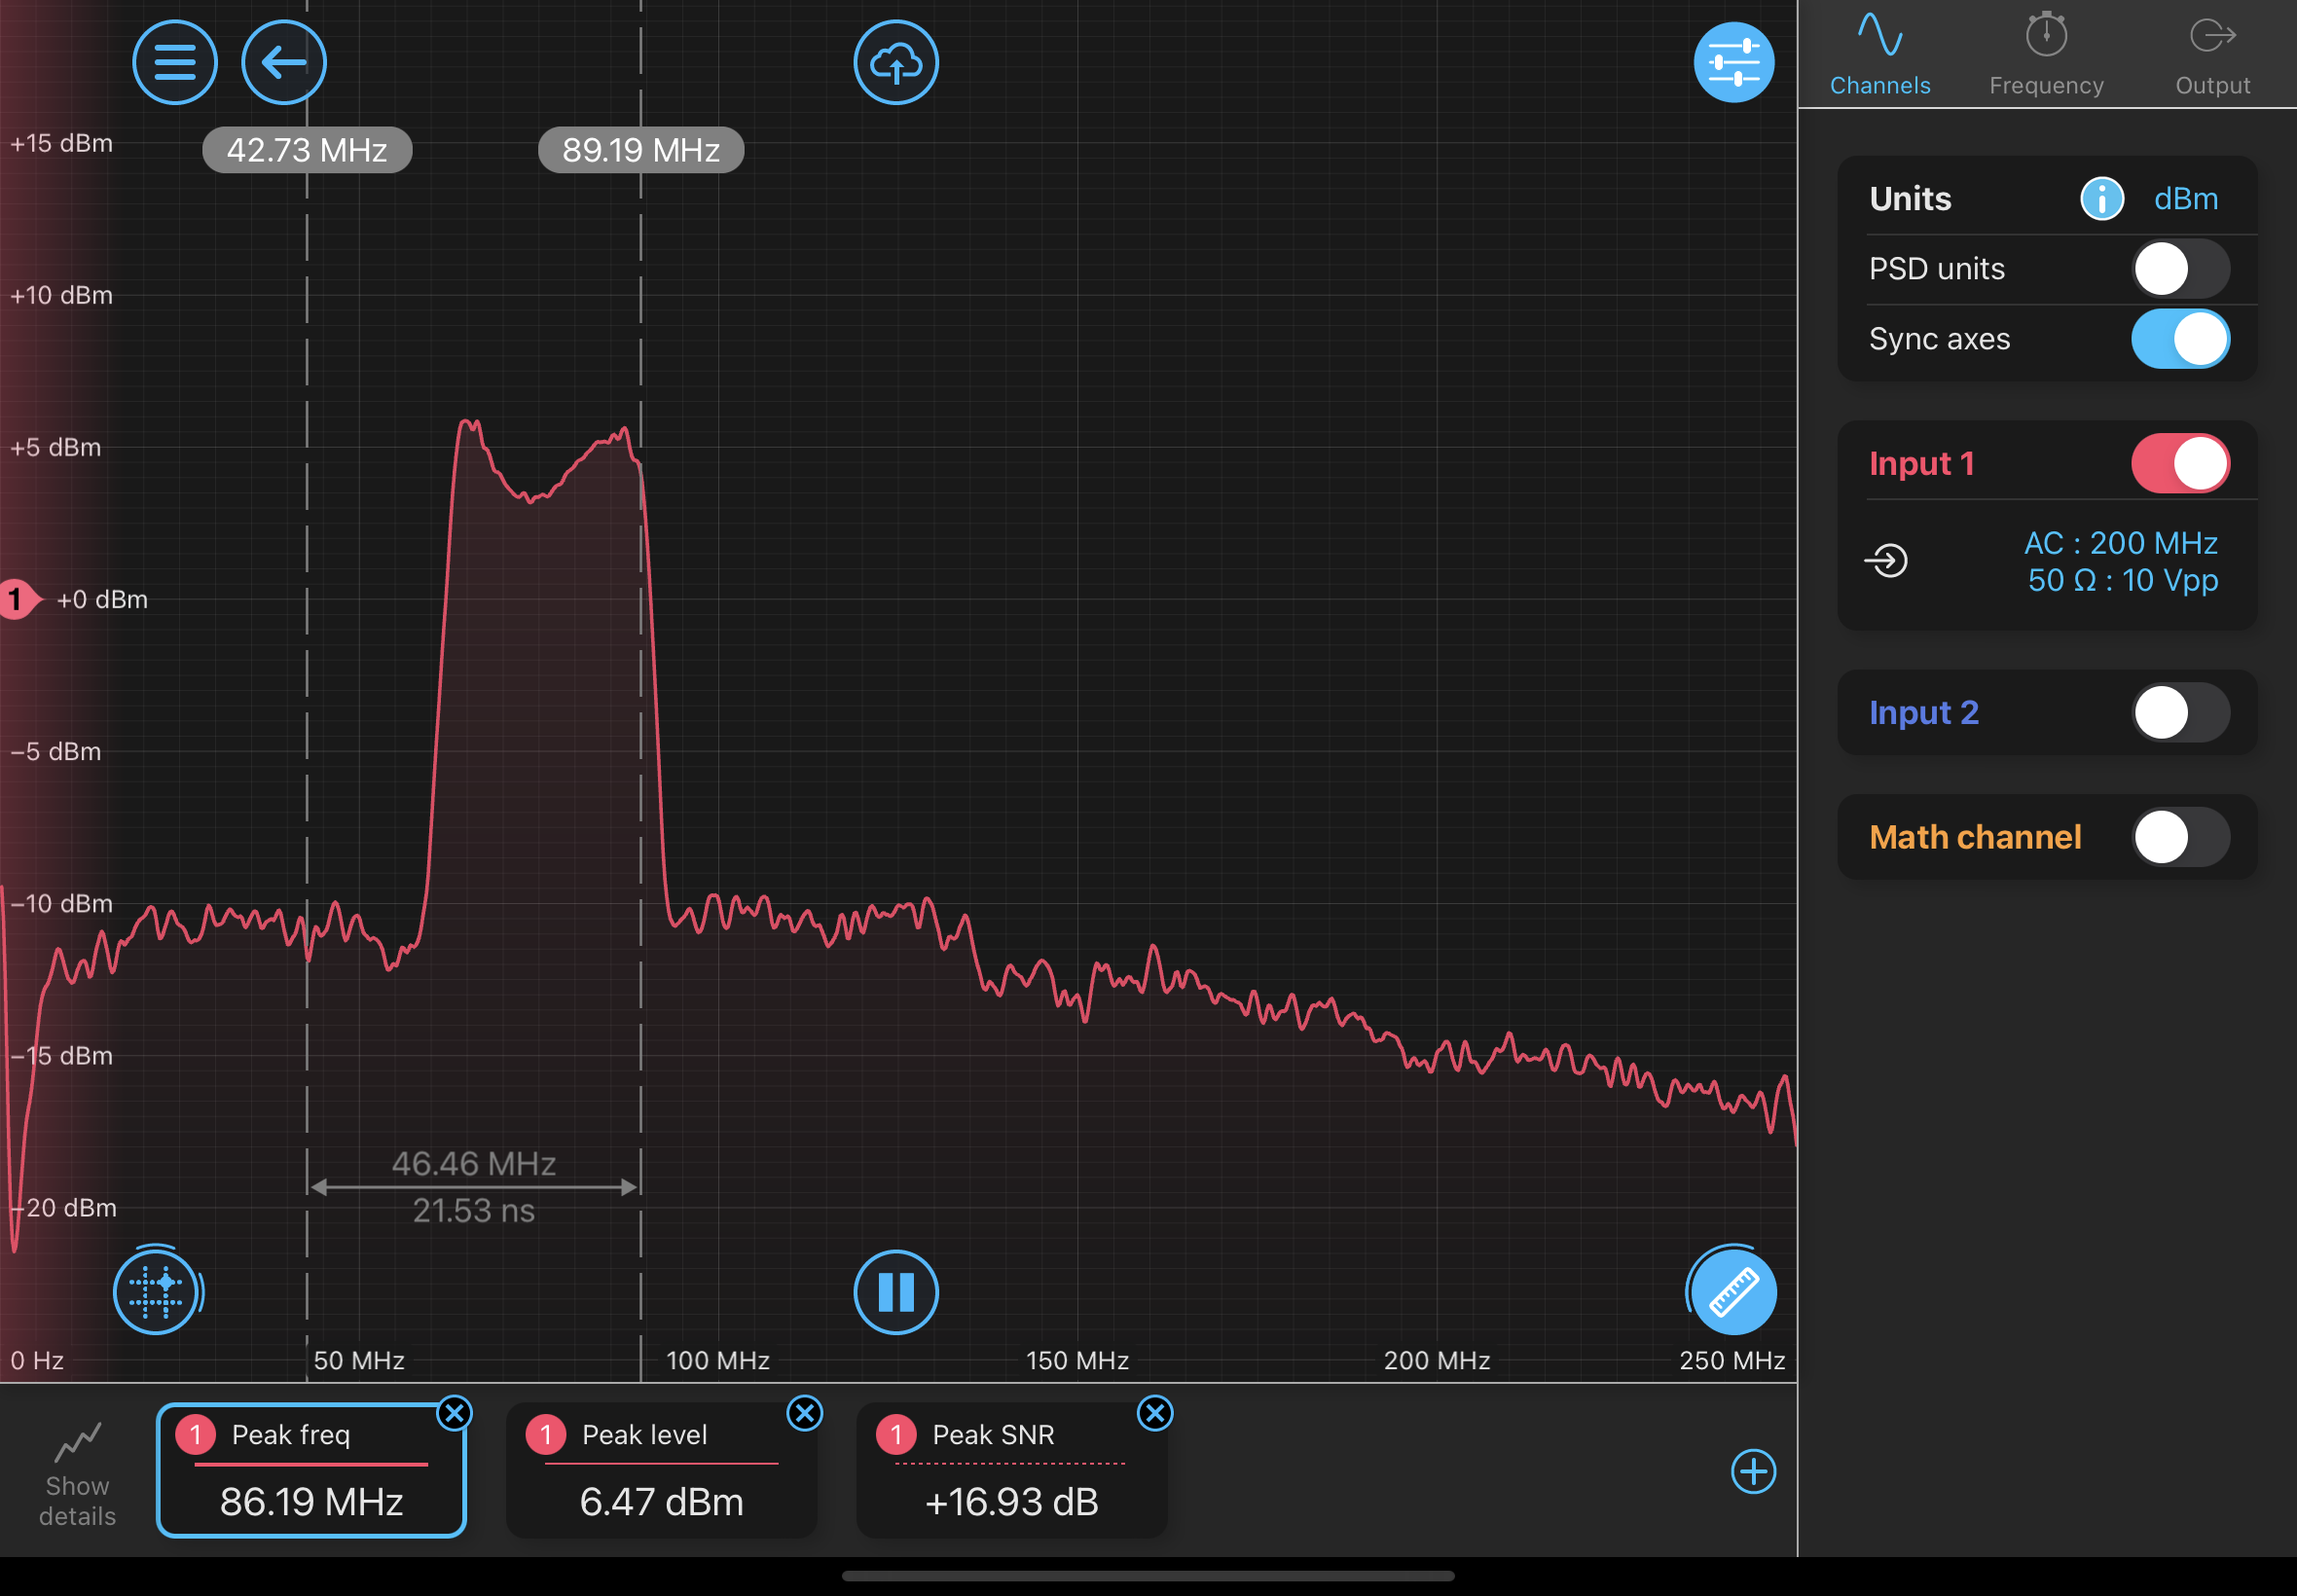
Next, the phase detector was replaced with a PFD. With a filter consisting of an overall gain of -6 dB and an integrator providing 6 dB of gain at 1 Hz (Photo 1), it was observed that the beat signal frequency followed changes in the LO frequency. In the lower plot of Photo 1, the red trace represents the error signal and the blue trace represents the feedback signal. Since the feedback signal changed when the LO frequency was varied, the LO frequency and beat signal frequency were measured for feedback signal levels of approximately 0 V and ±1 V. The beat signal spectrum exhibited a shape with a dip at the center and peaks on both sides (Photo 2). Therefore, the frequencies of the two peaks were measured, and their average was taken as the beat signal frequency. In Photo 2, the light red trace corresponds to a feedback signal of approximately +1 V, while the red trace corresponds to a feedback signal of approximately -1 V.
The results are summarized below:
Feedback Signal LO Frequency Beat Signal Frequency
Approximately -1 V 85.066 MHz 85.16 MHz
Approximately 0 V 88.066 MHz 87.99 MHz
Approximately +1 V 89.666 MHz 89.74 MHz
-
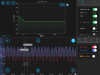
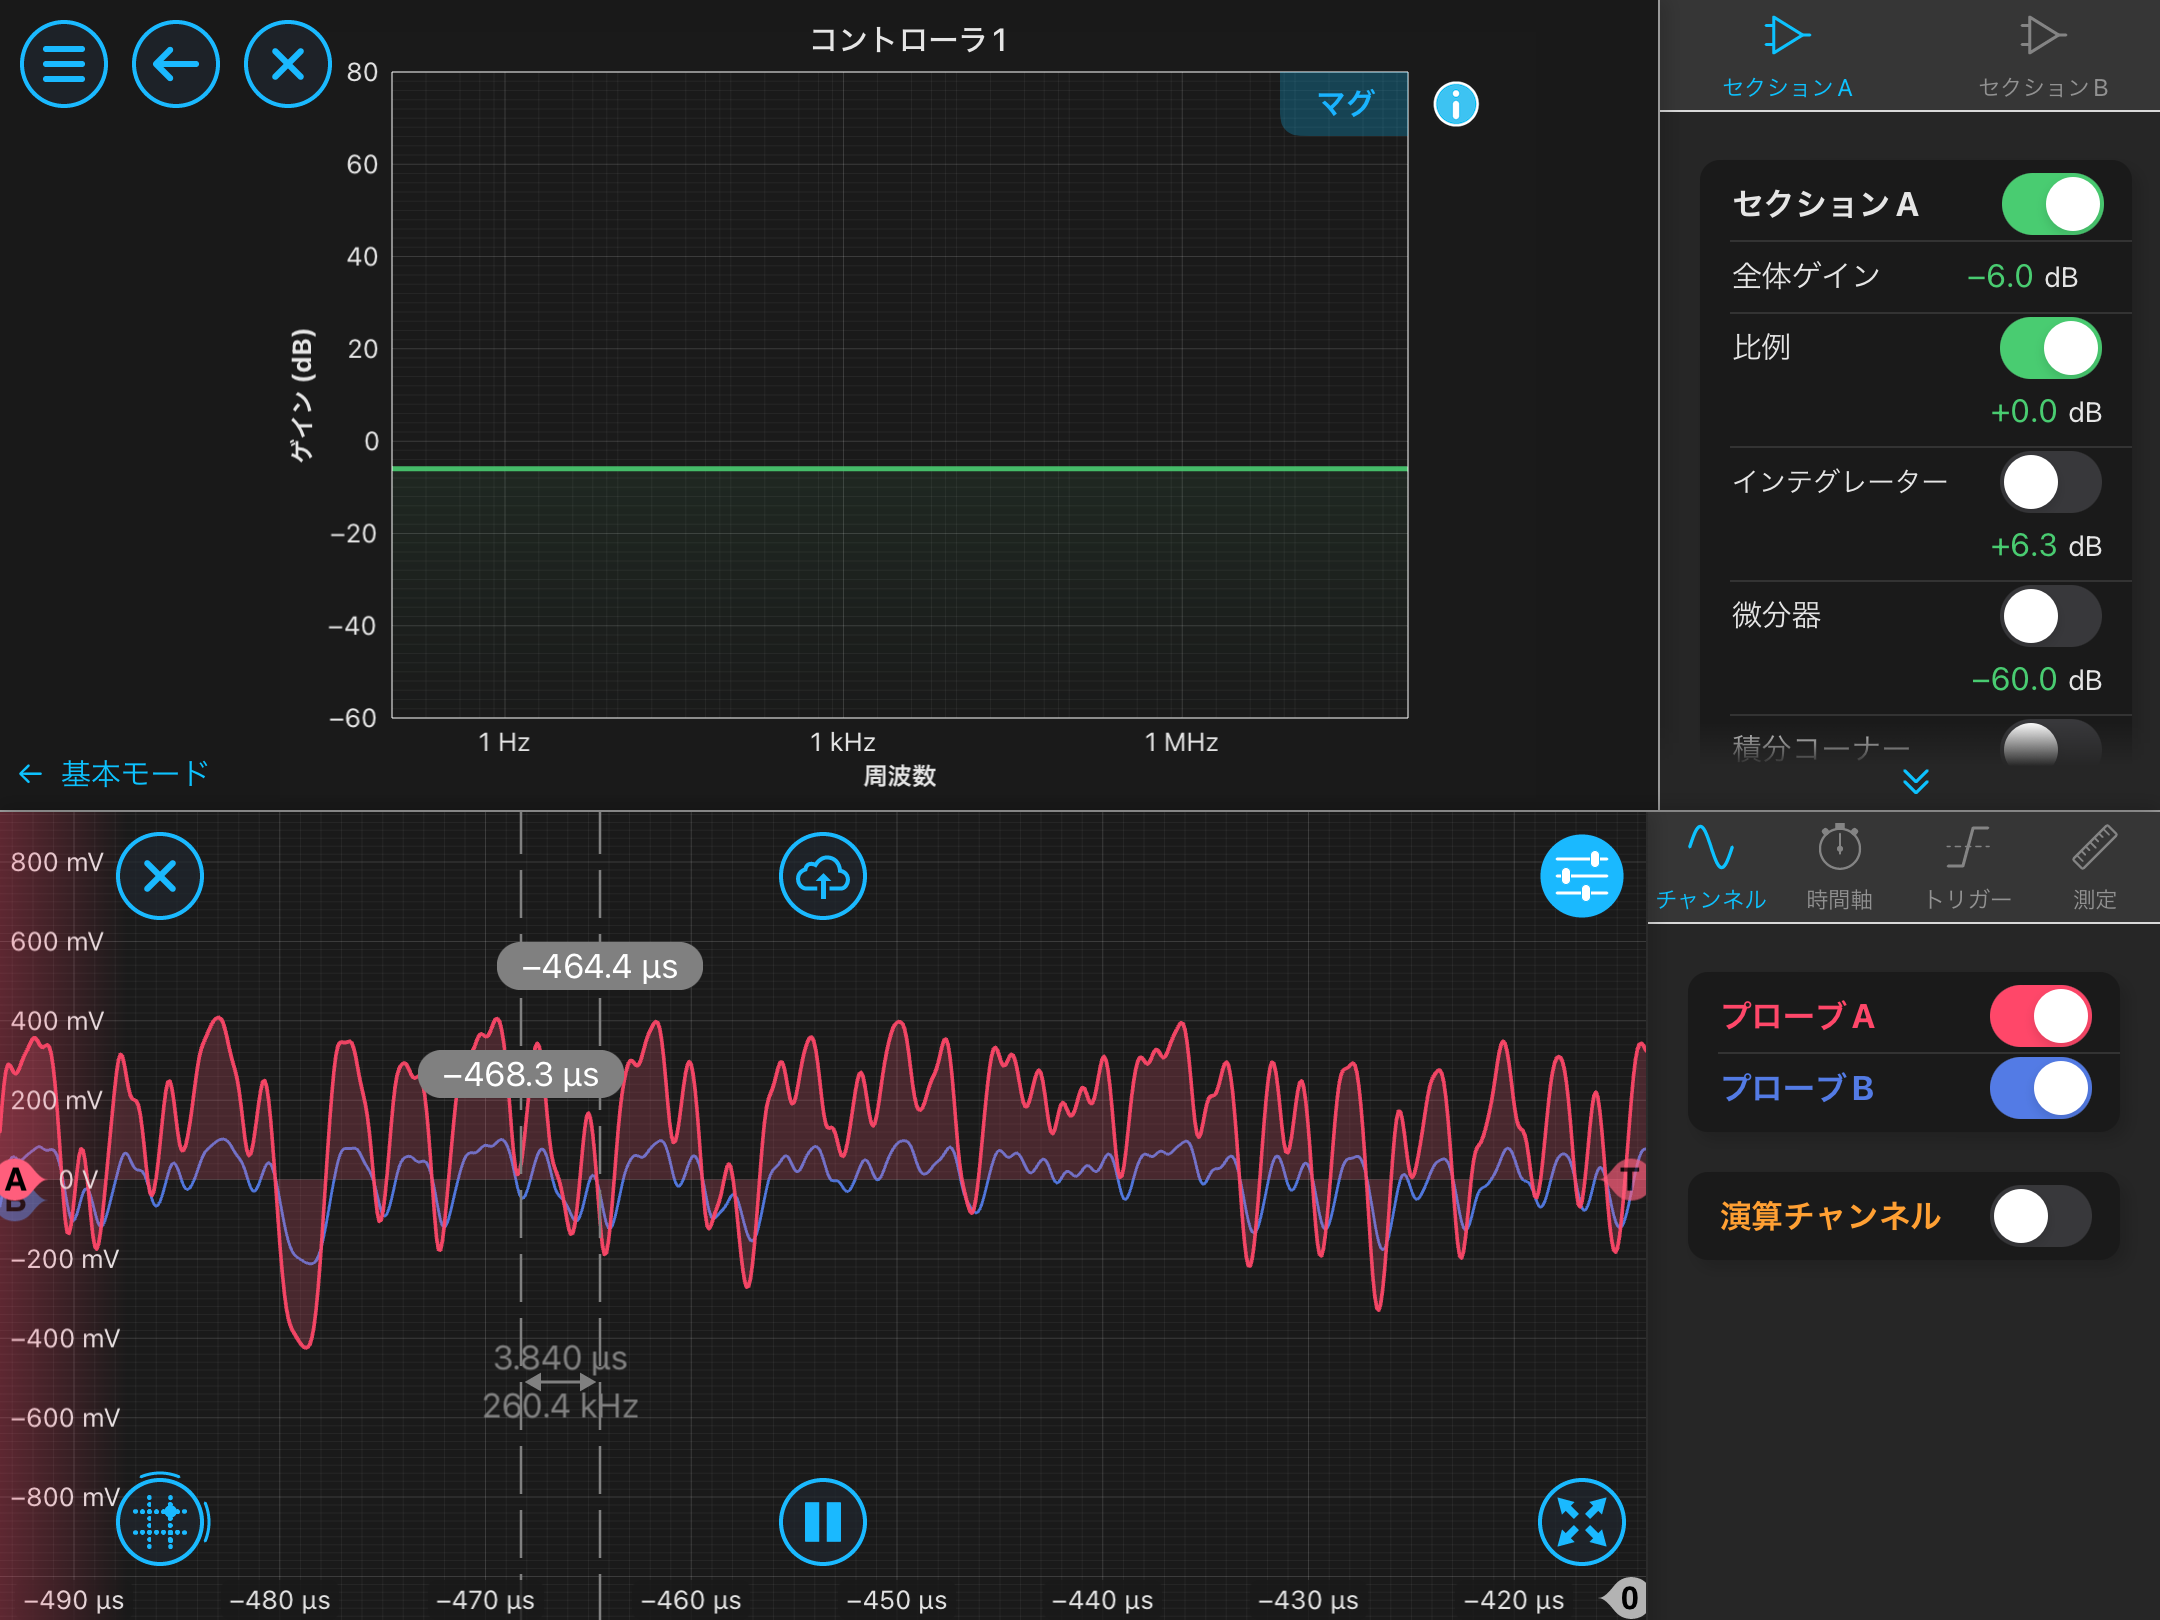
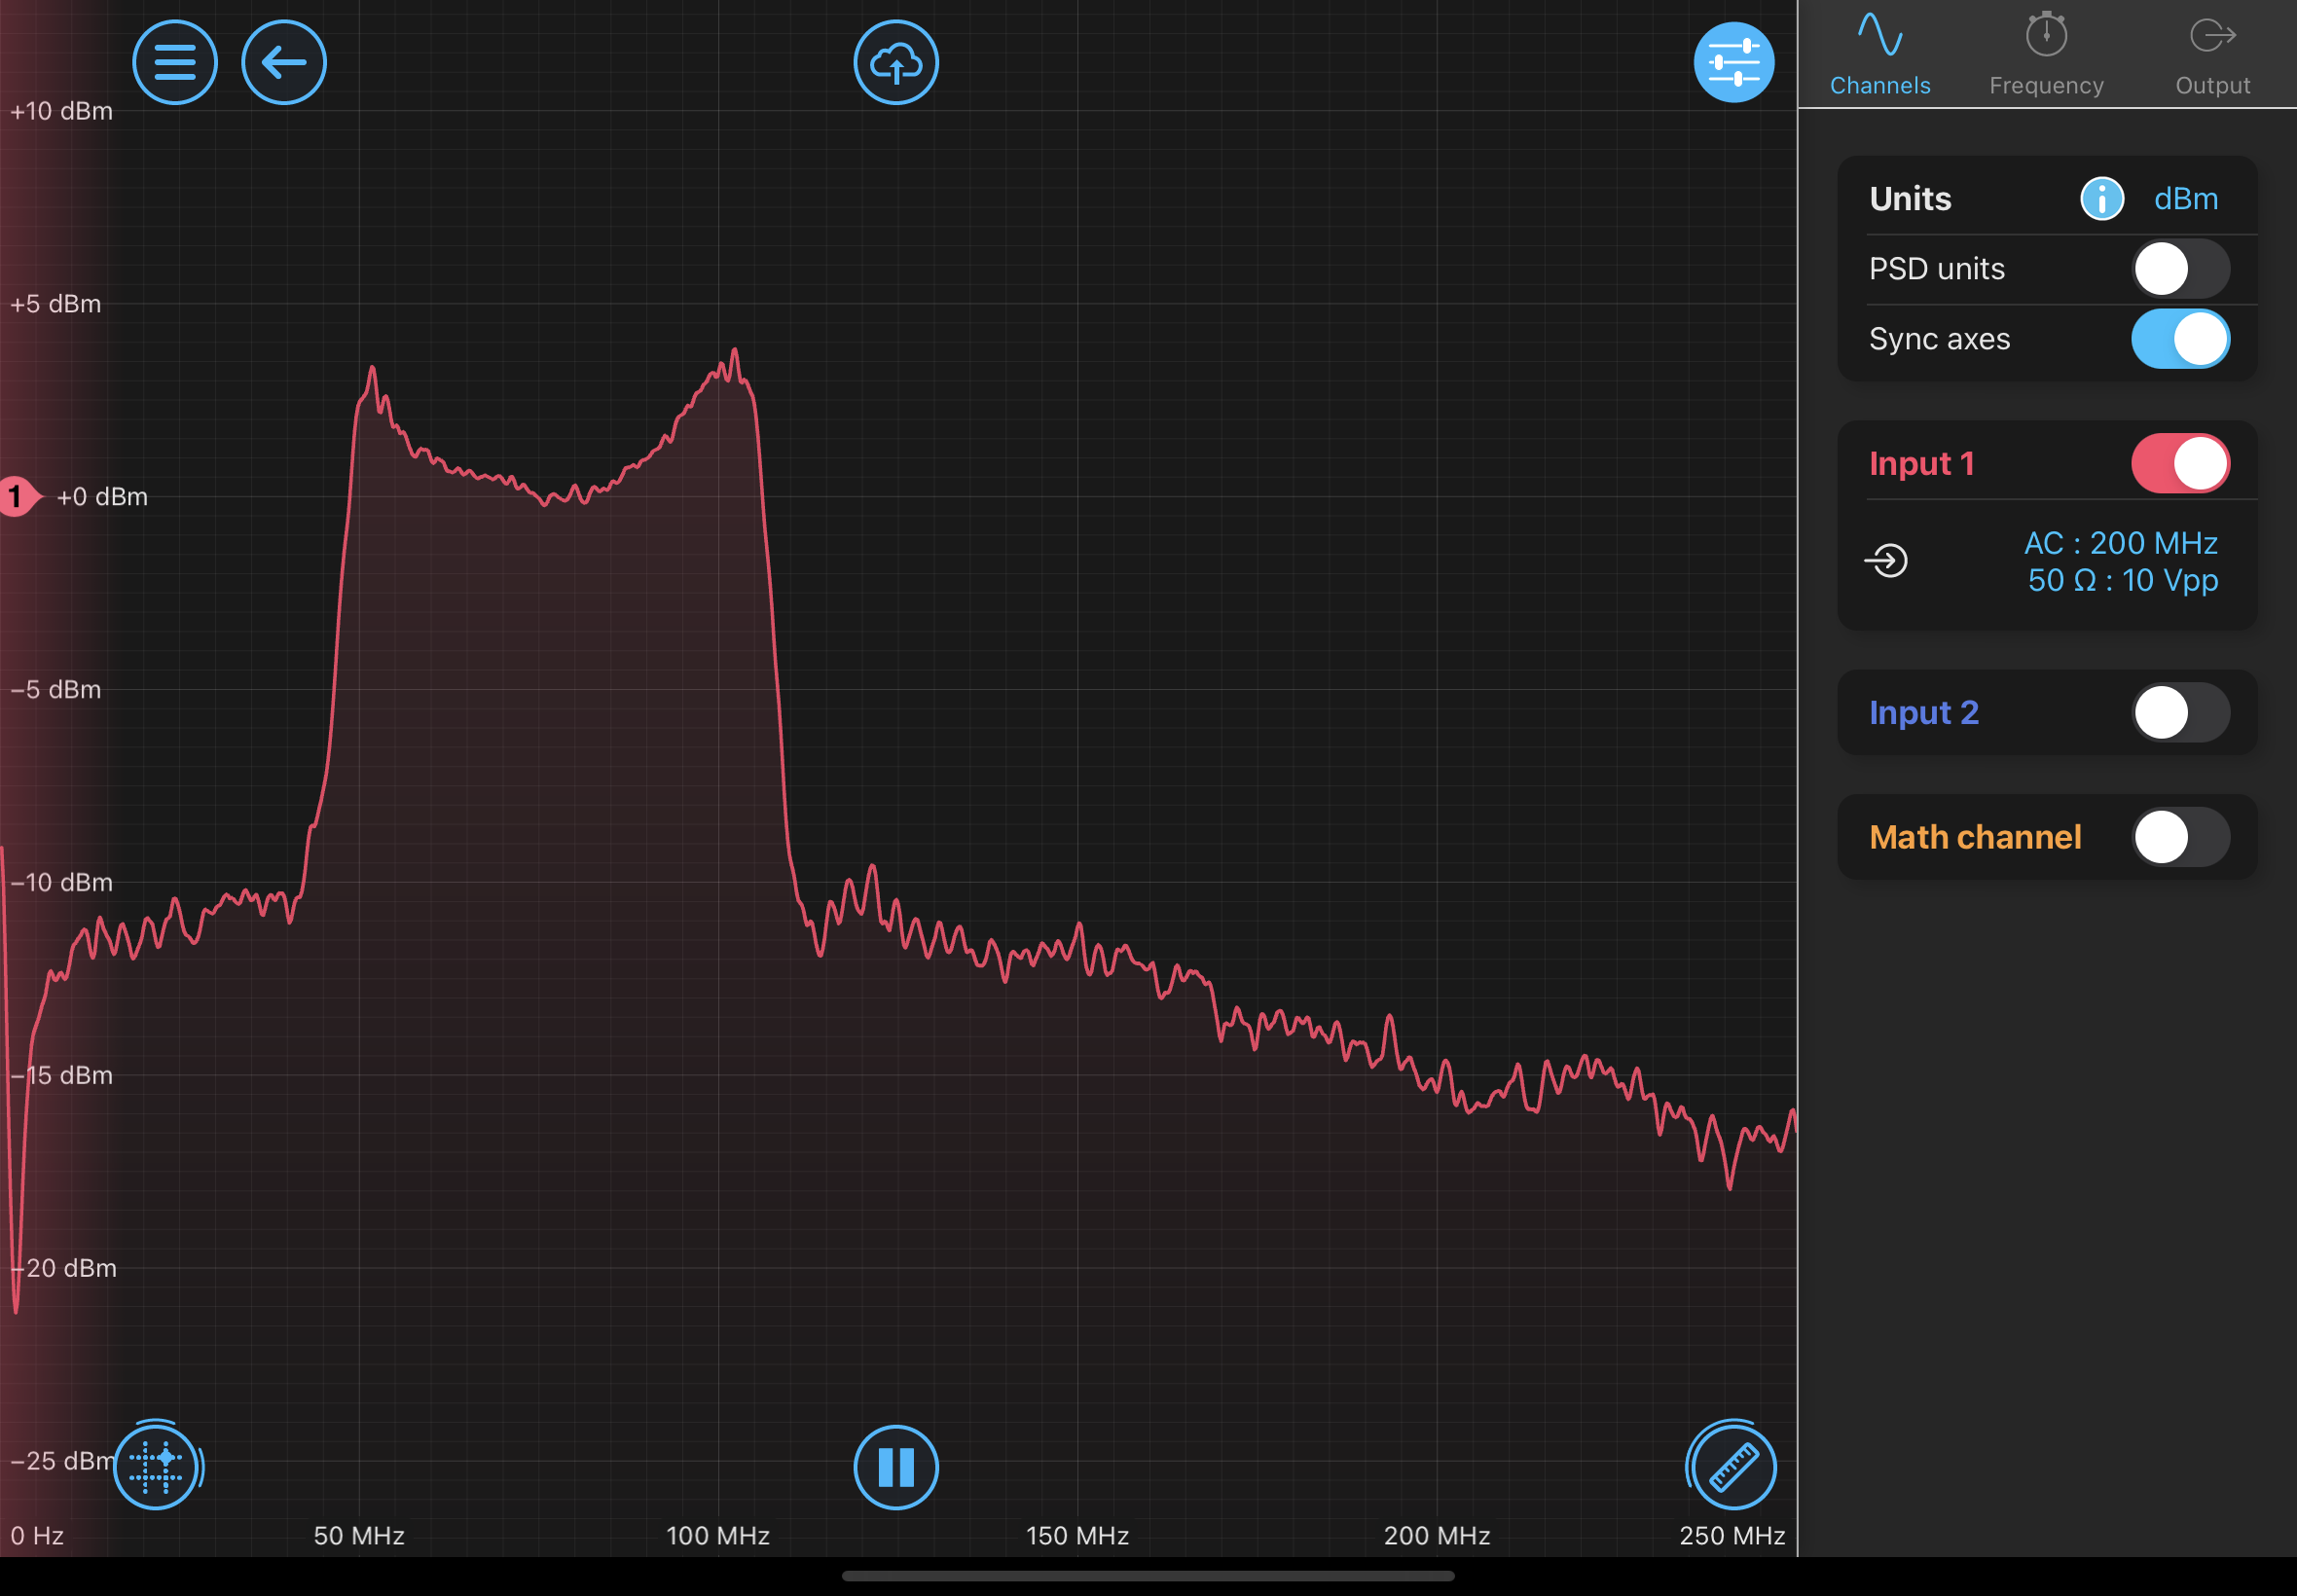
In addition, when using a flat filter and gradually increasing the gain, the error signal began oscillating at approximately 260 kHz, and the width of the beat signal increased. This oscillation may have been caused by a resonance of the sub-laser PZT. The corresponding error signals and beat signals are shown below:
Flat filter with a gain of -6 dB (Photo 3), corresponding beat signal (Photo 4)
Flat filter with a gain of 0 dB (Photo 5), corresponding beat signal (Photo 6)
Flat filter with a gain of +6 dB (Photo 7), corresponding beat signal (Photo 8)


Removed time segment is [1350000000, 1400000000)
These data is available on Kashiwa.
There was no undelivered data to Kashiwa in that time segment.
Debian12 system is still running with the temporal mitigation measure for this issue.
After then, the temporal mitigation measure was removed.
As the result, a remediation for these two issues was completed.