Reports 1-1 of 1 Clear search Modify search
PEM (Center)
takaaki.yokozawa - 6:55 Saturday 07 March 2020 (13382) Print this report
Acoustic injection to REFL table

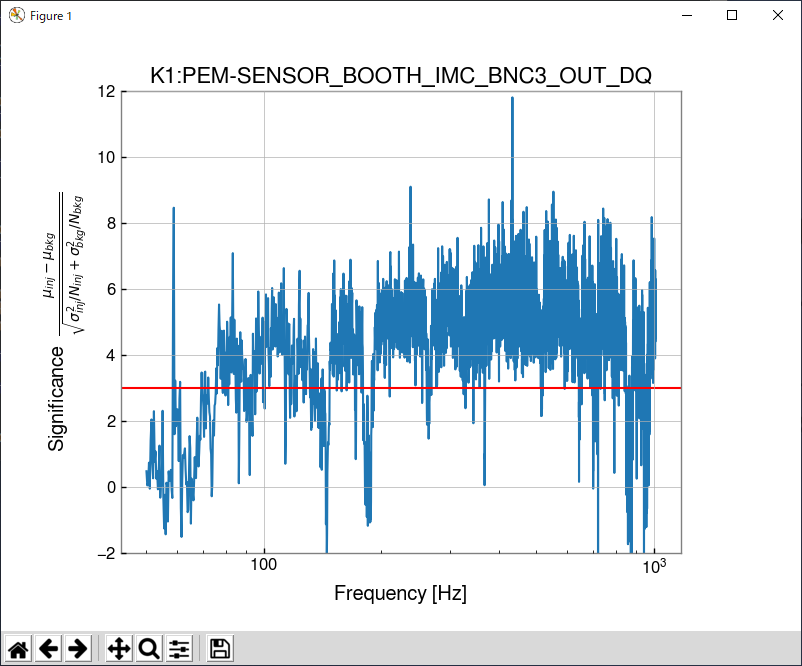
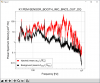
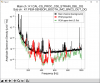
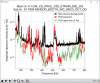
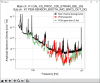
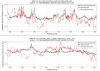
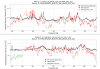
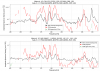
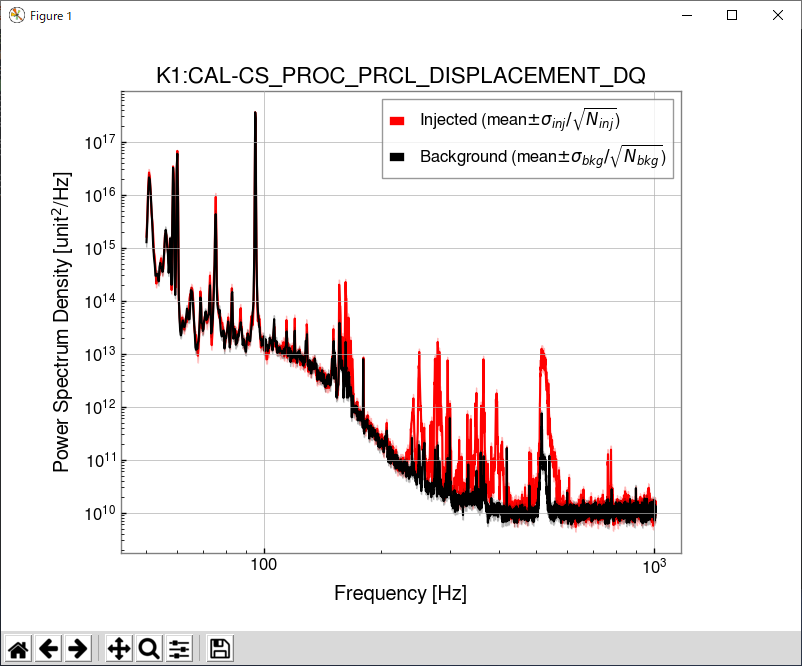
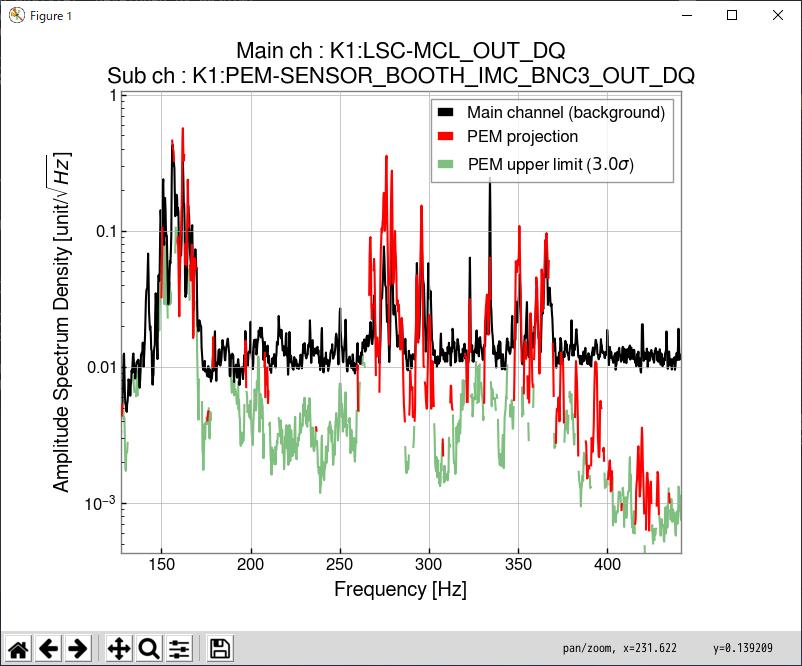
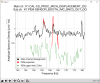
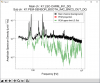
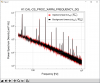
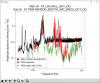
We performed the acousitc injection to REFL table with following configuration

DAC count 2000cnt uniform(60-3000Hz)

IMC output power 3.4W

REFL PDA1DC ~7mV

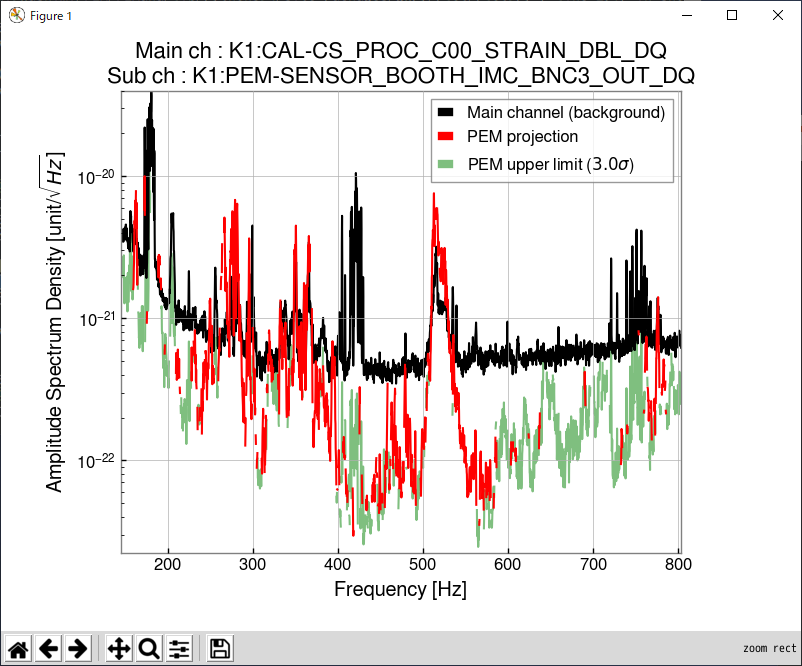
injection time : 1267565800-1267565900

silent run : 1267565900-1267566200

I backed IMC output power and REFL PDA1DC power to nominal value.

Images attached to this report
Comments to this report:
tatsuki.washimi - 10:50 Monday 09 March 2020 (13407) Print this report

I performed the PEM injection analysis.


result : 

zoom up : 


.ini file : 

[time]
inj_start = 1267565810
inj_end = 1267565890

bkg_start = 1267565910
bkg_end = 1267566020

[channel]
DARM = K1:CAL-CS_PROC_C00_STRAIN_DBL_DQ
PEM = K1:PEM-SENSOR_BOOTH_IMC_BNC3_OUT_DQ

[analysis]
fmin = 50
fmax = 1010
fftlength = 4
overlap = 1

; threshold for injection significance
sigma_DARM = 3
sigma_PEM = 3


intermediate plots : 


Images attached to this comment
tatsuki.washimi - 11:20 Monday 09 March 2020 (13409) Print this report

I also evaluated the effect of acoustic noise around REFL table into each PEM sensors.


  • ACC on the REFL table ( plot )
  • MIC in the REFL table box ( plot )
  • MIC in the IMC-REFL table box ( plot )

-> these spectrums can be roughly understood by the acoustic field in the clean booth


  • ACC on the  MCF-REFL table ( plot )

-> Only 130Hz, 330Hz, 520 Hz are comparable to the background spectrum.
    -> MCF-REFL table is well resistant to  sound OR the sencitivity of the ACC is not enough.


For the ACCs on ground (See http://klog.icrr.u-tokyo.ac.jp/osl/?r=13293) : 

  • on the ground, between ISS table and IMMT chamber (plot ) -> the acoustic field is a main noise source.    
  • on the ground of MCF chamber (plot ) -> the 260-380Hz bump is comming from the acoustic field.
  • on the PRM leg ( plot ) ->  acoustic field is not very effective.
Images attached to this comment
tomotada.akutsu - 12:02 Monday 09 March 2020 (13411) Print this report

Is it possible to explain more on your graphs?? I'm sorry but it's hard for me to estimate the air of those graphs. It seemed they are not for projections to DARM but for each PEM ch... From these results, what should we learn? (What can be uderstood, and what cannot be understood?)

tatsuki.washimi - 12:34 Monday 09 March 2020 (13412) Print this report

miss

tatsuki.washimi - 12:35 Monday 09 March 2020 (13413) Print this report

miss

tatsuki.washimi - 12:47 Monday 09 March 2020 (13414) Print this report

miss

tatsuki.washimi - 16:32 Monday 09 March 2020 (13415) Print this report

In PEM injection analysis, sometimes overestimation is happen.
One cause is the frequency conversion due to mechanical resonance of something.
So, the structure of the spectrum for darm and othre channels might be a hints of the noise path.

I investigated the PEM channels and QPDs around REFL table by my eye.
As a results, only IMMT1 trans QPDs (pitch) have similar structure with DARM around 280Hz.
I could not find any similar channels around 360Hz nor 520 Hz.


Plots for 

Images attached to this comment
tatsuki.washimi - 16:35 Monday 09 March 2020 (13420) Print this report

miss

tatsuki.washimi - 18:20 Monday 09 March 2020 (13424) Print this report

I performed the same analysis for other DoF.

As a results, 

  • 156Hz, 162Hz -> MICH, PRCL
  • 250-400Hz -> PRCL, MCL
  • 520Hz bump -> PRCL


[Plots]

CARM


MICH


PRCL


X arm


MCL

Images attached to this comment
Search Help
×

Warning

×