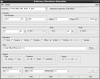
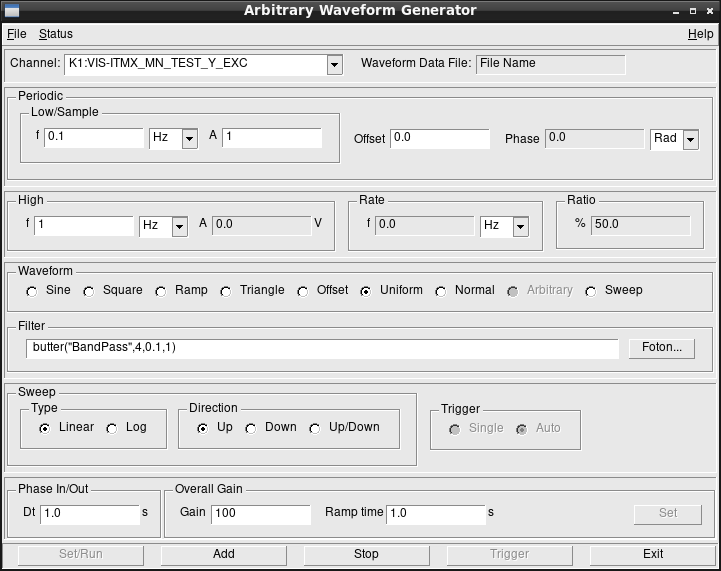
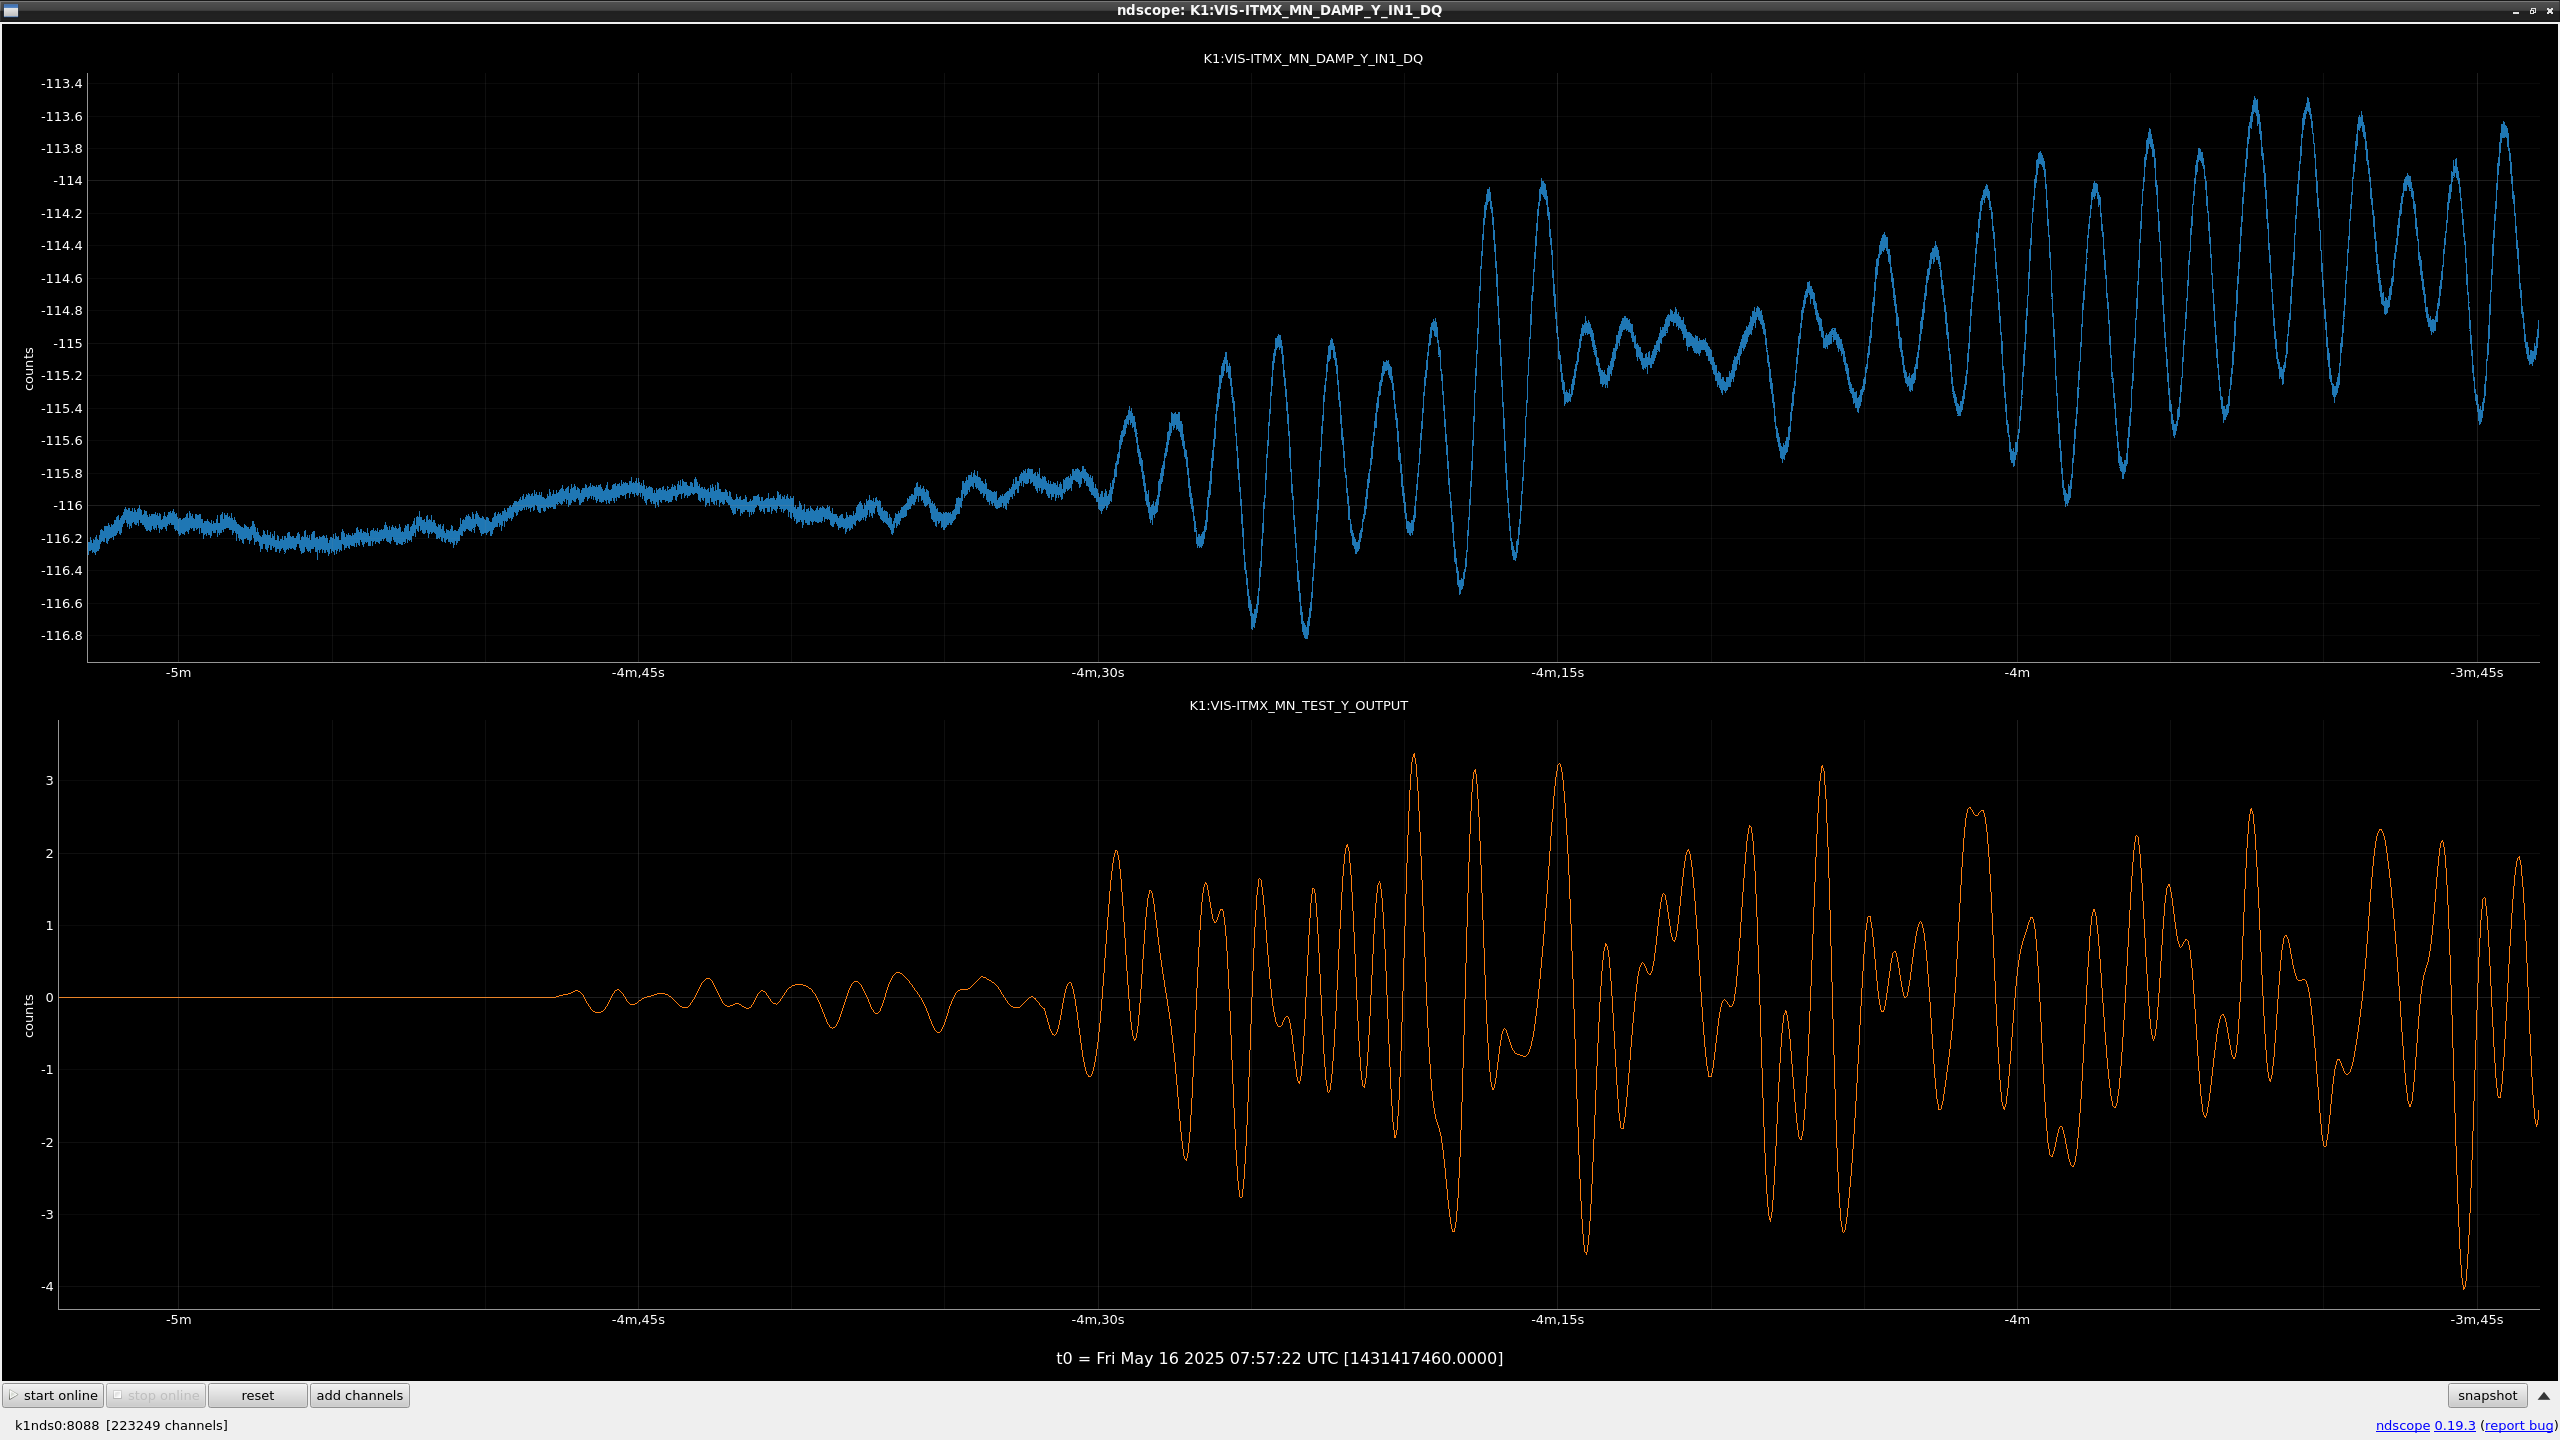
I injected excitatio signals between 0.1Hz and 1Hz (fig1).
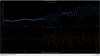
After excitation, we can clearly see the oscillation in photosensor yaw signals (fig2).
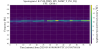
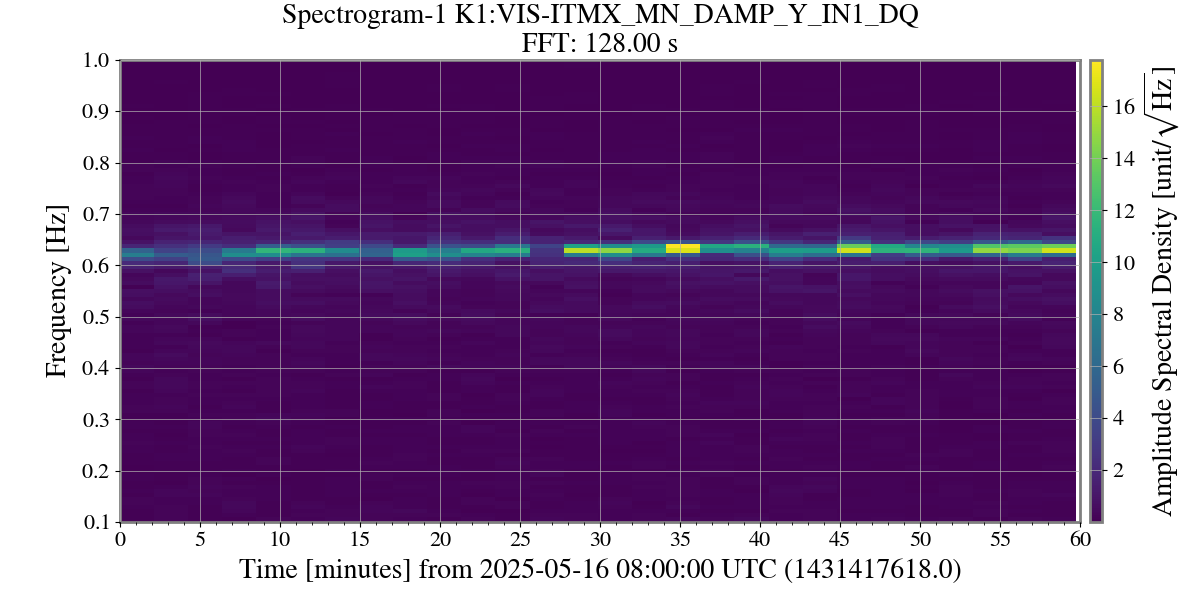
Attached figure shows the first one hour spectrogram of the photosensor signals.
It seems to become a bit stiffer.
We need to keep monitoring.