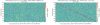
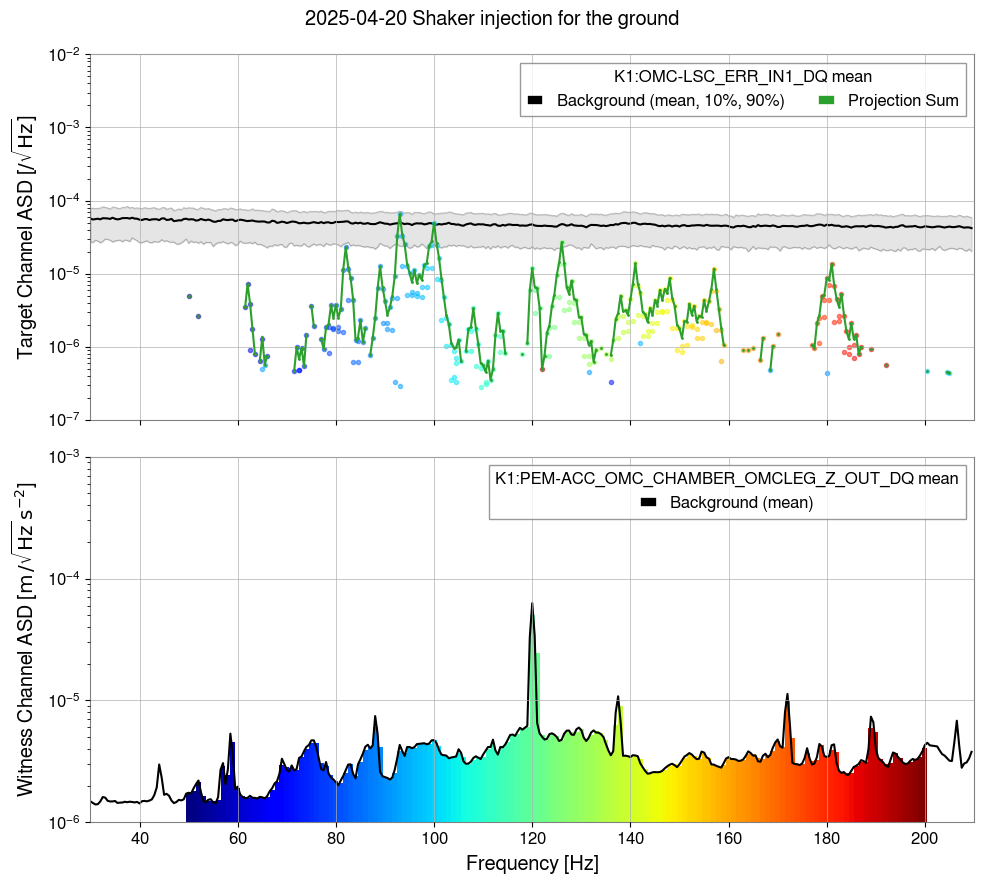
PEM injection using OMC large shaker on the floor
2025/04/20 11:01:00 - 11:31:00
Excitation : K1:PEM-EXCITATION_SR3_RACK_7_EXC
50 - 200 Hz , 1Hz resolution, 10 s in each measurement, 100 cnt
Fig.1. showed the results.
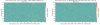
PEM injection using OMC large shaker on the floor
2025/04/20 11:41:00 - 12:22:00
Excitation : K1:PEM-EXCITATION_SR3_RACK_7_EXC
200 - 400 Hz , 1Hz resolution, 10 s in each measurement, 100 cnt
Fig.2. showed the results.
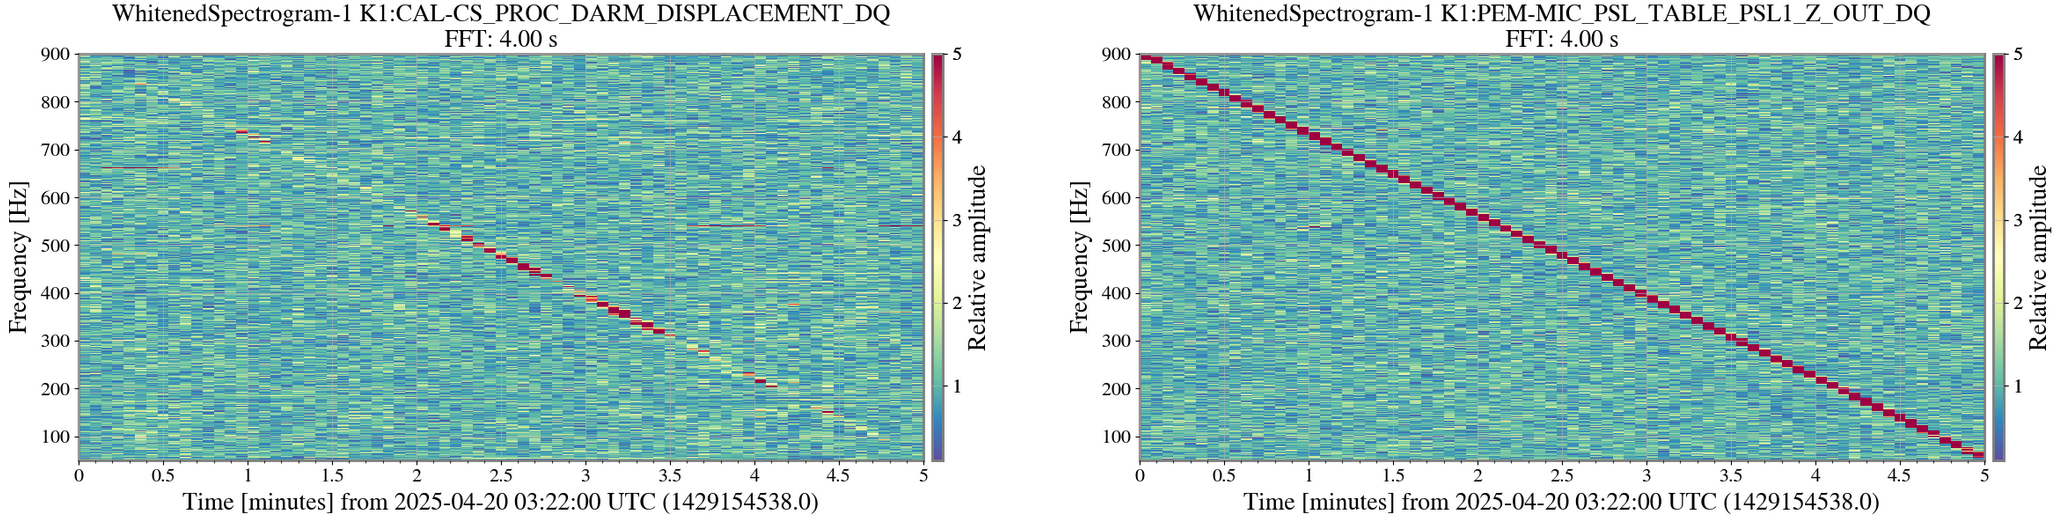
PEM injection using PSL speaker
2025/04/20 12:22:00 - 12:27:00
Excitation : K1:PEM-EXCITATION_MCF0_RACK_13_EXC
50 - 900 Hz , swept sine, 300 s, 100 cnt
Fig.3. showed the results.
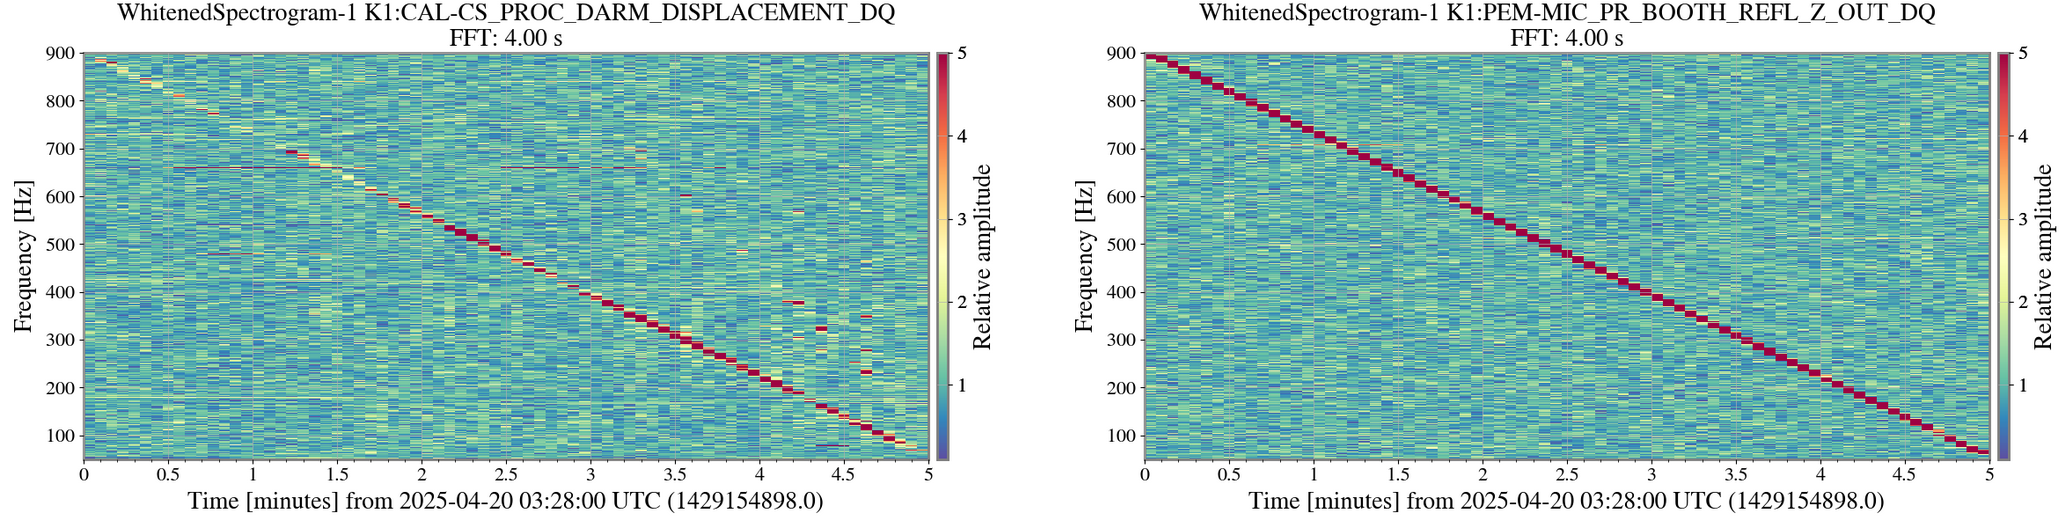
PEM injection using REFL speaker
2025/04/20 12:28:00 - 12:33:00
Excitation : K1:PEM-EXCITATION_MCF0_RACK_14_EXC
50 - 900 Hz , swept sine, 300 s, 100 cnt
Fig.4. showed the results.
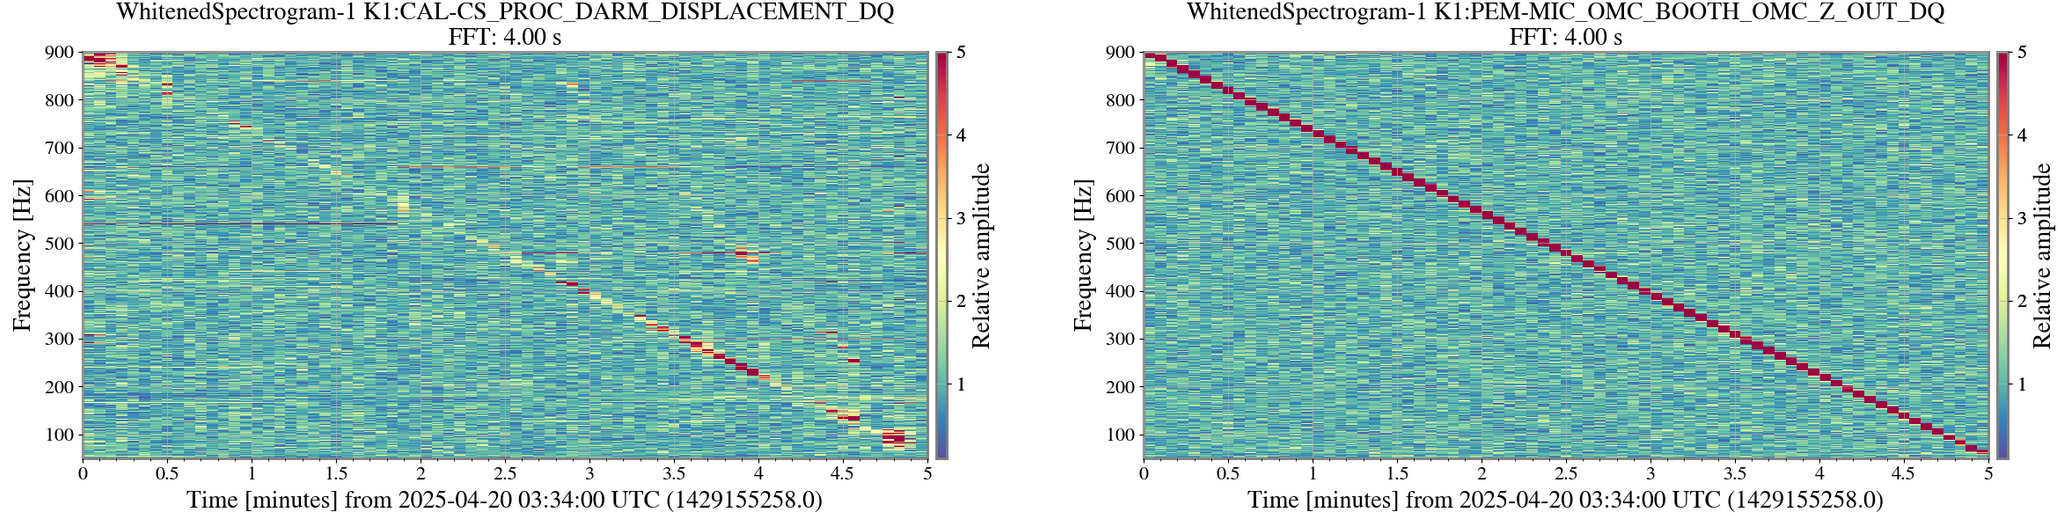
PEM injection using OMC speaker
2025/04/20 12:34:00 - 12:39:00
Excitation : K1:PEM-EXCITATION_SR3_RACK_6_EXC
50 - 900 Hz , swept sine, 300 s, 100 cnt
Fig.5. showed the results.
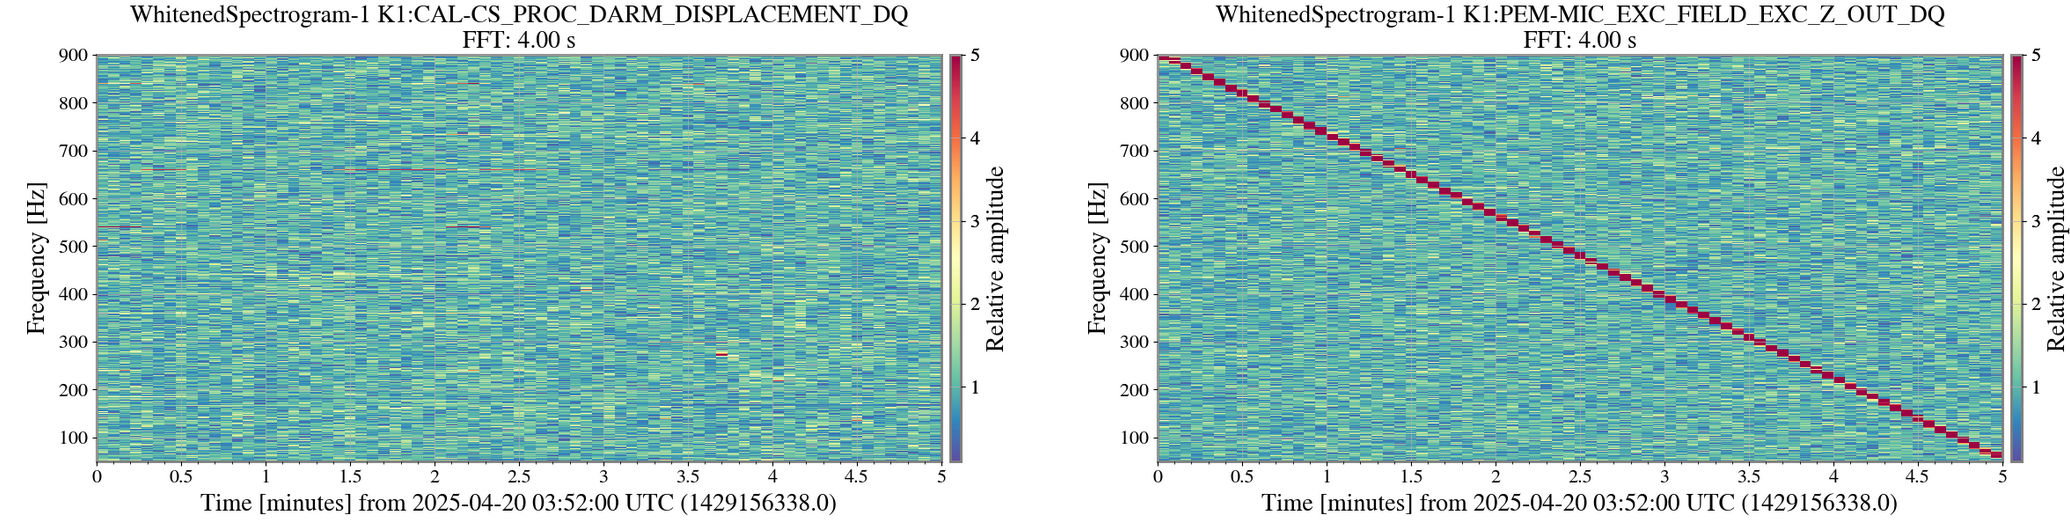
PEM injection using EXC speaker
2025/04/20 12:40:00 - 12:45:00
Excitation : K1:PEM-EXCITATION_EX0_RACK_1_EXC
50 - 900 Hz , swept sine, 300 s, 100 cnt
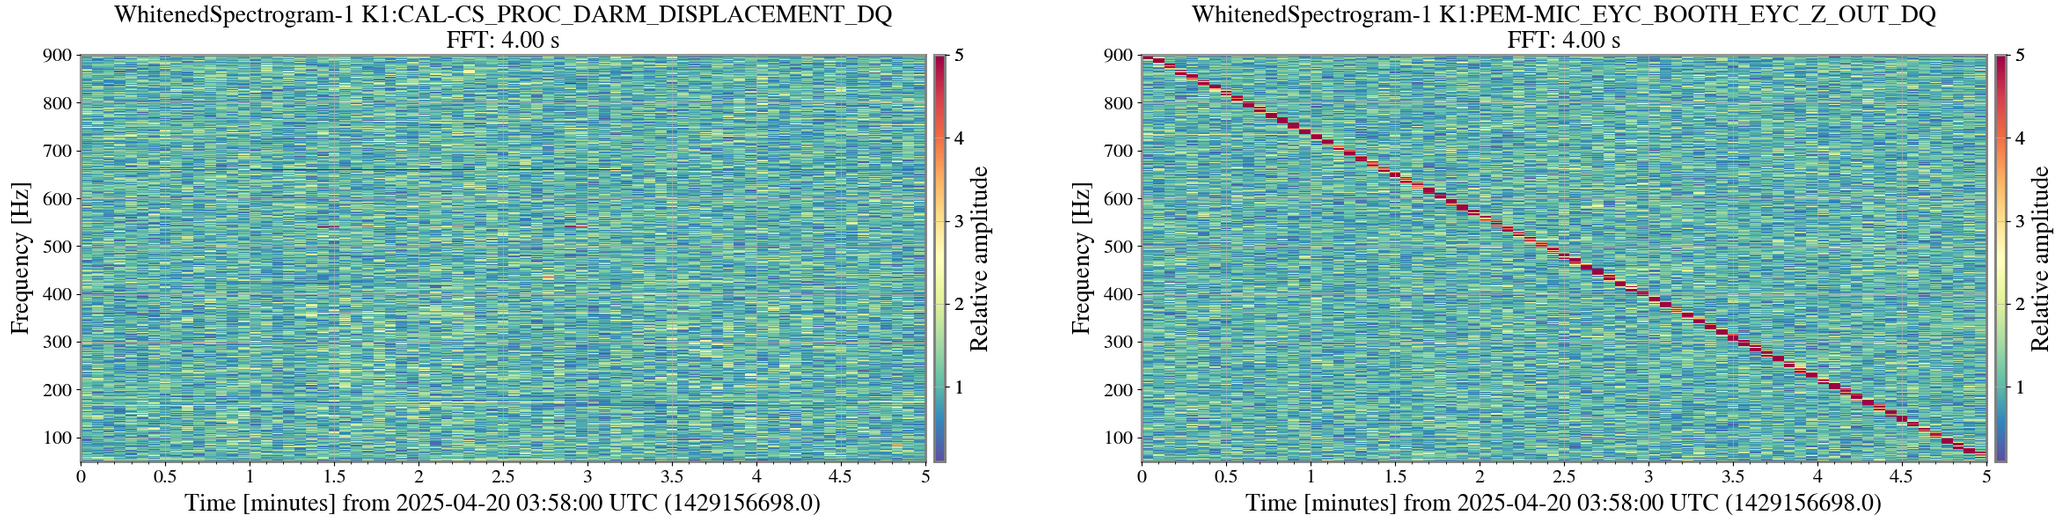
PEM injection using EYC speaker
2025/04/20 12:46:00 - 12:51:00
Excitation : K1:PEM-EXCITATION_EY0_RACK_1_EXC
50 - 900 Hz , swept sine, 300 s, 100 cnt
PEM injection using EXC speaker
2025/04/20 12:52:00 - 12:57:00
Excitation : K1:PEM-EXCITATION_EX0_RACK_1_EXC
50 - 900 Hz , swept sine, 300 s, 300 cnt
Fig.6. showed the results.
PEM injection using EYC speaker
2025/04/20 12:58:00 - 13:03:00
Excitation : K1:PEM-EXCITATION_EY0_RACK_1_EXC
50 - 900 Hz , swept sine, 300 s, 300 cnt
Fig.7. showed the results.
13 : 03 - Silent run
PEM injection using IFI shaker #1
2025/04/20 14:30:00 - 15:00:00
Excitation : K1:PEM-EXCITATION_MCF0_RACK_9_EXC
50 - 900 Hz , swept sine, 1800 s, 10 cnt
Fig.8. showed the results.
PEM injection using IFI shaker #2
2025/04/20 15:02:00 - 15:11:00
Excitation : K1:PEM-EXCITATION_MCF0_RACK_10_EXC
50 - 900 Hz , swept sine, 1800 s, 10 cnt
Fig.9. showed the results., lock loss happened during this measurement (~700 Hz)
PEM injection using IFI shaker #2
2025/04/20 15:42:00 - 16:12:00
Excitation : K1:PEM-EXCITATION_MCF0_RACK_10_EXC
50 - 900 Hz , swept sine, 1800 s, 10 cnt
Fig.10. showed the results., several glitches detected below 100 Hz


Analysis for
PEM injection using OMC large shaker on the floor
2025/04/20 11:01:00 - 11:31:00
Excitation : K1:PEM-EXCITATION_SR3_RACK_7_EXC
50 - 200 Hz , 1Hz resolution, 10 s in each measurement, 100 cnt
Fig.1. showed the results.
Plots and my comments:
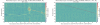
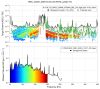
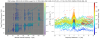
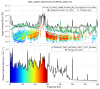
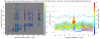
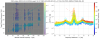
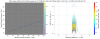
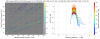
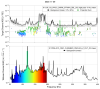
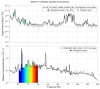
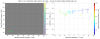
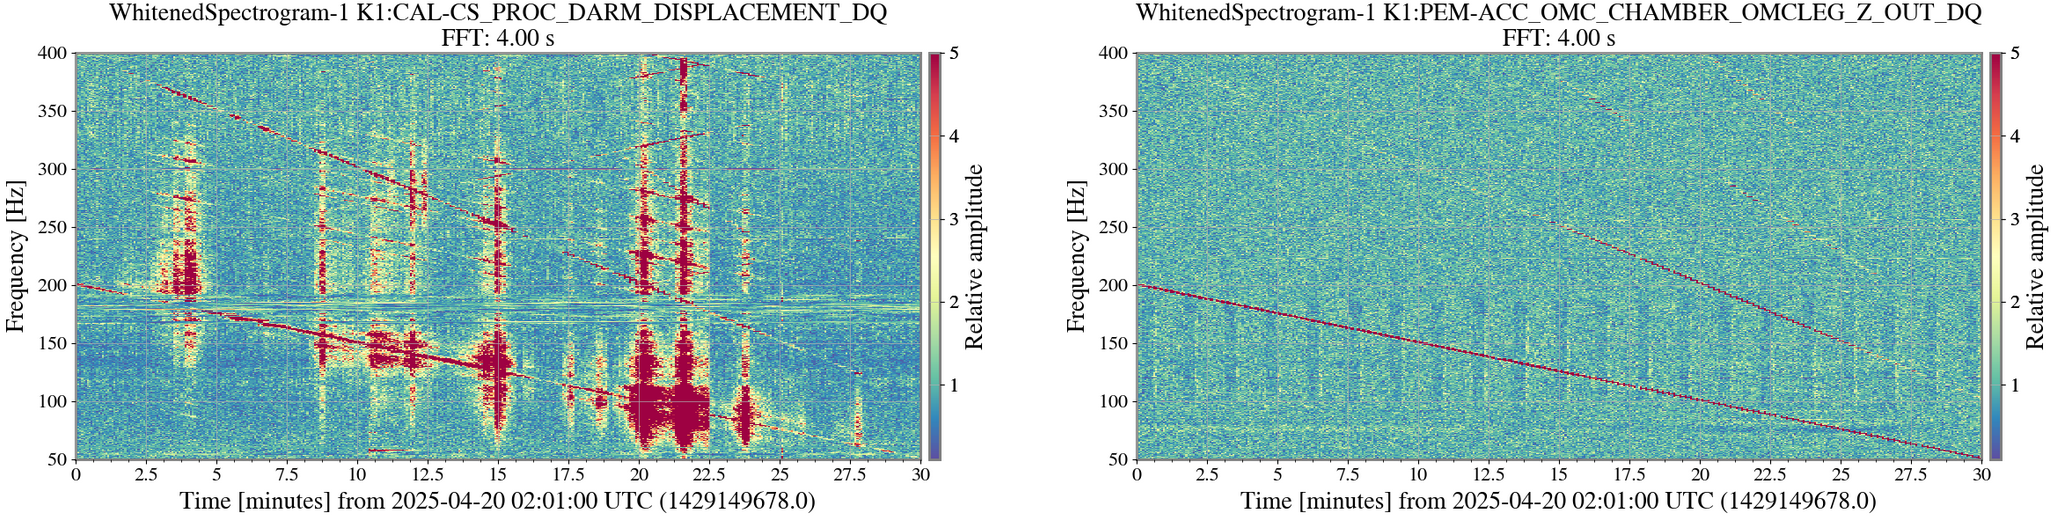
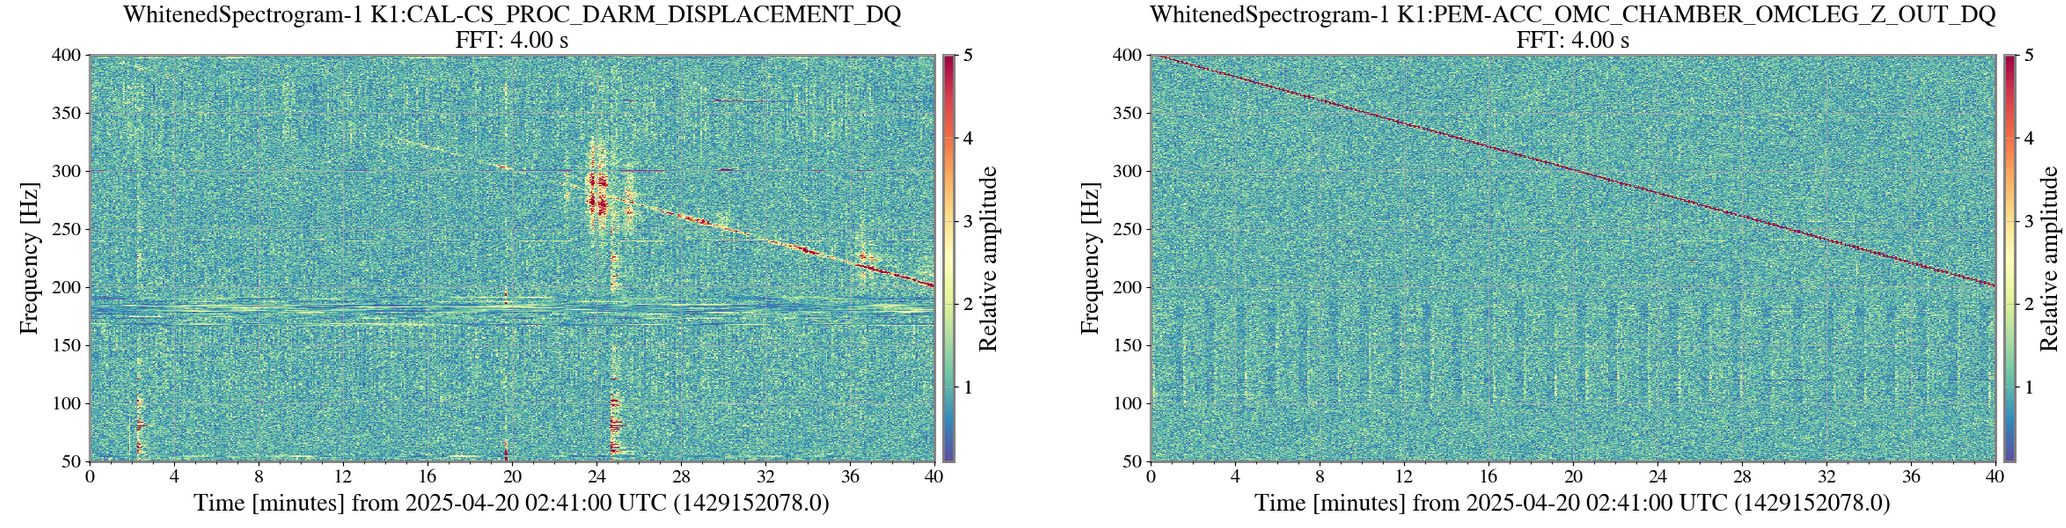
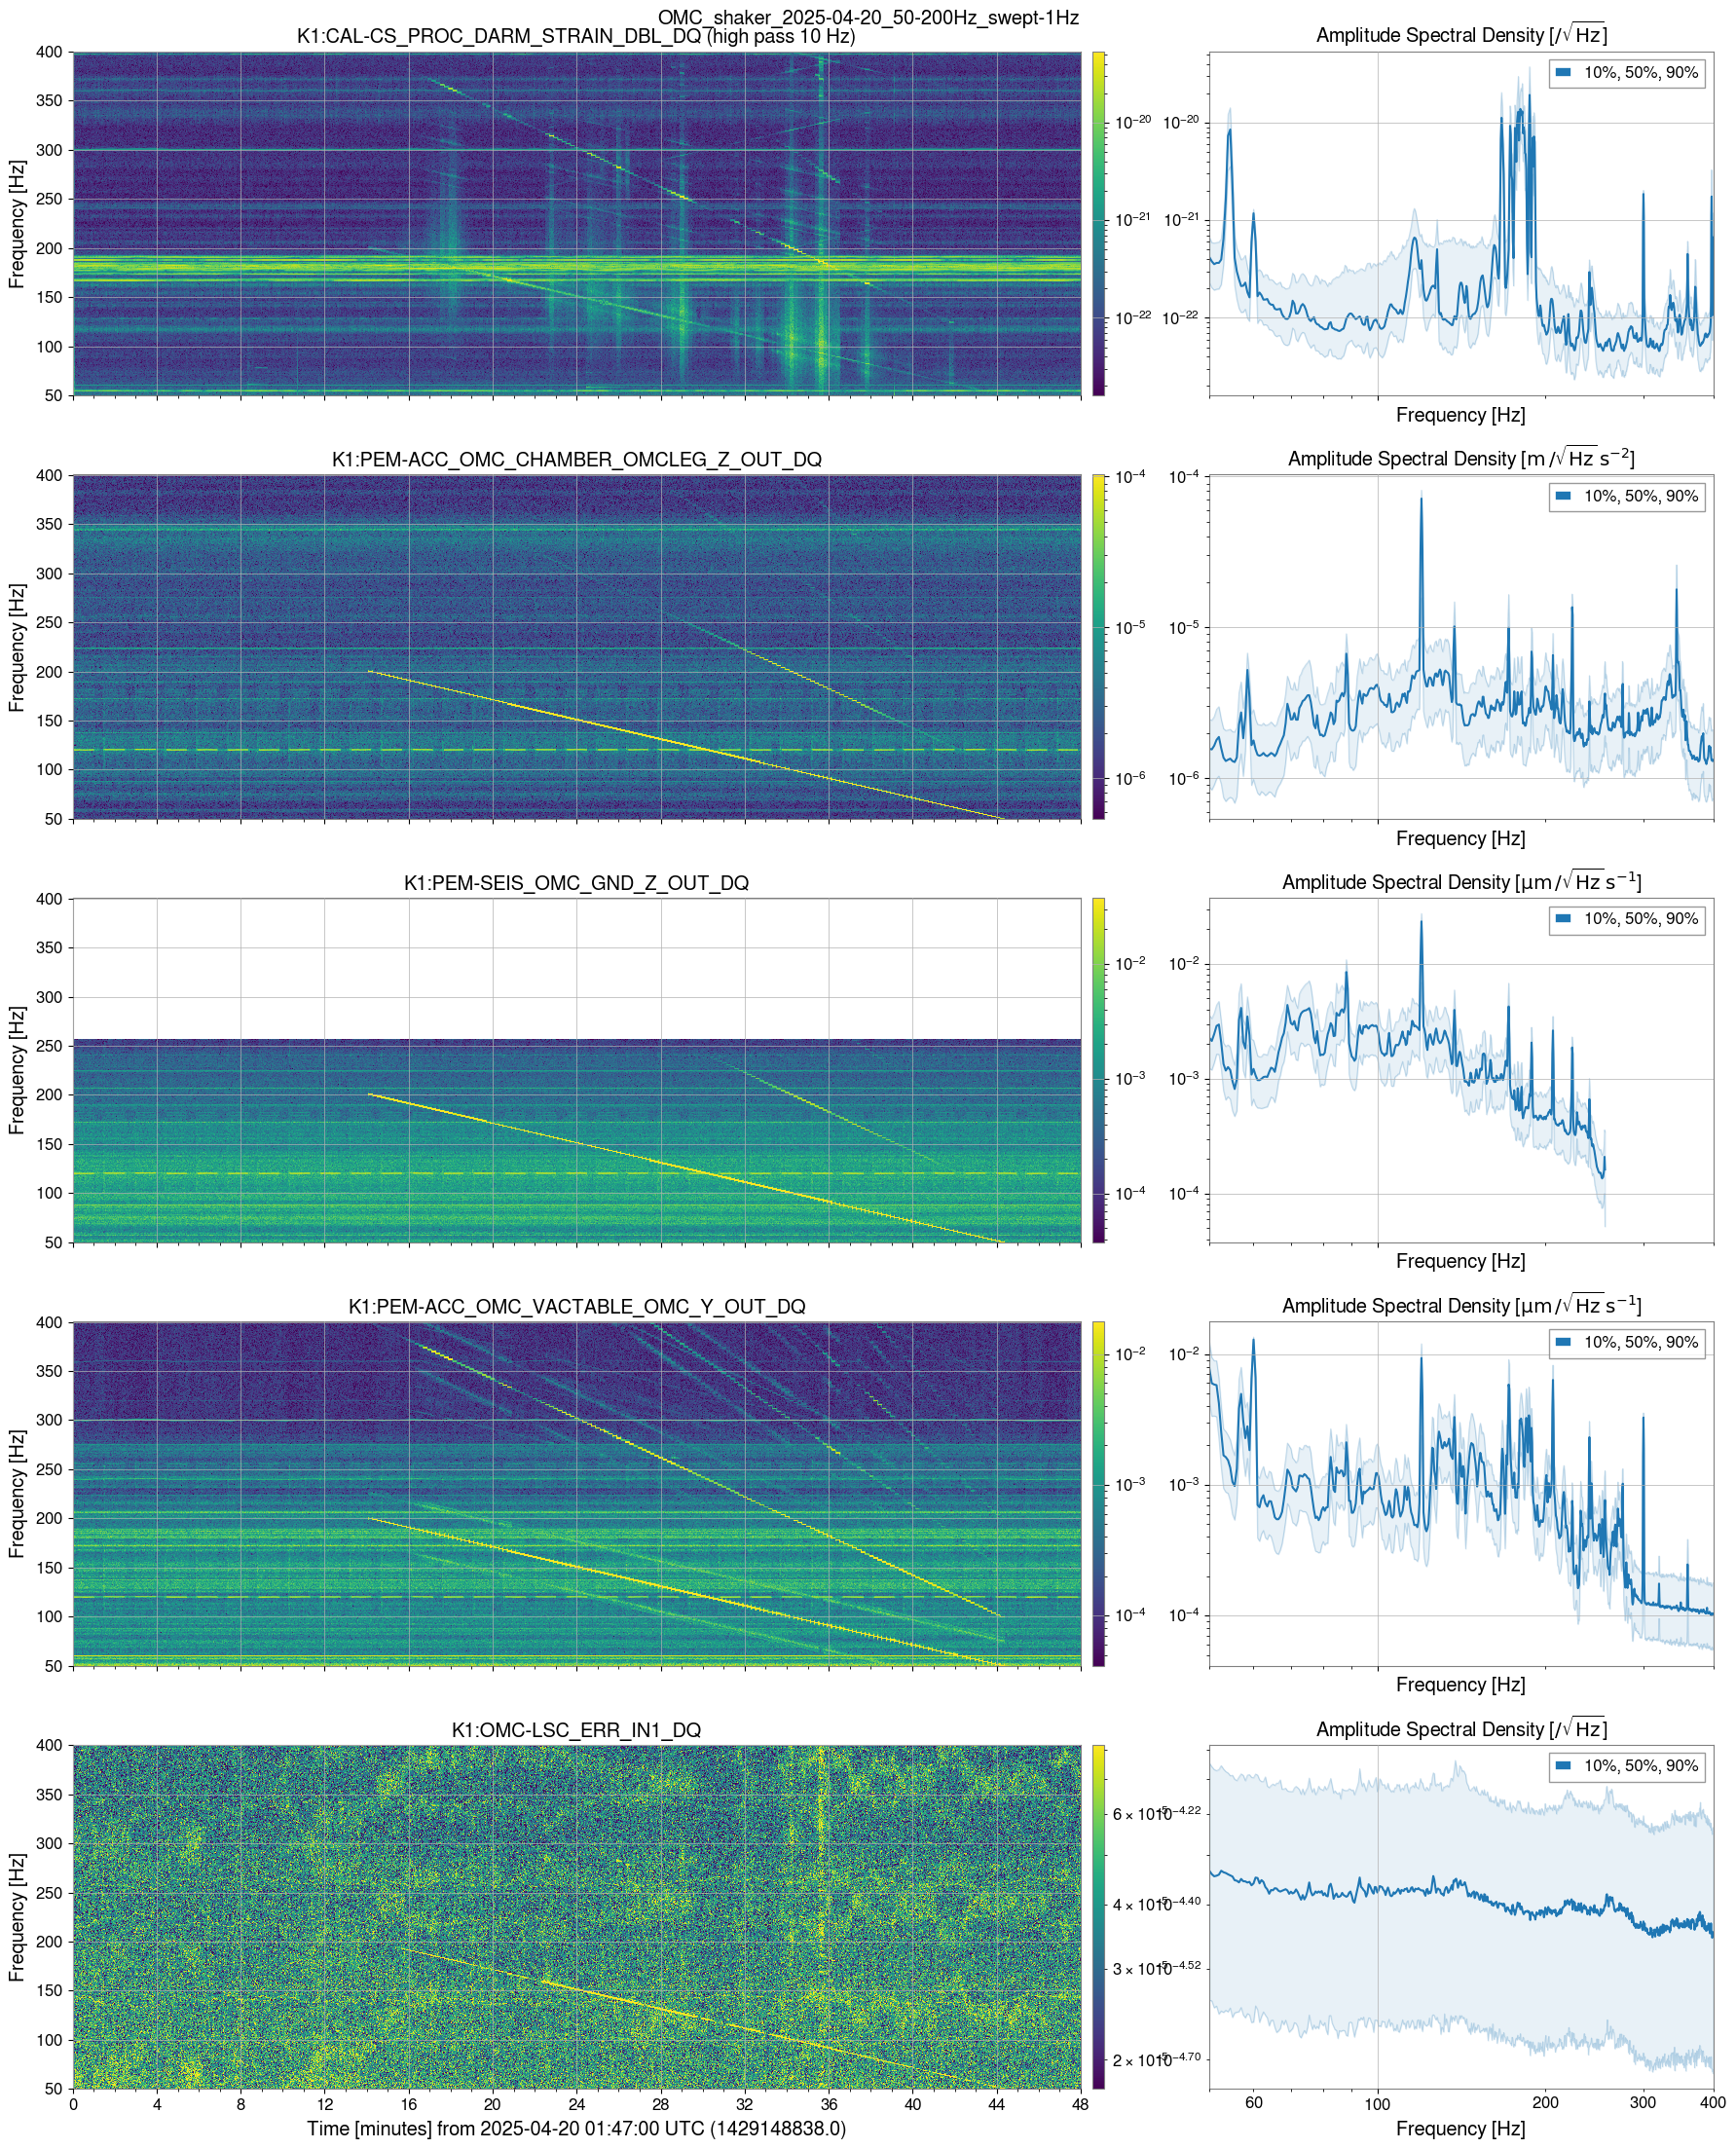
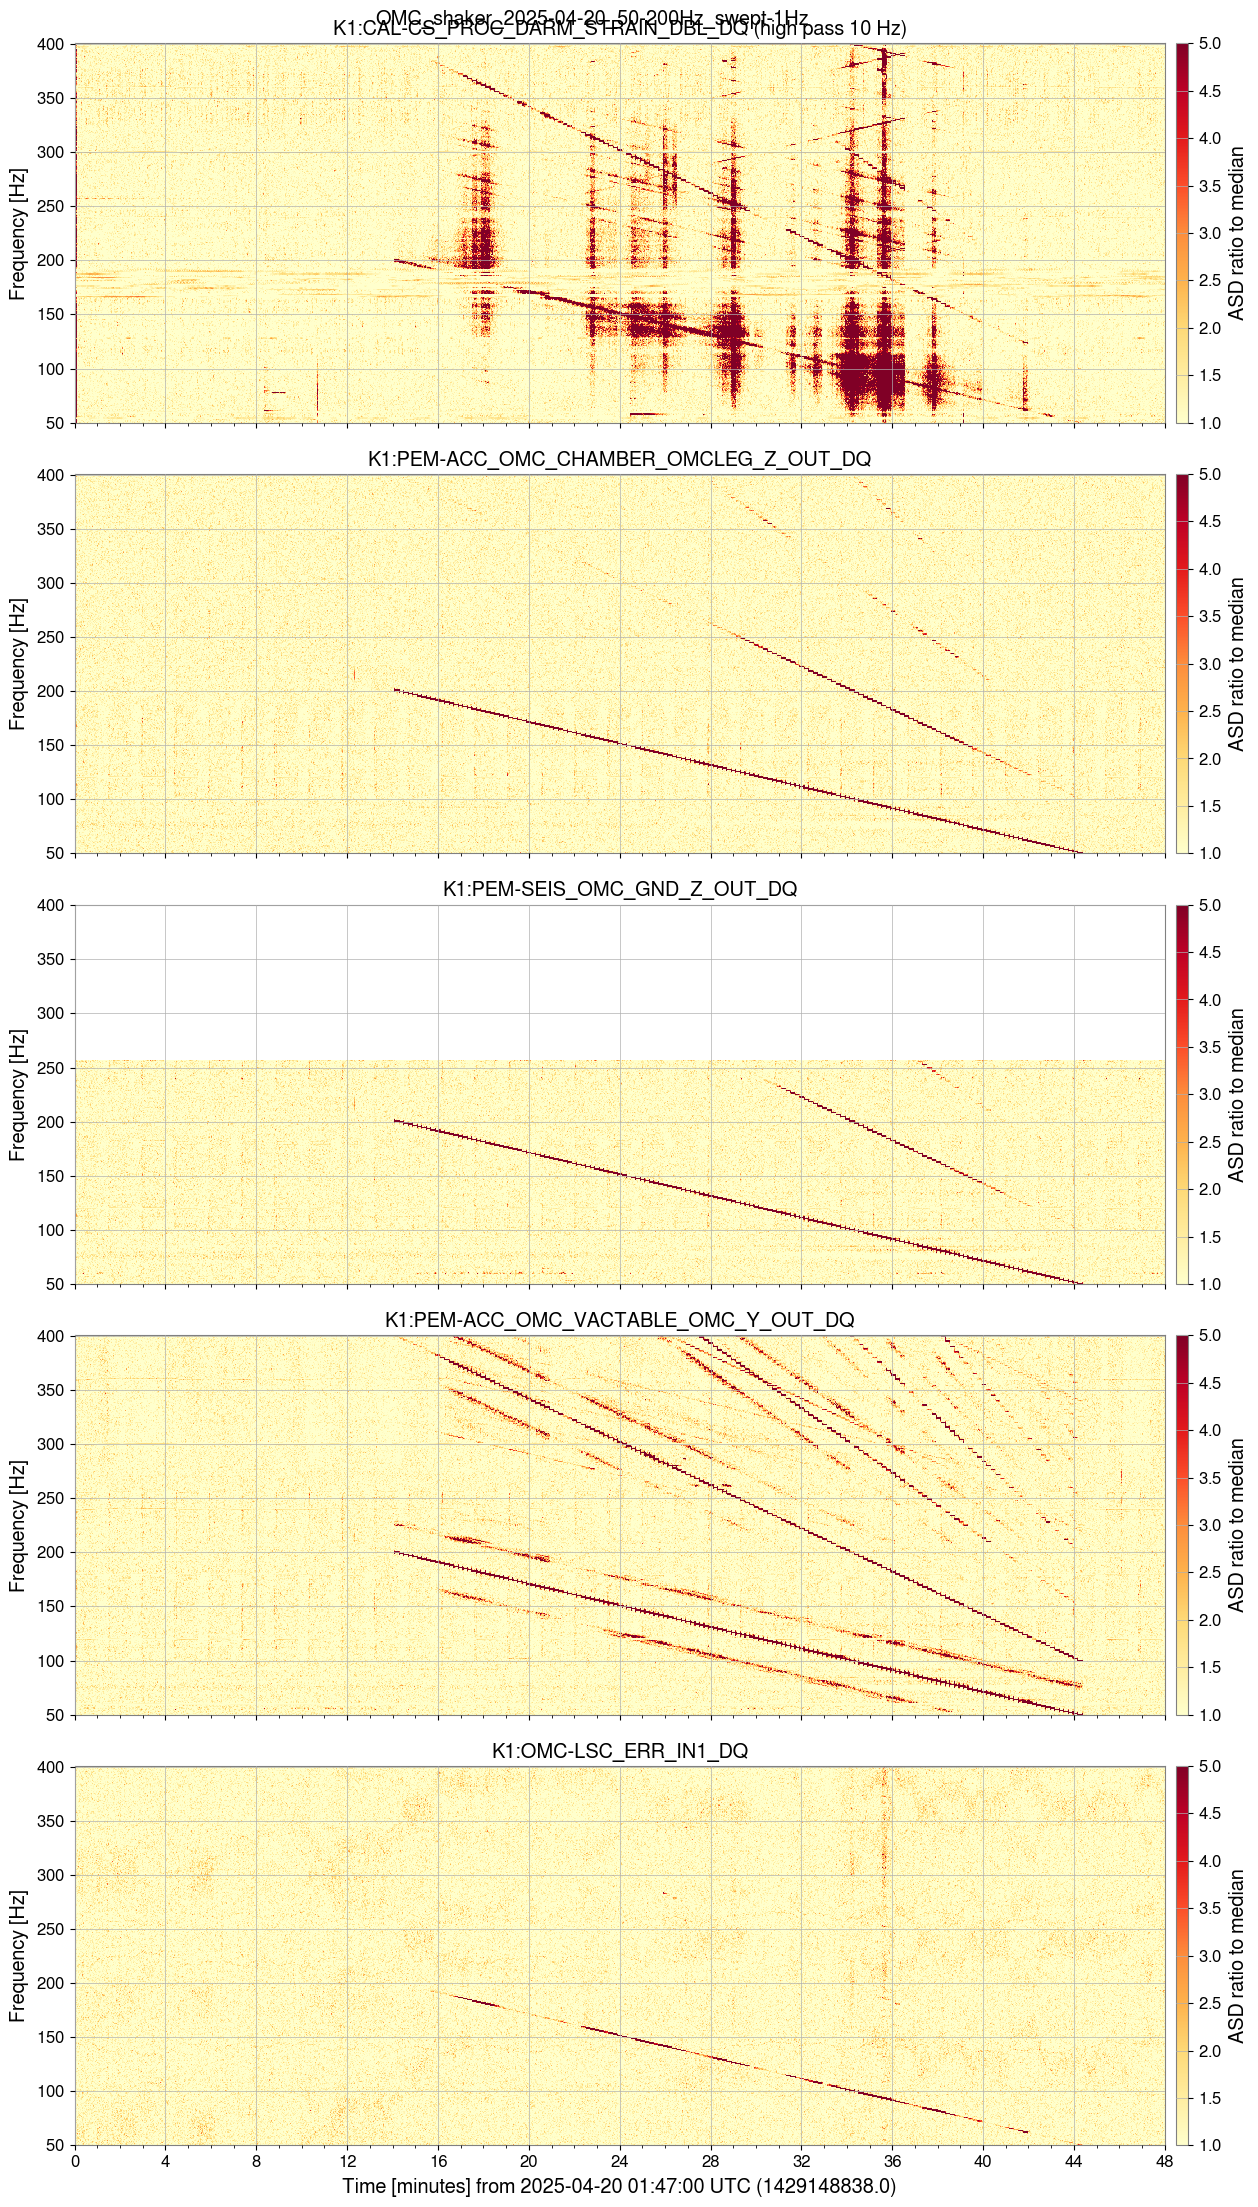
- Fig.1, 2 : Spectrograms (ASDs and relative ASDs)
- No IPC glitches
- The harmonics are found in the SEIS and ACC
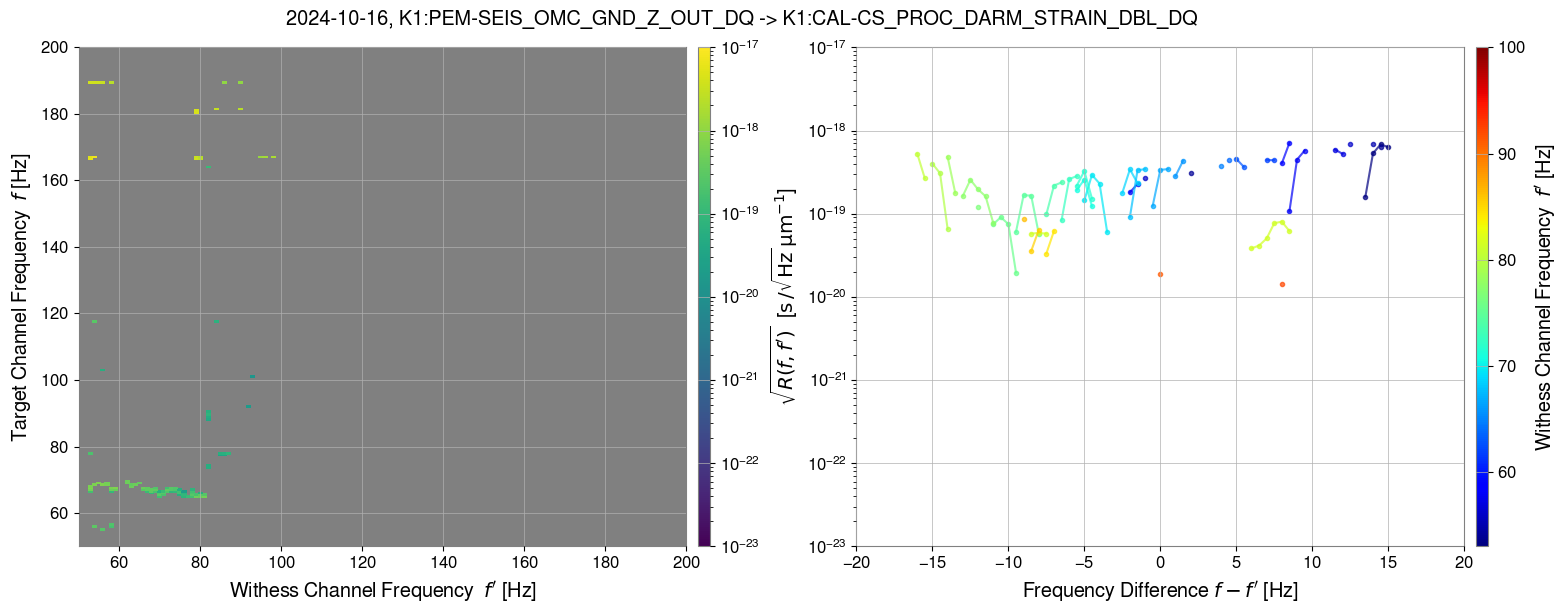
- The sidebands are found in the Geophone. This behavior is different from last year (e.g., 2024-10-16, klog31337)
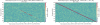
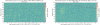
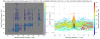
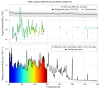
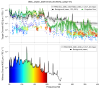
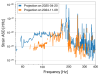
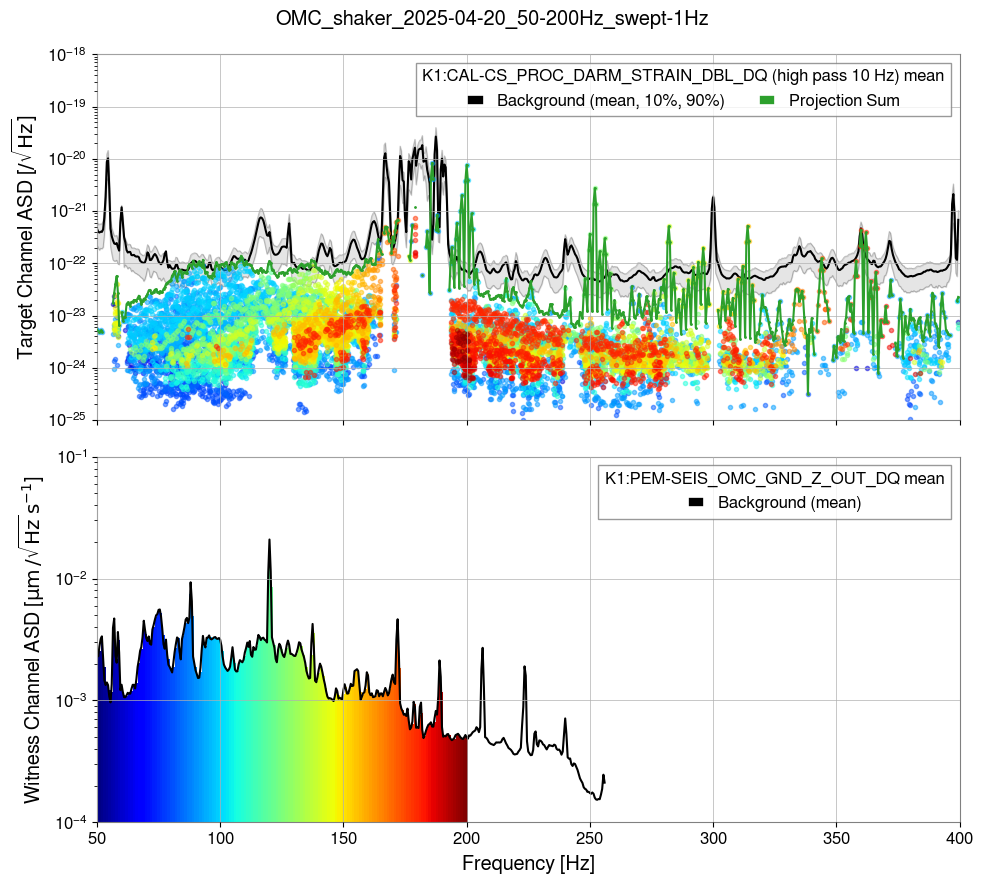
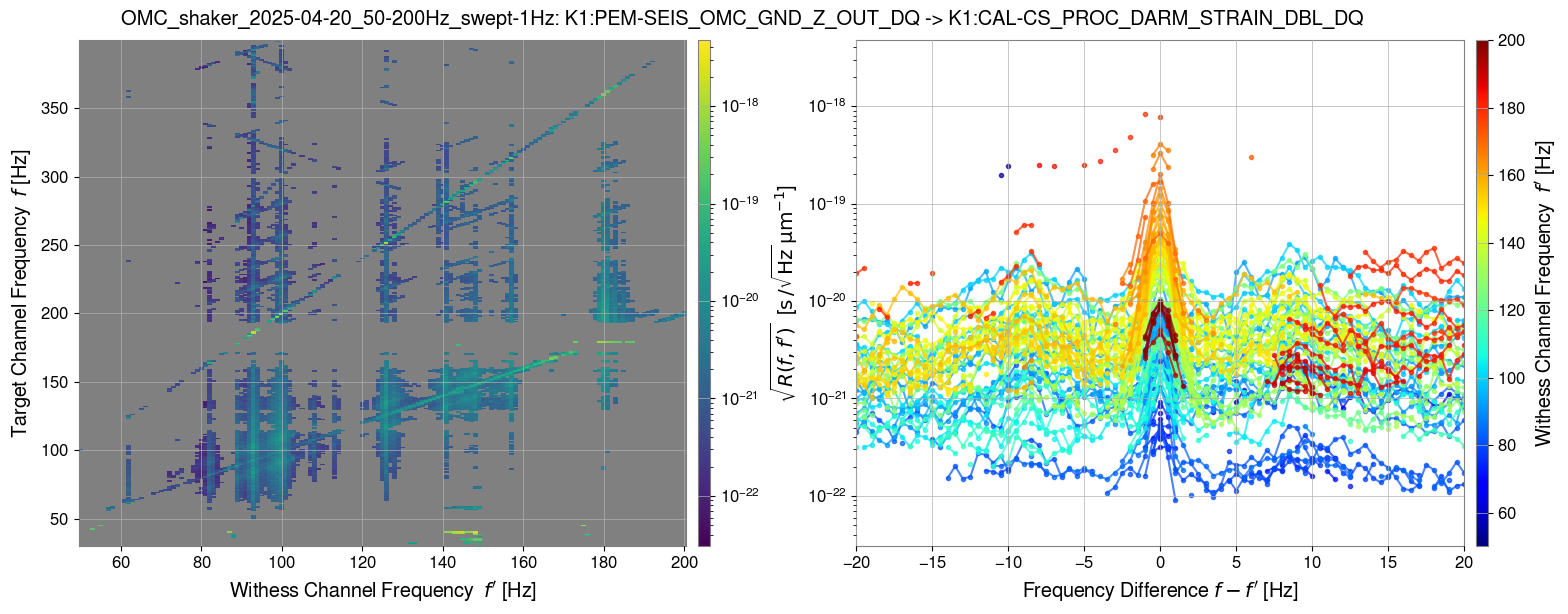
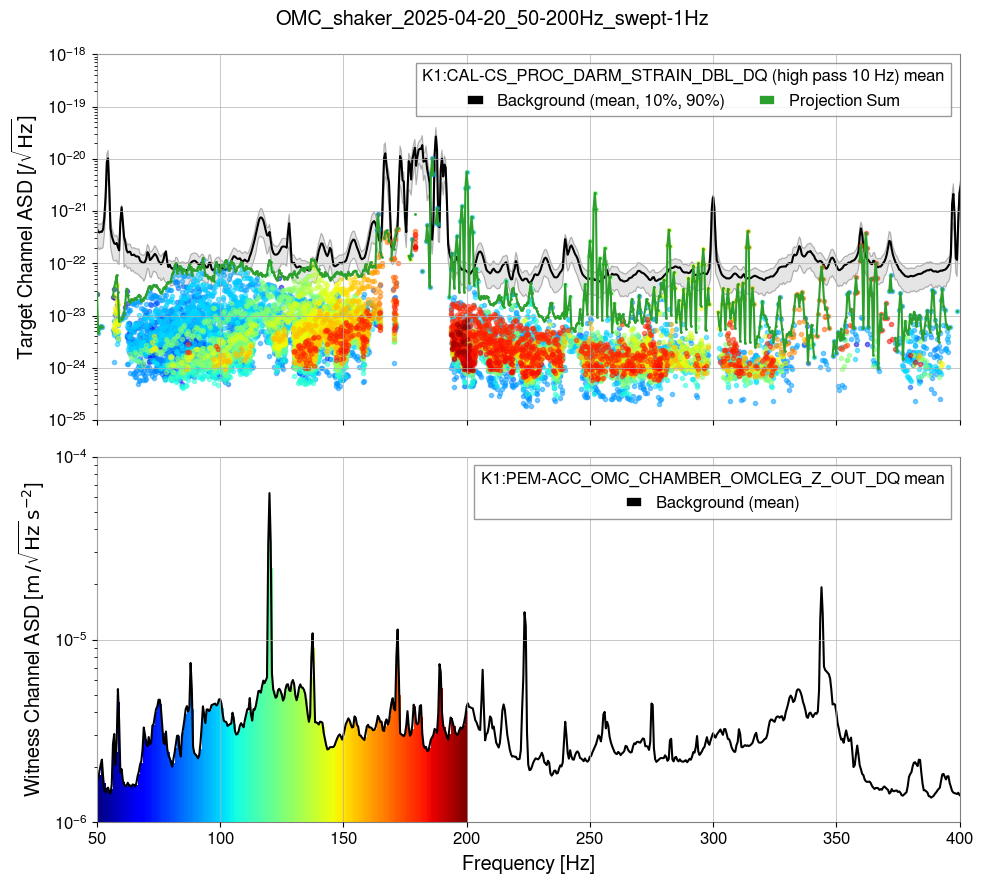
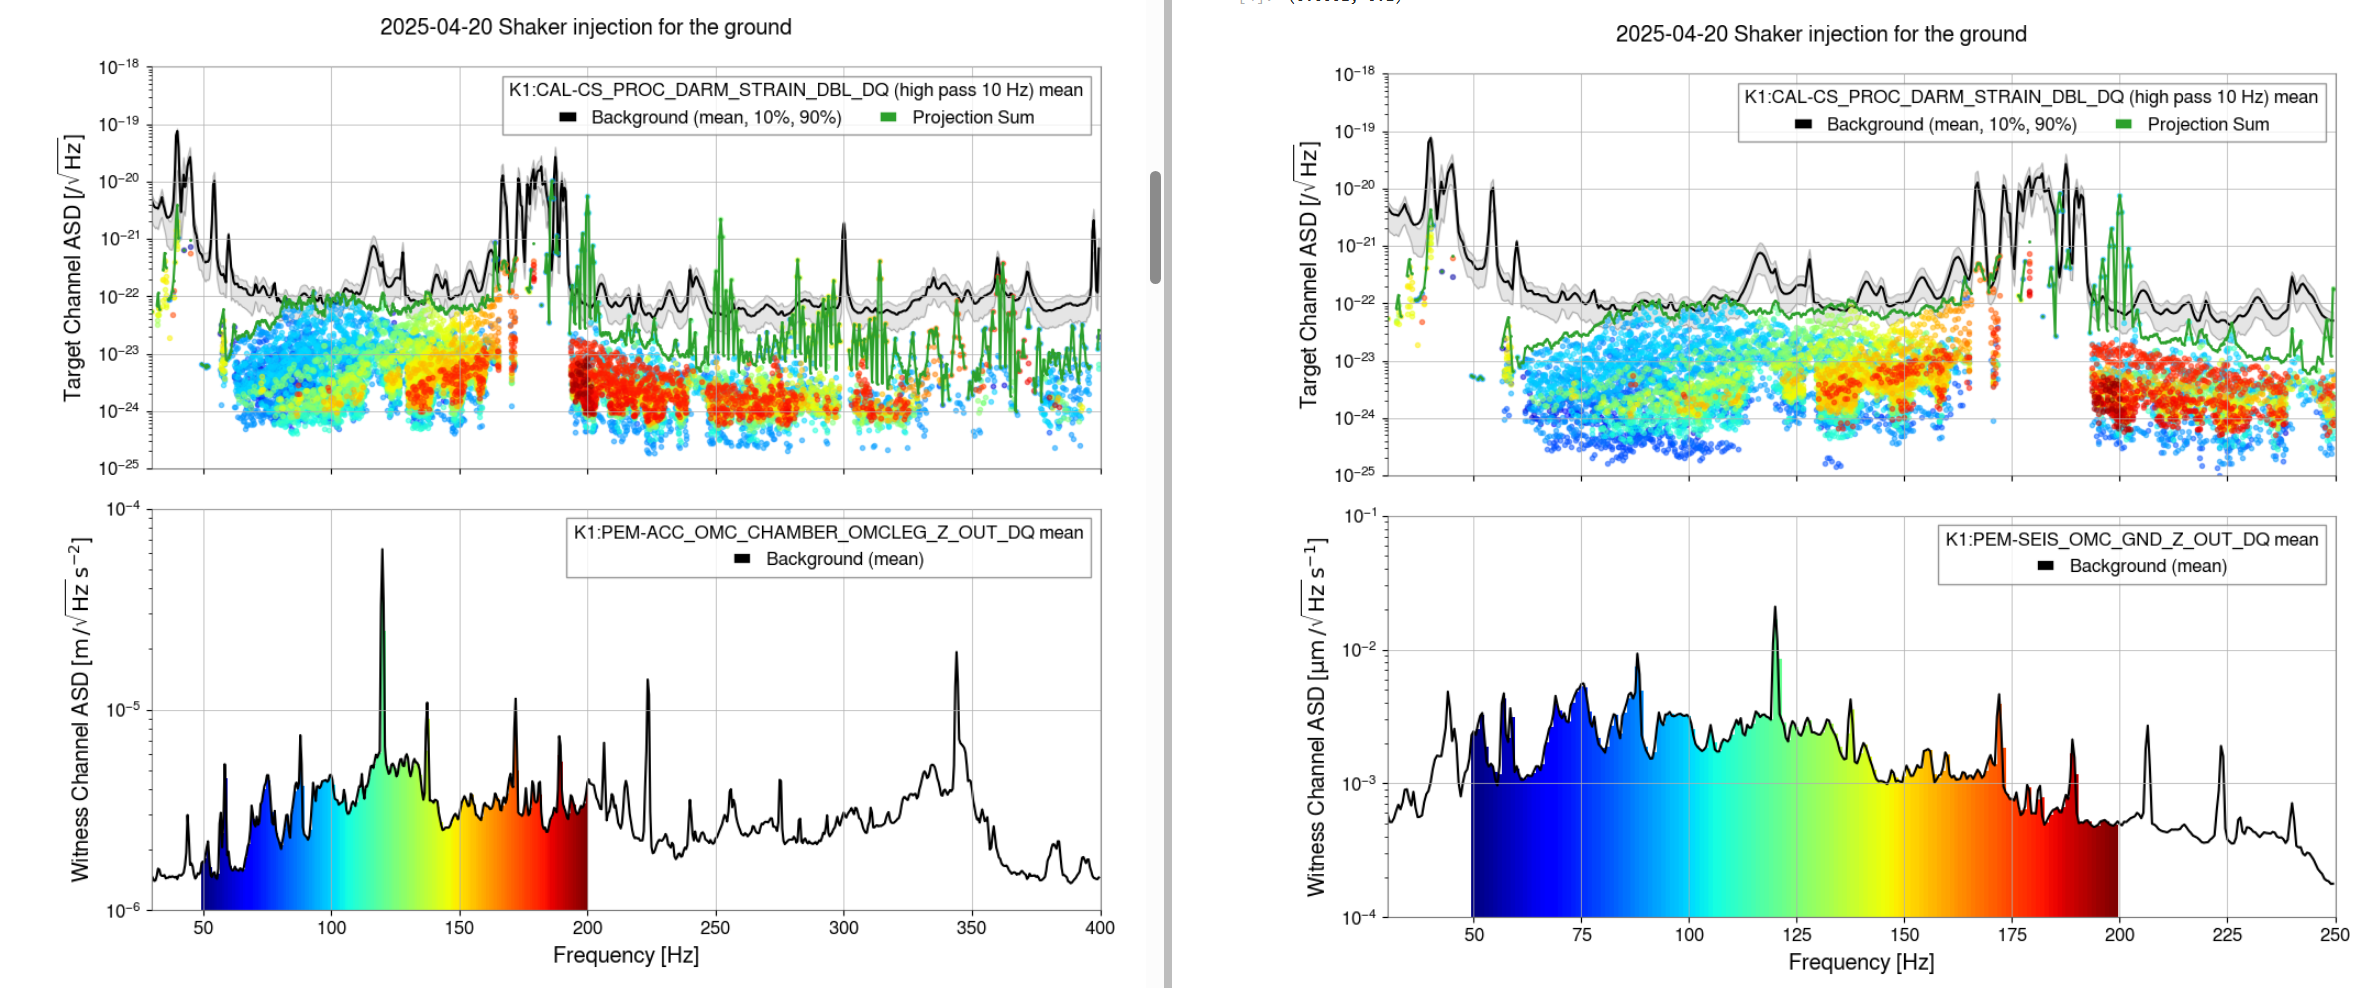
- Fig.3, 4: Projection and Response Function from SEIS_Z to Strain (scan plots PDF)
- The projected noise is very close to the current sensitivity at 80-170 Hz.
- The overestimation is found around 200 Hz, 250 Hz, etc. This is because the current response function model is considering only bilinear couplings and not including harmonics.
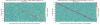
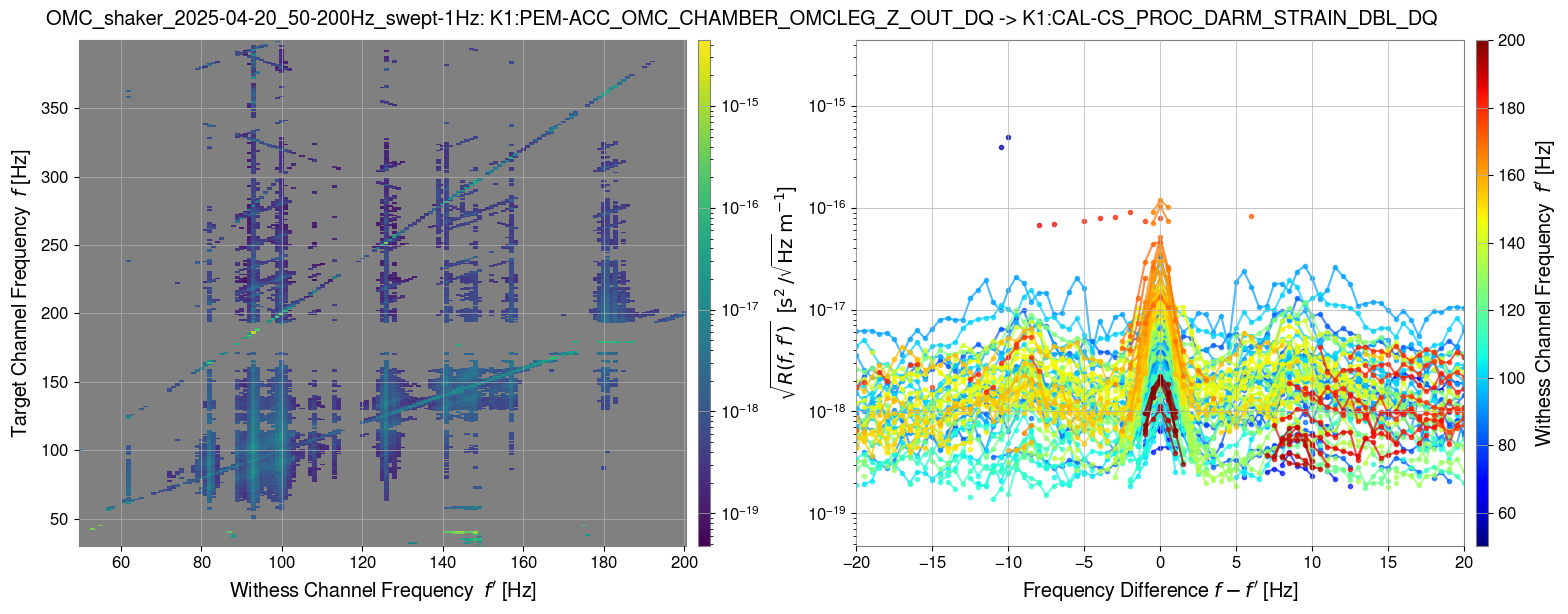
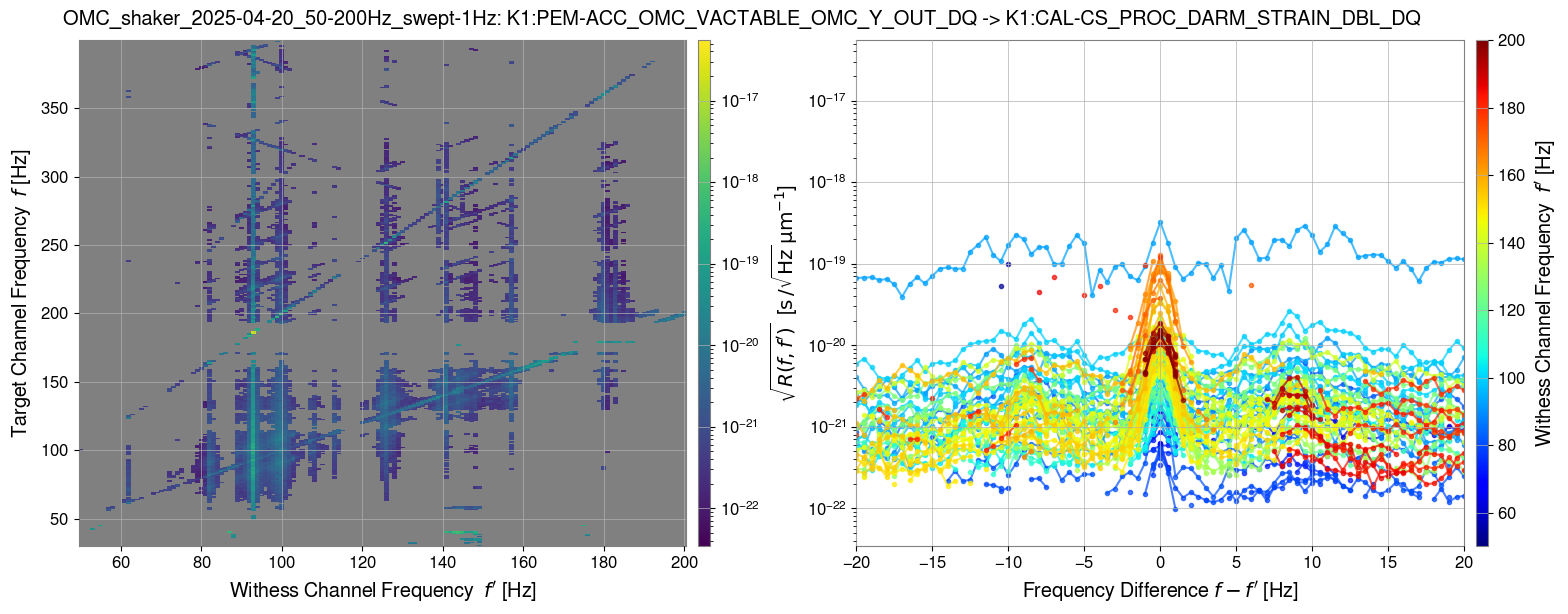
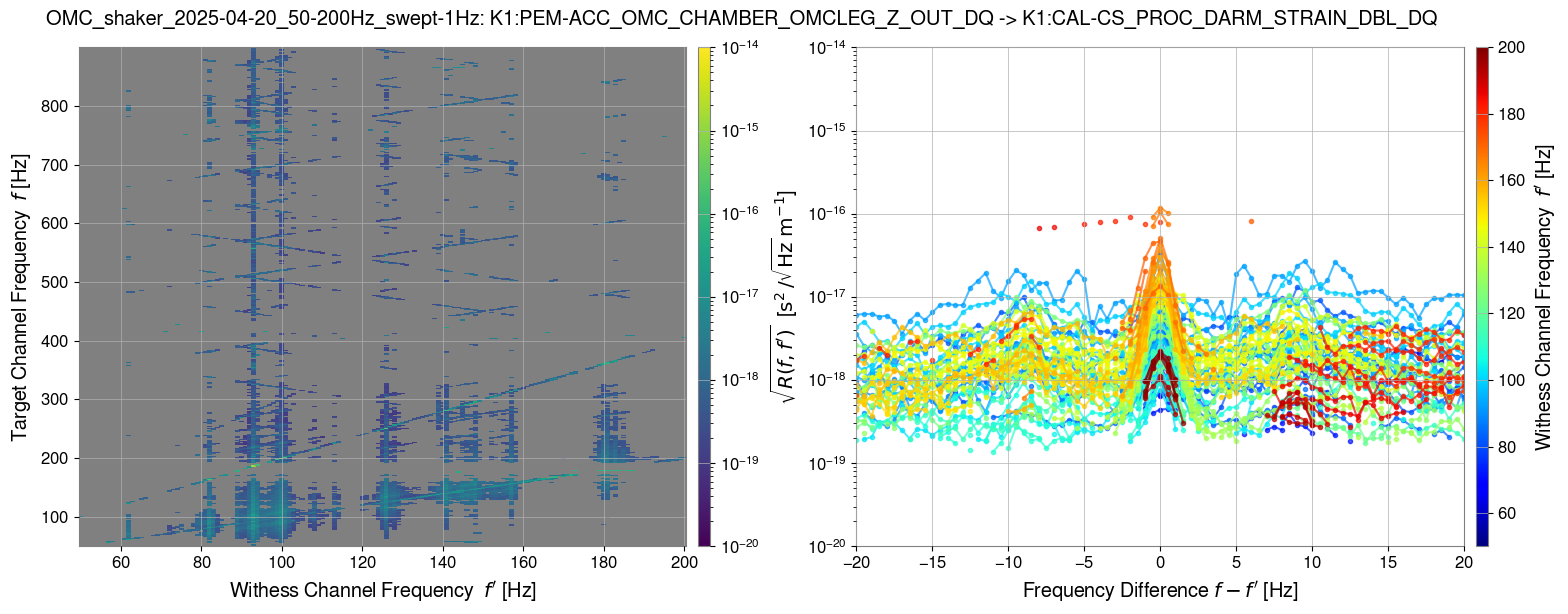
- Fig.5, 6: Projection and Response Function from ACC_leg to Strain (scan plots PDF)
- The same comments as Fig.3, 4.
- Fig.7, 8: Projection and Response Function from Geophone to Strain (scan plots PDF)
- The overestimation is found around 100 Hz. It might mean the existence of the other coupling paths.
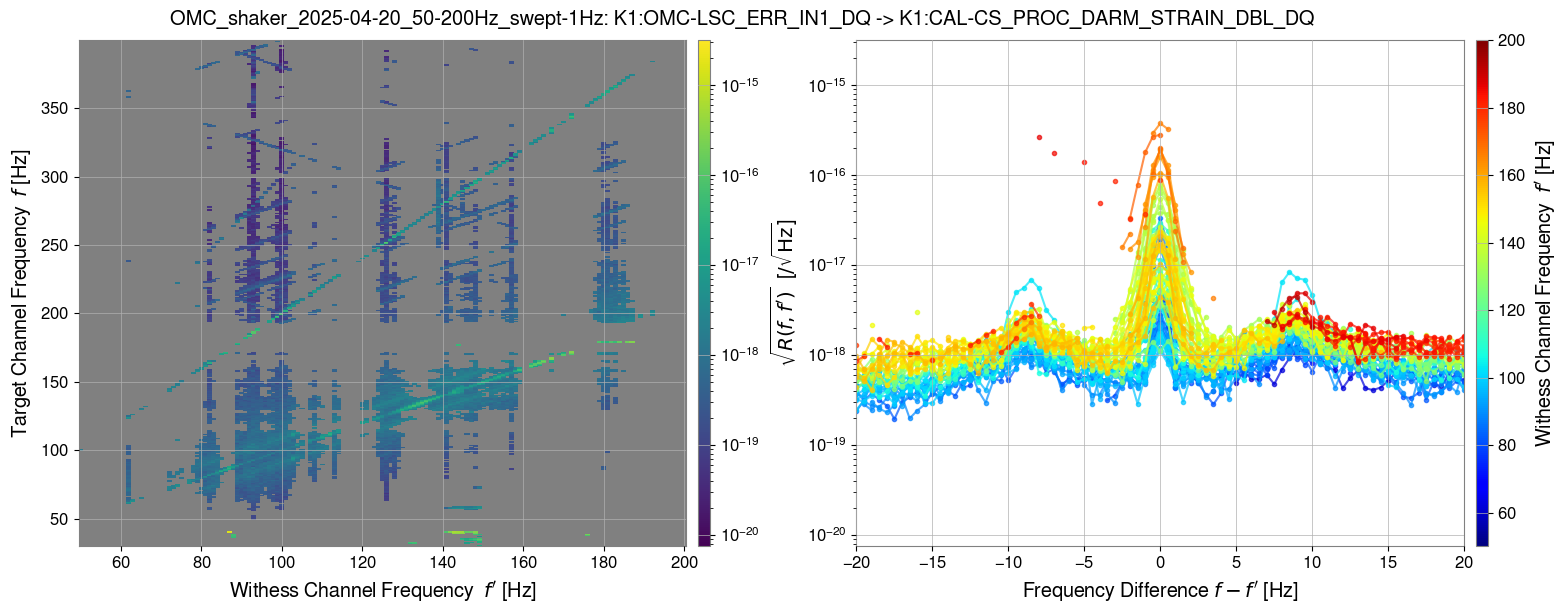
- Fig.9: Response Function from OMC_Error to Strain (scan plots PDF)
- its projection is not worth seeing because the OMC error signal without injection is occupied by the sensing noise
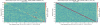
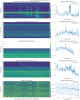
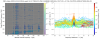
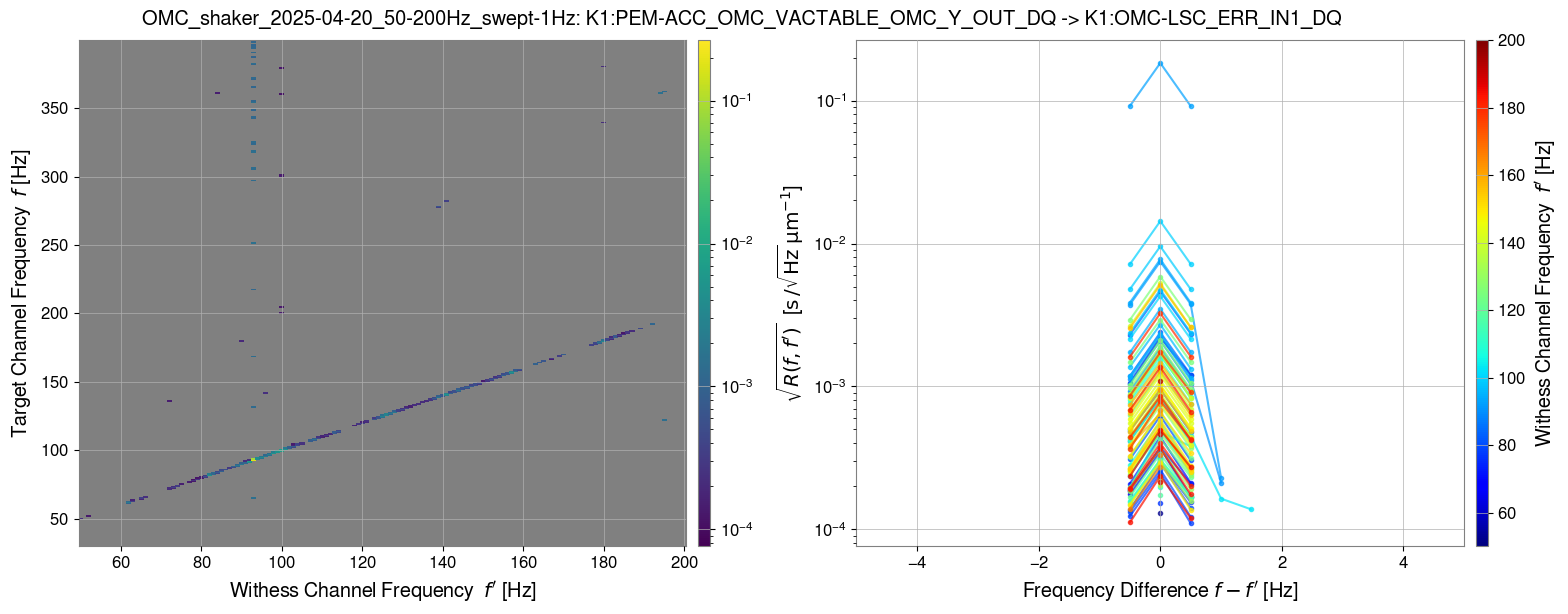
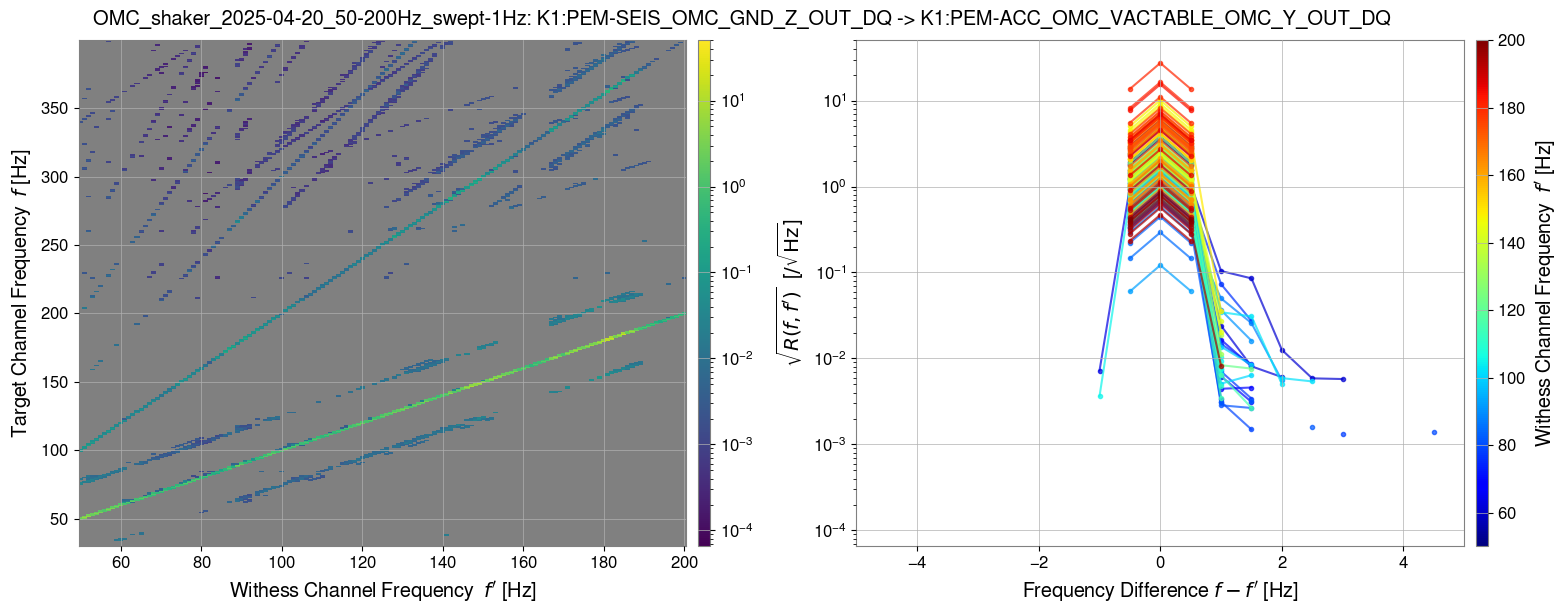
- Fig.10, 11: Projection and Response Function from Geophone to OMC_Error (scan plots PDF)
- It looks almost like a linear coupling.
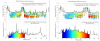
- Fig.12, 13: Projection and Response Function from SEIS_Z to Geophone (scan plots PDF)
- There are so many frequency conversions (harmonics, sidebands, and small sidelobes?).
- The projection (SEIS Z -> Geophone Y) is overestimated at 50-200 Hz. It might mean the existence of the other coupling paths.
- The vibration at 200-300 Hz could not be explained by the SEIS Z.
- These behaviors have not been found in the last year.
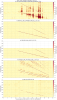

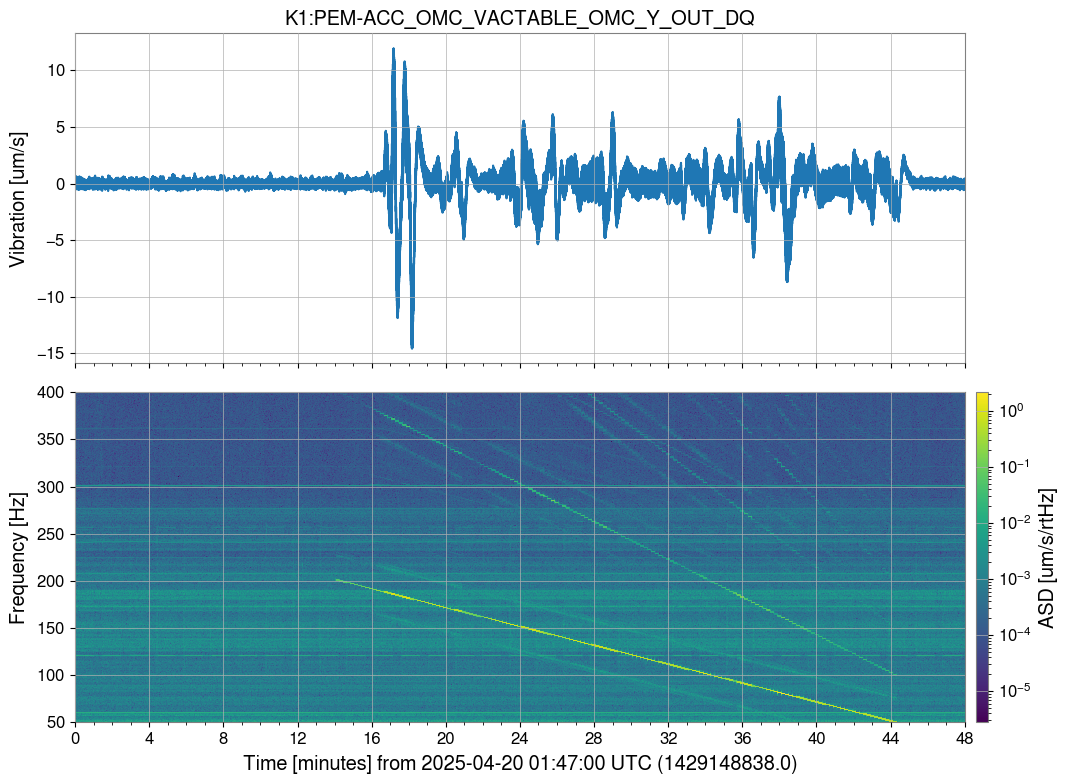
I checked the Geophone signal timeseries. It does not need to be saturated.
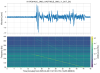
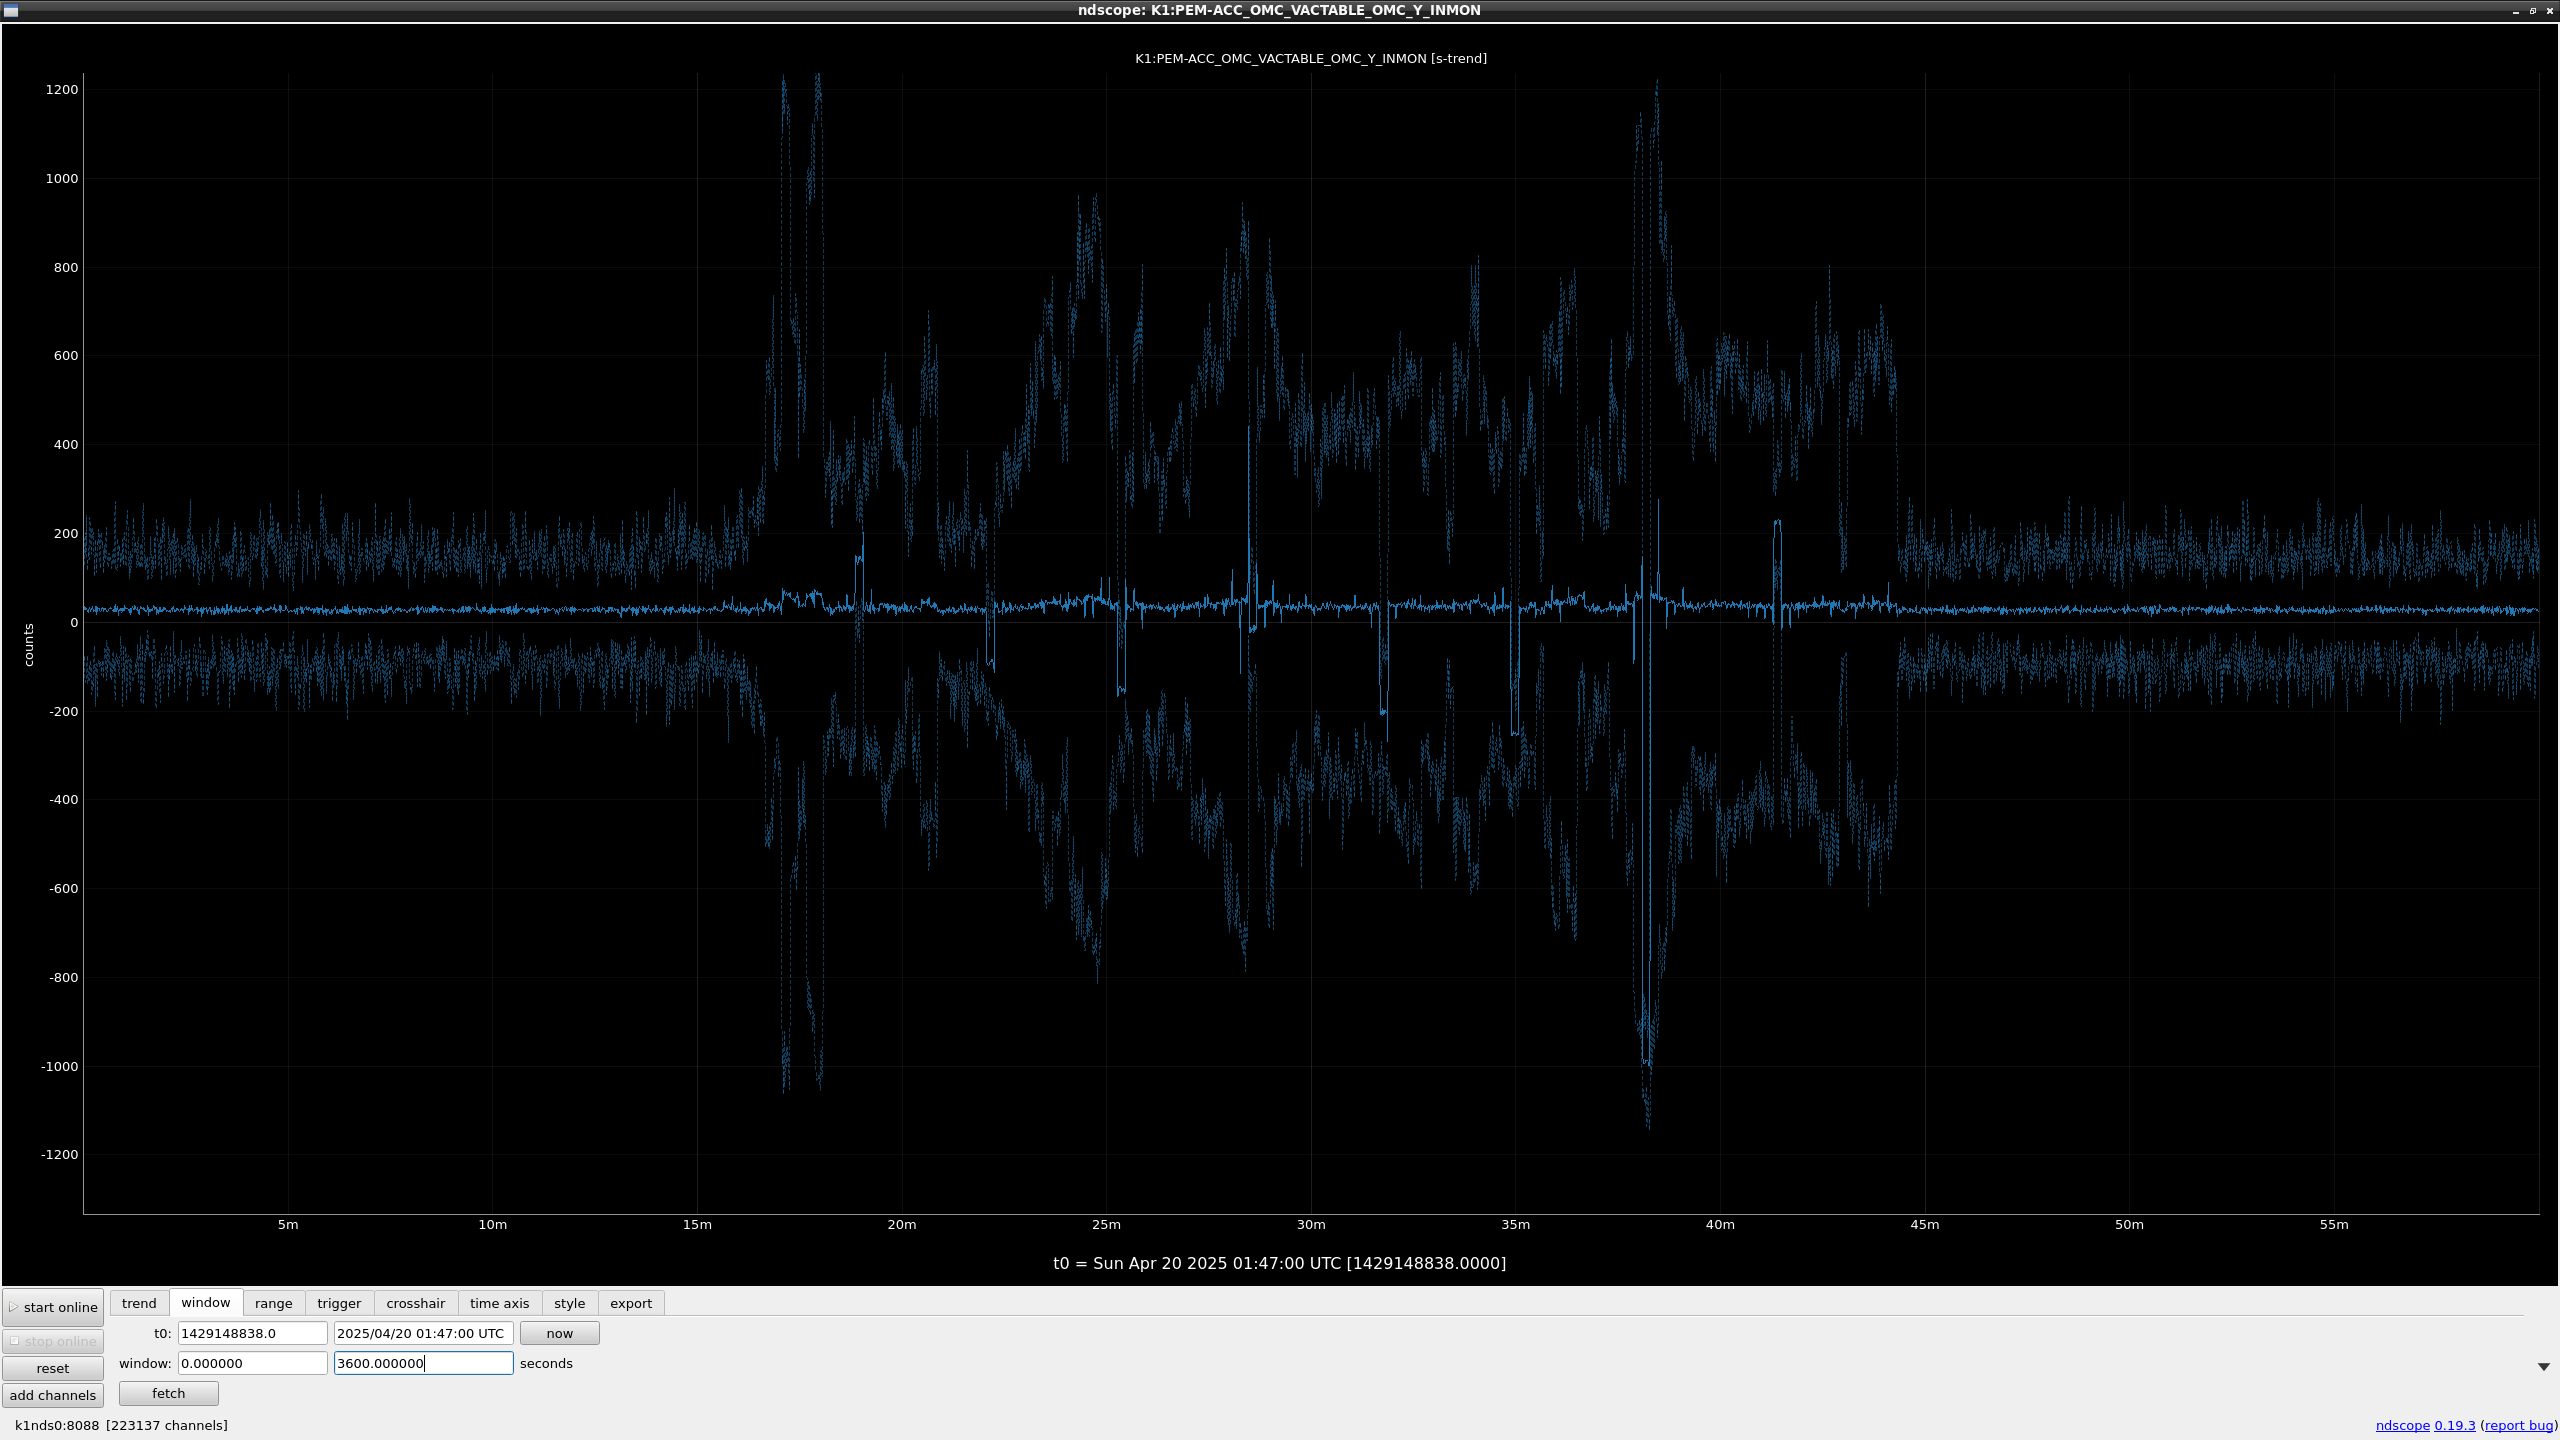
I also checked the raw input of OMC geophone signals (fig1) and found that DC value periodically (every ~3 minutes) jumped for ~10 second during the excitation.
I'm not so sure what happened during that time but it doesn't seem healthy.
So, it's better to check geophone signal first.
Note:
Sampling of the data is 16Hz, so it is probably contaminated by aliasing noise but DC jump would not be a fake signals because it lasts for about 10 seconds, which is much longer than the sampling frequency.

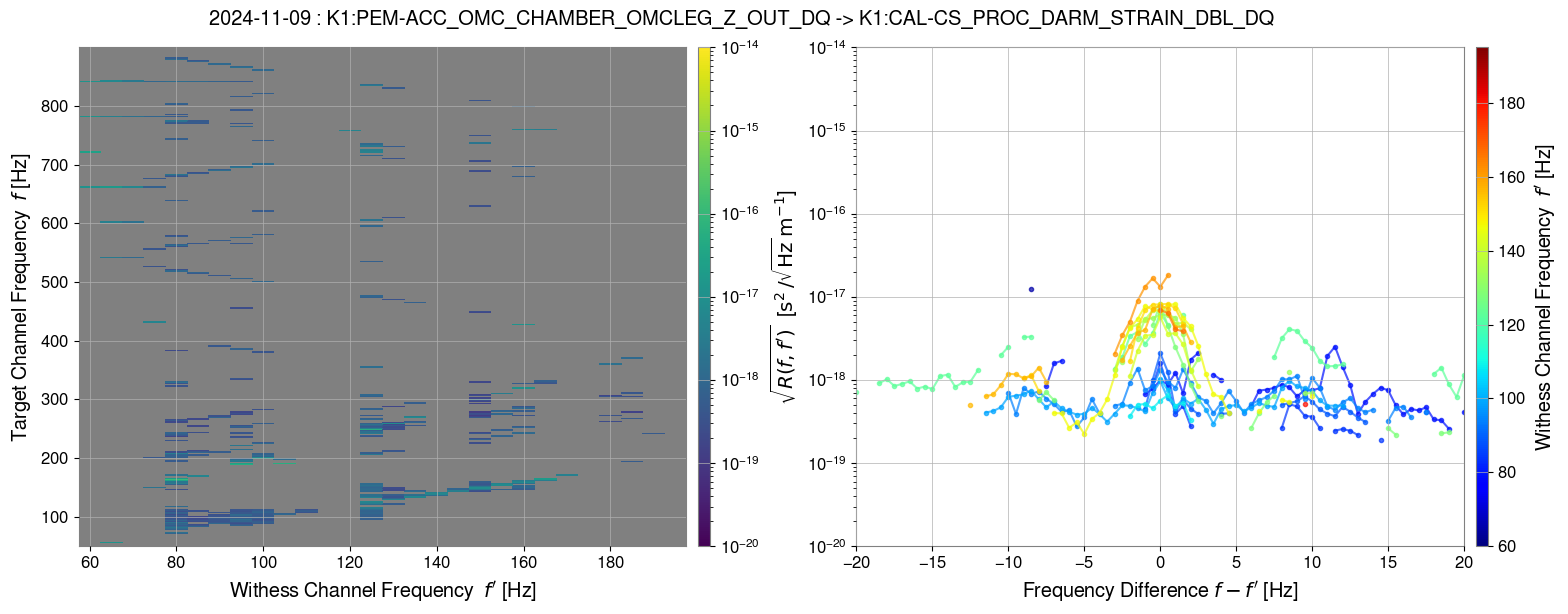
I also analyzed the shaker injection test for the OMC ground performed on 2024-11-09 (klog31563) and compared it to the recent data.
Because the geophone signal is not healthy, the leg ACC (in air) is used.
The response and projection from the ground vibration to the strain are significantly larger around 100Hz now.


So sad news.... For your reference, a document used for the technical review for the OMC shroud can be found in JGW-T2415840.
I analyzed the same analysis using SEIS_Z or ACC_Z and compared the results for both 2025-04-20 and 2024-11-09 data.
For both days, the results of using SEIS_Z and ACC_Z are consistent.
By the way, even before the shroud installation (2024-11-09), the linear-like coupling and its siderobe were found.
On 2024-10-16 (before the stack connection), a ground shaker injection was performed (klog31337), but almost no significant excess was found in the DARM. (due to the shaking amplitude not being enough?)
.png)
.png)
.png)
scanning plots (Leg ACC -> Strain) for each frequency injection
https://gwdoc.icrr.u-tokyo.ac.jp/cgi-bin/private/DocDB/ShowDocument?docid=16648
I also evaluated the projection from the Leg ACC to the OMC error (length)
Scanning plots for each frequency injection are here
https://gwdoc.icrr.u-tokyo.ac.jp/cgi-bin/private/DocDB/ShowDocument?docid=16649

.png)
.png)
.png)
.png)
.png)
.png)
.png)
.png)
.png)
.png)
.png)
.png)
.png)