Reports 1-1 of 1 Clear search Modify search
PEM (Center)
taiki.tanaka - 13:40 Thursday 16 May 2019 (8887) Print this report
Acoustic Injection at the center area

Federico, Irene, Eleonora, Washimi, TTanaka


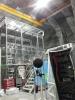
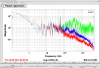
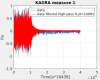
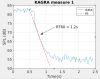
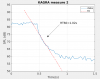
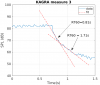
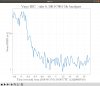
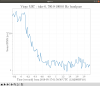
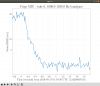
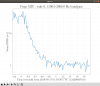
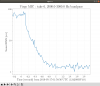
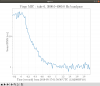
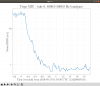
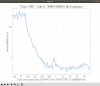
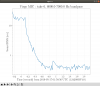
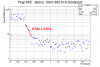
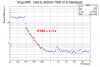
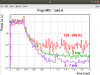
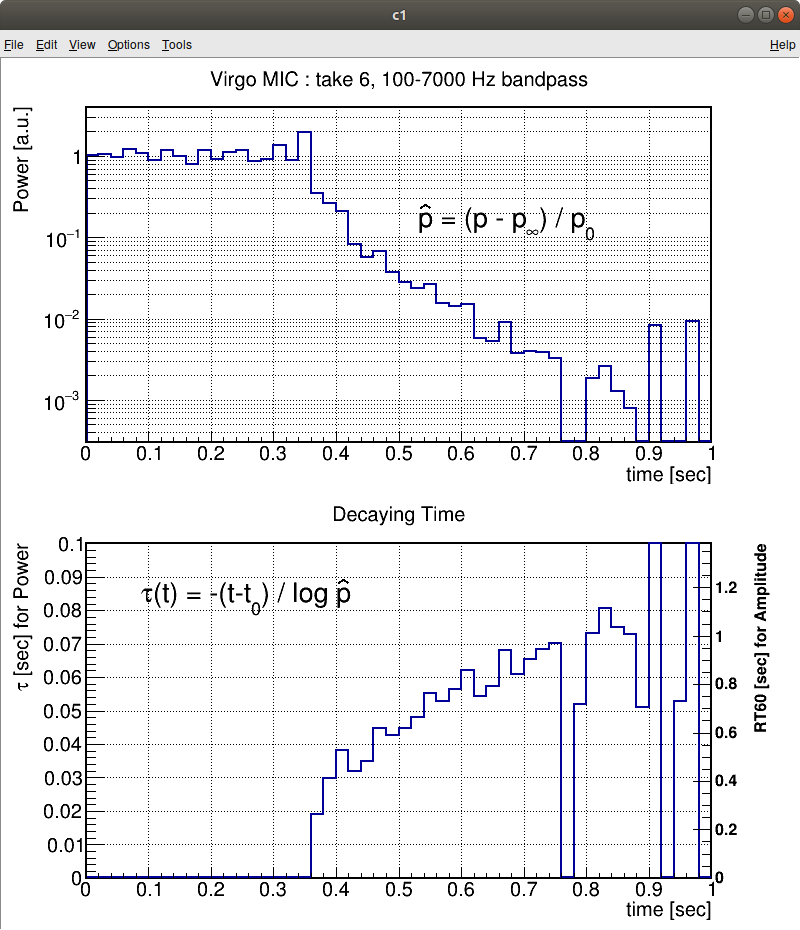
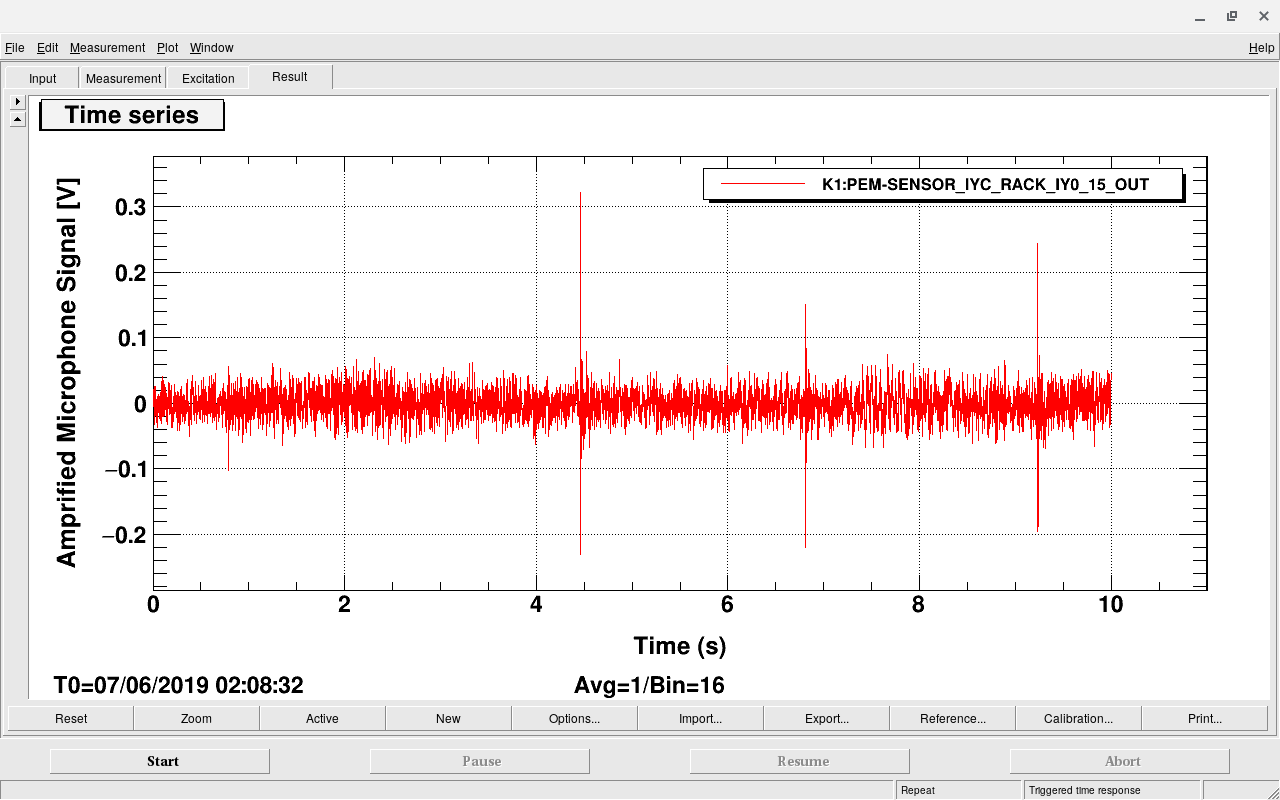
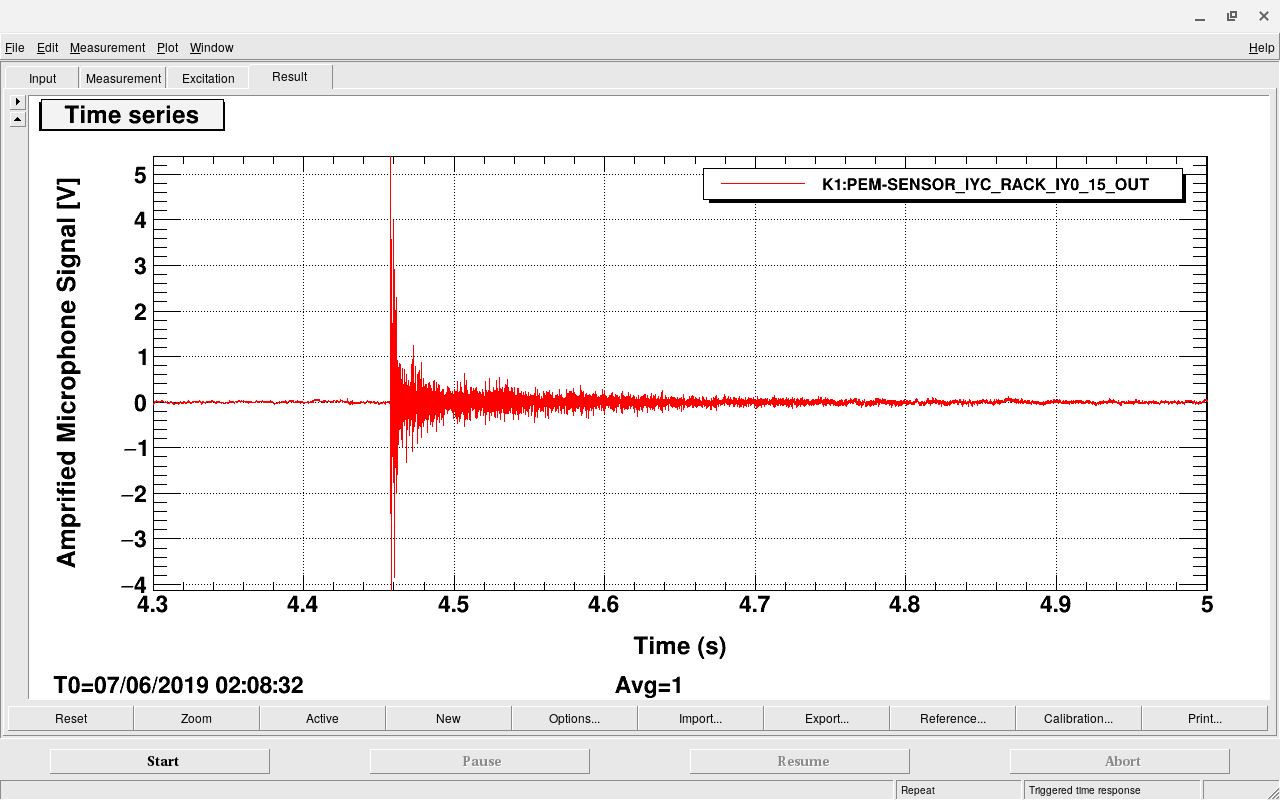
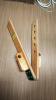
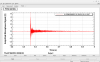
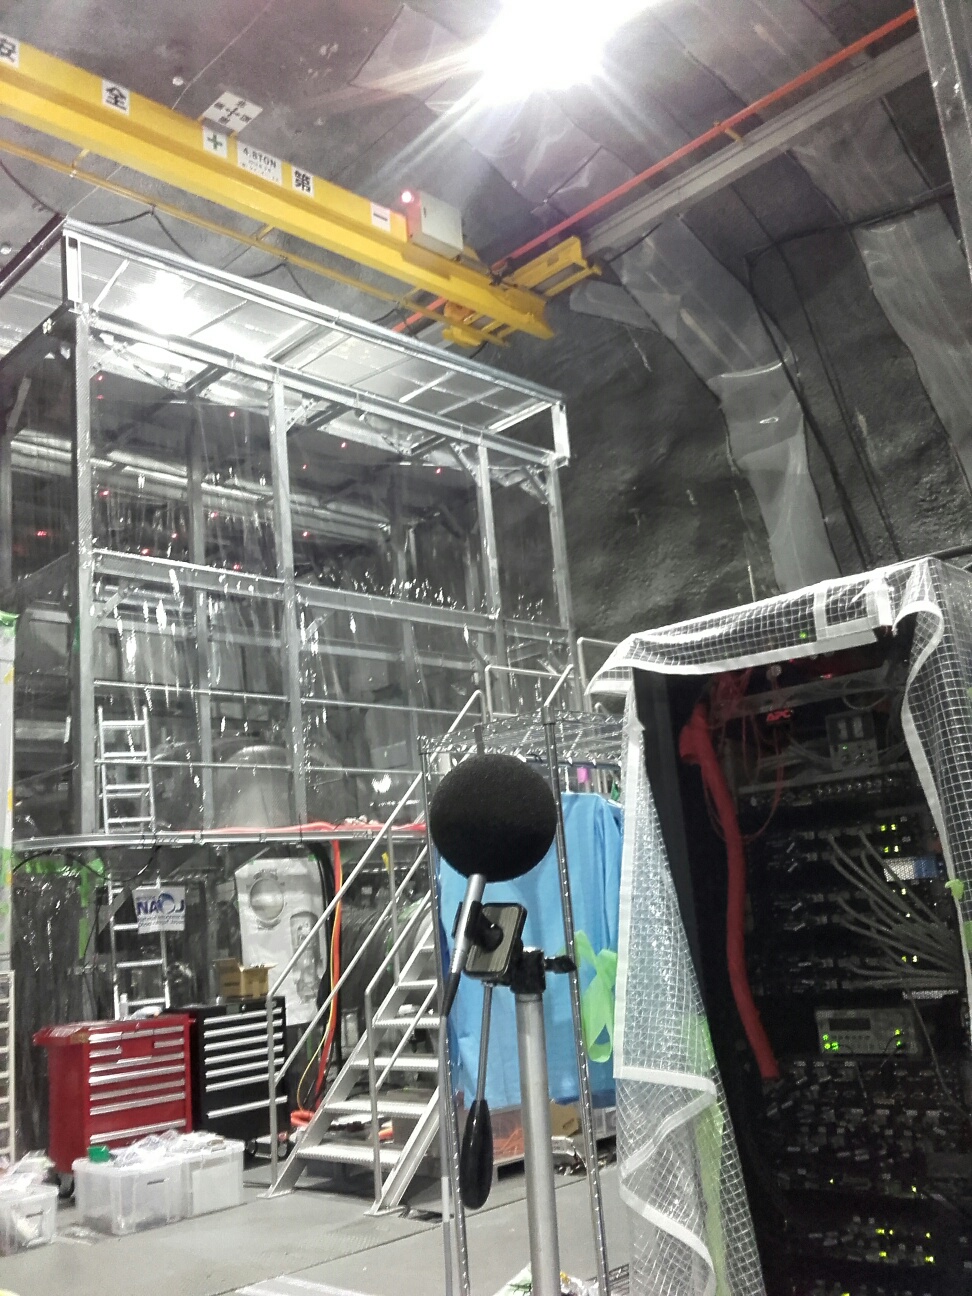
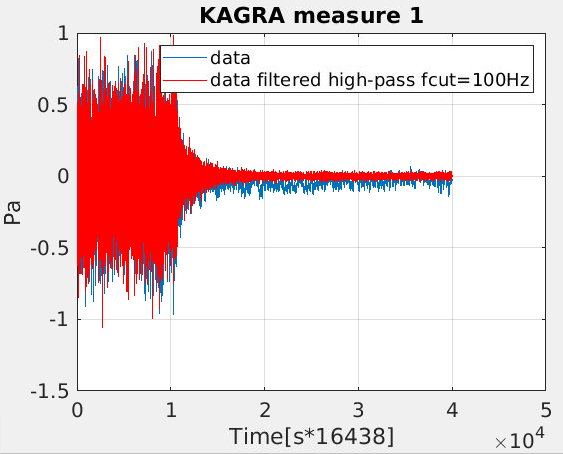
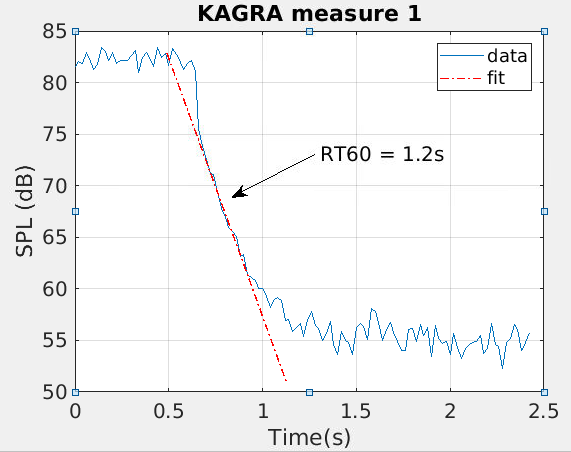
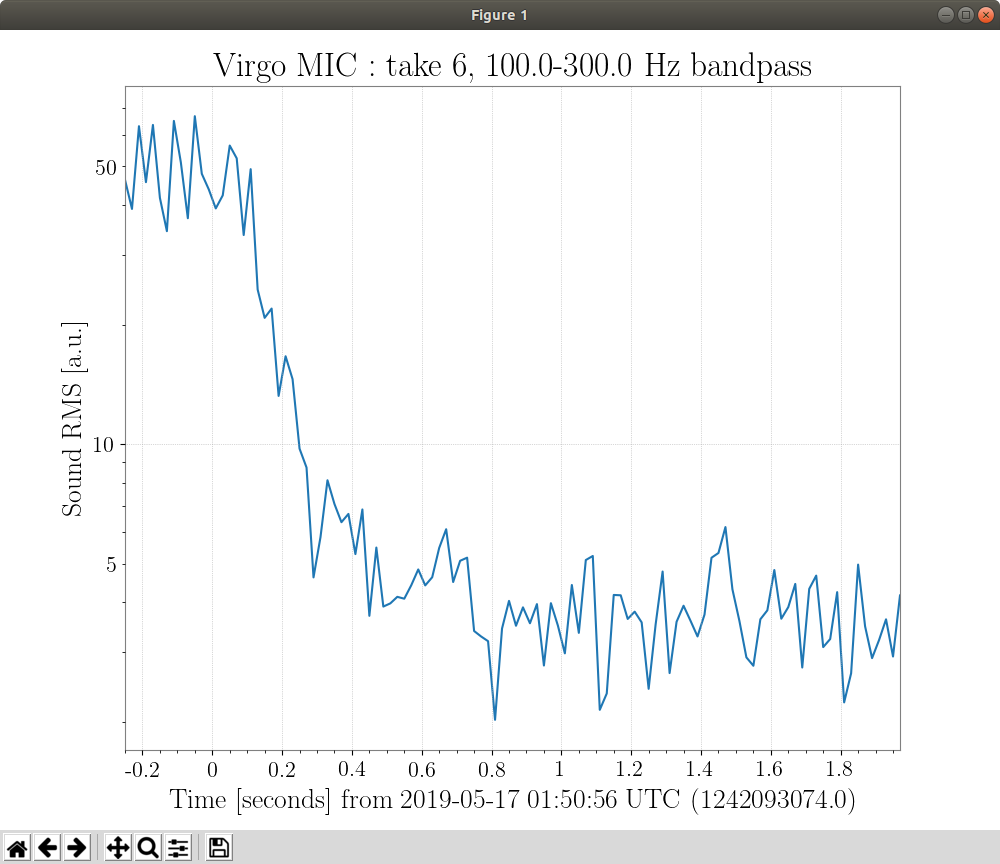
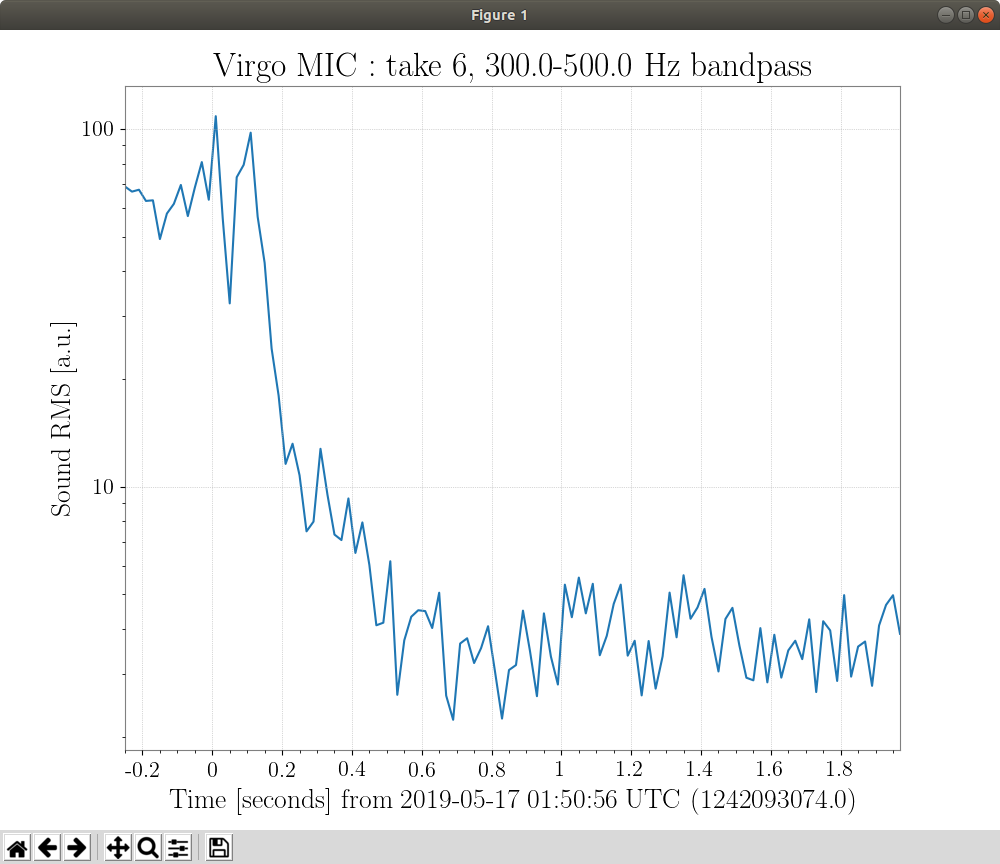
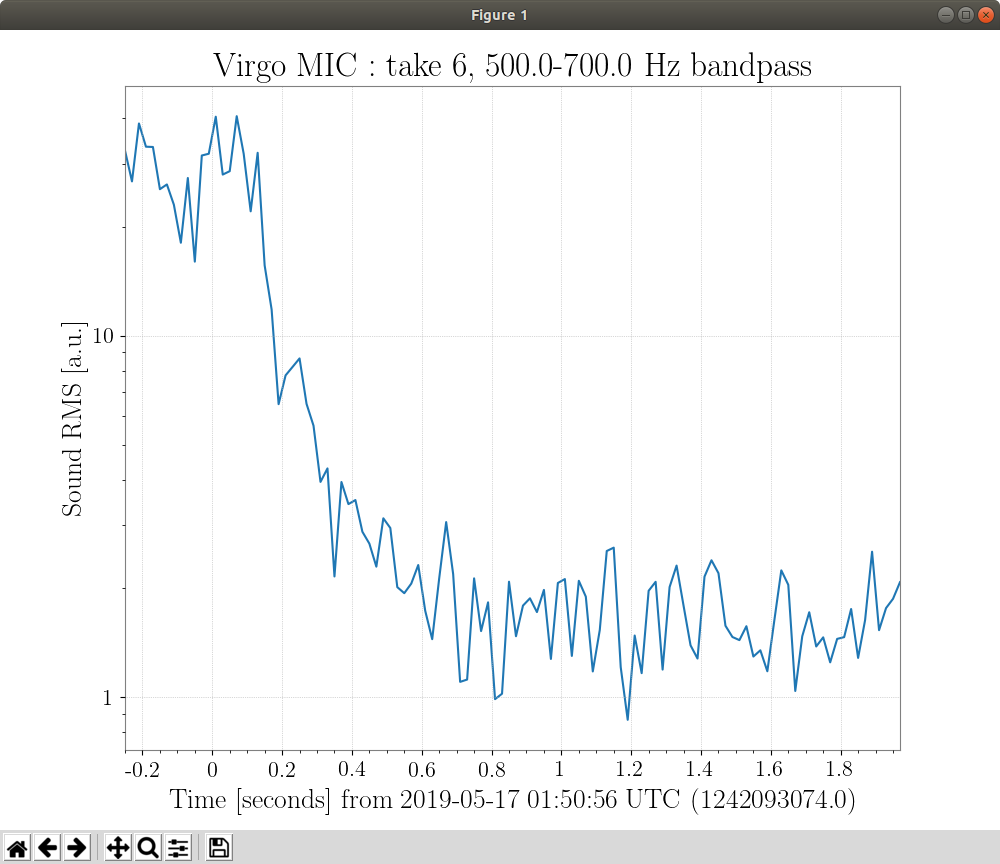
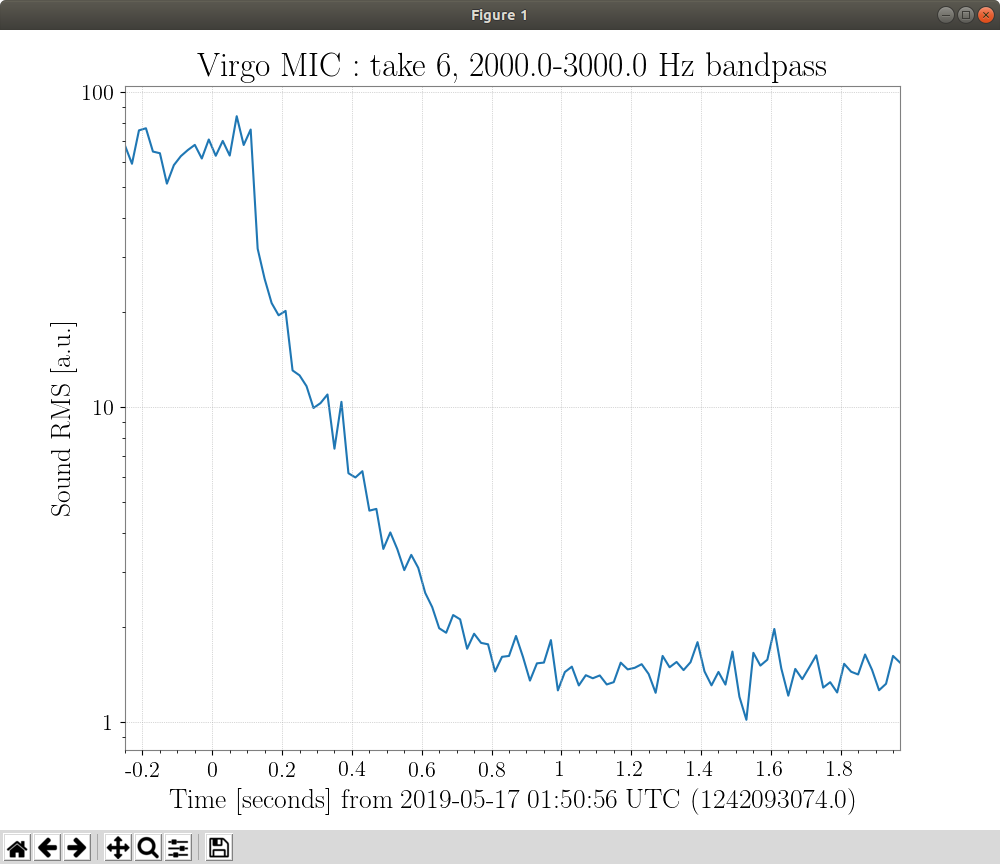
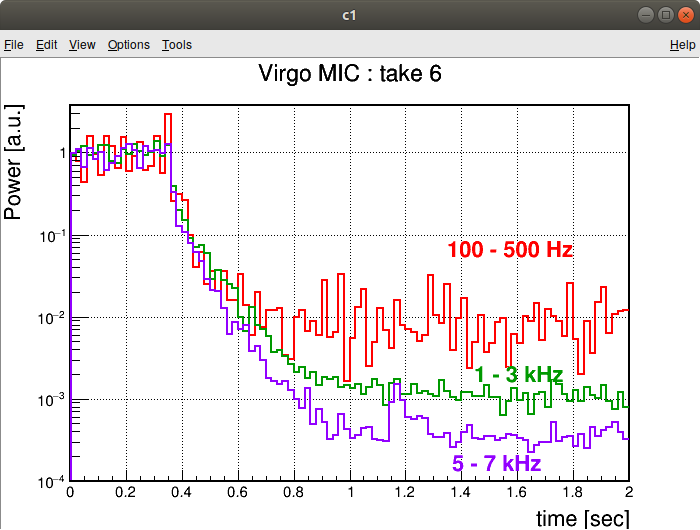
We performed acoustic injection to measure the echo at the center area.

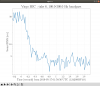
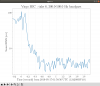
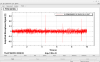
We outputted whitening sound around 10:30-50 and turned off some machines (below) around 10:26-11:21.

-PR booth air filters
-BS booth air filters
-SR booth air filters
-SR-C cooler&fan
-BS-C cooler&fan
-MCF-C cooler&fan
-SR2 portable filter in front of SR booth
-PR2 portable filter in front of BS booth
Comments to this report:
irene.fiori - 14:41 Tuesday 21 May 2019 (8920) Print this report
Washimi, TanakaT, Irene, Federico, Eleonora.Polini, Takaki.Yokozawa

On May 17 we returned to Center area and, in addition to the above, we also switched off:
MCE booth air filters
MCF booth air filters
IYC cooler and fan
IXC cooler and fan
Big air compressor

In Figure 1 is a picture of the microphone in center area.

In Figure 2 we show microphone spectra: blue=before switching off devices (typical condition at present), red = after switch off of devices (note this picture is from the yesterday switch off so the here mentioned devices were still on), green = when we inject white noise to the loudspeaker.

We injected white noise to the loudspeaker (DAC level of 10000). And we abruptly interrupt the sound by unplugging the loudspeaker. We repeated the same three times.

Here a rough analysis of the data.

Figure 3 shows the time decay of the sound. Blue is unfiltered, red is applying high-pass filter above 100Hz (see from Figure 2 that below 100Hz we are not able to overcome the background noise, so this part is useless).

Figure 4 shows the "sound pressure Level" in dB which is computed from microphone RMS (Prms) as: L(i)=20*log10(Prms(i)/Pref), Pref = 20 microPa, in steps of 0.02s. Also shown is a linear fit of the sound decay. From the slope of the fit it is computed the "reverberation time" or RT60 that is the time in which the sound pressure level (or rms) reduces by 60dB, according to this reference: https://en.wikipedia.org/wiki/Reverberation

Figure 5 is the similar plot of the second measurement.

Figure 6 is the similar plot of the third measurement. In this case, we attempted independent fit for the first part and the second part of the decay, as it is evident that all cannot be explained with a single exponential decay.

Table with rough results:
measure.n RT60[s] comment
1 1.2
2 1.0 fit looks not so nice
3 0.8, 1.7 average = 1.25


Conclusions:
-------------
A rough measurement of Kagra center hall reverberation above 100Hz is 1.2s.
For comparison RT60 of the Virgo experimental halls is about 4.5 s: see https://tds.virgo-gw.eu/ql/?c=13570) and https://logbook.virgo-gw.eu/virgo/?r=42991
The much larger decay time of Virgo it is likely due to the fact that the walls are made of concrete or clean panels which are very reflective, while Kagra walls have rough surface (that helps a lot!)
The fact that the decay time cannot be explained with a single decay is first because reverberation time typically depends on frequency, and becomes shorter for high frequencies. This effect is clearly measured at Virgo (see same references)
The Kagra measurement can (if needed) be improved by increasing the level of injected noise. This was done at Virgo using the impulsive noise generated by exploding firecrackers.
Images attached to this comment
Washimi - 10:01 Thursday 23 May 2019 (8950) Print this report

I update my analysis. (Previous result, already reported, is JGW-L1910221-v1)


To obtain the frequency dependence of decaing time, I select the region of

  •     100-300Hz
  •     300-500Hz
  •     500-700Hz
  •     700-1000Hz
  •     1000-1500Hz
  •     1500-2000Hz
  •     2000-3000Hz
  •     3000-4000Hz
  •     4000-5000Hz
  •     6000-7000Hz


Their shapes are not simple exponentioal yet.

But to compair them by eye, decaying time is increasing as the frequency.

Images attached to this comment
tatsuki.washimi - 17:32 Friday 24 May 2019 (8964) Print this report

I perform fitting to the RMS timeseries, and obtain the RT60 value. (see attachments)

The results are

  • 0.97 s @ 100-300 Hz
  • 1.01 s @ 1.5-2 kHz
  • 1.11 s @ 6-7 kHz


In these bins, the center value and error is obtained by TH1::GetStdDev() / TH1::GetStdDevError() in ROOT 6.
But these errors look too small

Images attached to this comment
tatsuki.washimi - 18:41 Monday 27 May 2019 (8986) Print this report

The shape of RMS time series has some periodic structure due to the bandpass filter.

This is reason why the deviation between bins were larger than StdDevError in my previous k-log.

So, I try to evaluate the decaying time by power integral instead of RMS.


For each 0.02 sec, generate the power spectrum dencity and integral it within a frequency region.

I performed this procedure for 3 regions, 100-500 Hz, 1-3 kHz, and 5-7kHz. (attached plot)

In this plot, significant dependence of frequency is not seen.

Images attached to this comment
tatsuki.washimi - 10:20 Tuesday 28 May 2019 (8991) Print this report

To evaluate the non-constant dacaying time, I apry the method used in scintillation detector.

For the time series of a normalized power

,

we can calicurate tau as


The result is here,

Images attached to this comment
tatsuki.washimi - 12:53 Saturday 08 June 2019 (9149) Print this report

Yesterday (2019/6/7), I tried the followup measurement of the accuostic reverberation time in the corner area.

I used the starter for sports (JGW-S1910280).


I used diaggui for data taking, instead of changing the DQ rate.

Images attached to this comment
Search Help
×

Warning

×