Reports 1-1 of 1 Clear search Modify search
PEM (Tool)
tatsuki.washimi - 17:53 Tuesday 27 October 2026 (37750) Print this report
VAC Monitor – Work Log (2026-10-27)

Problems

  • The VAC page stopped updating after 2025-01-31, when the legacy vacuum DAQ (vac_now.dat via K1VAC_PRESSURE_DAQ.py) stopped.
  • chlist_VAC.csv still listed the legacy channels. TimeSeriesDict.fetch fails entirely if one channel is missing, so no data was fetched.
  • The empty DataFrame crashed plot_VAC.py (IndexError) and truncated data_VAC.csv to 3 bytes.
  • Plot_Trend raised ZeroDivisionError for gauges reading 0 Pa.
  • The summary legend was cluttered with inactive channels.
  • The forecast was a quadratic fit in log-log space. It extrapolated upward even for clearly monotonic pump-down data.
  • Some changes in SEM/ were reverted at 16:13 (chlist_VAC.csv, pySEM.py, backfill_VAC.py), and the cause is unknown. SEM_dev and SEM were also both running SEM.sh from cron against the same log.

Actions

  • Replaced chlist_VAC.csv with 25 active channels (CS 8, X 10, Y 7), matching VAC_OVERVIEW.adl. The old list is saved as .bak_old.
  • pySEM.py changes:
    • get_TSD() falls back to per-channel fetch.
    • Plot_Trend is guarded against vmin <= 0.
  • plot_VAC.py changes:
    • CSV writes are protected against an empty DataFrame.
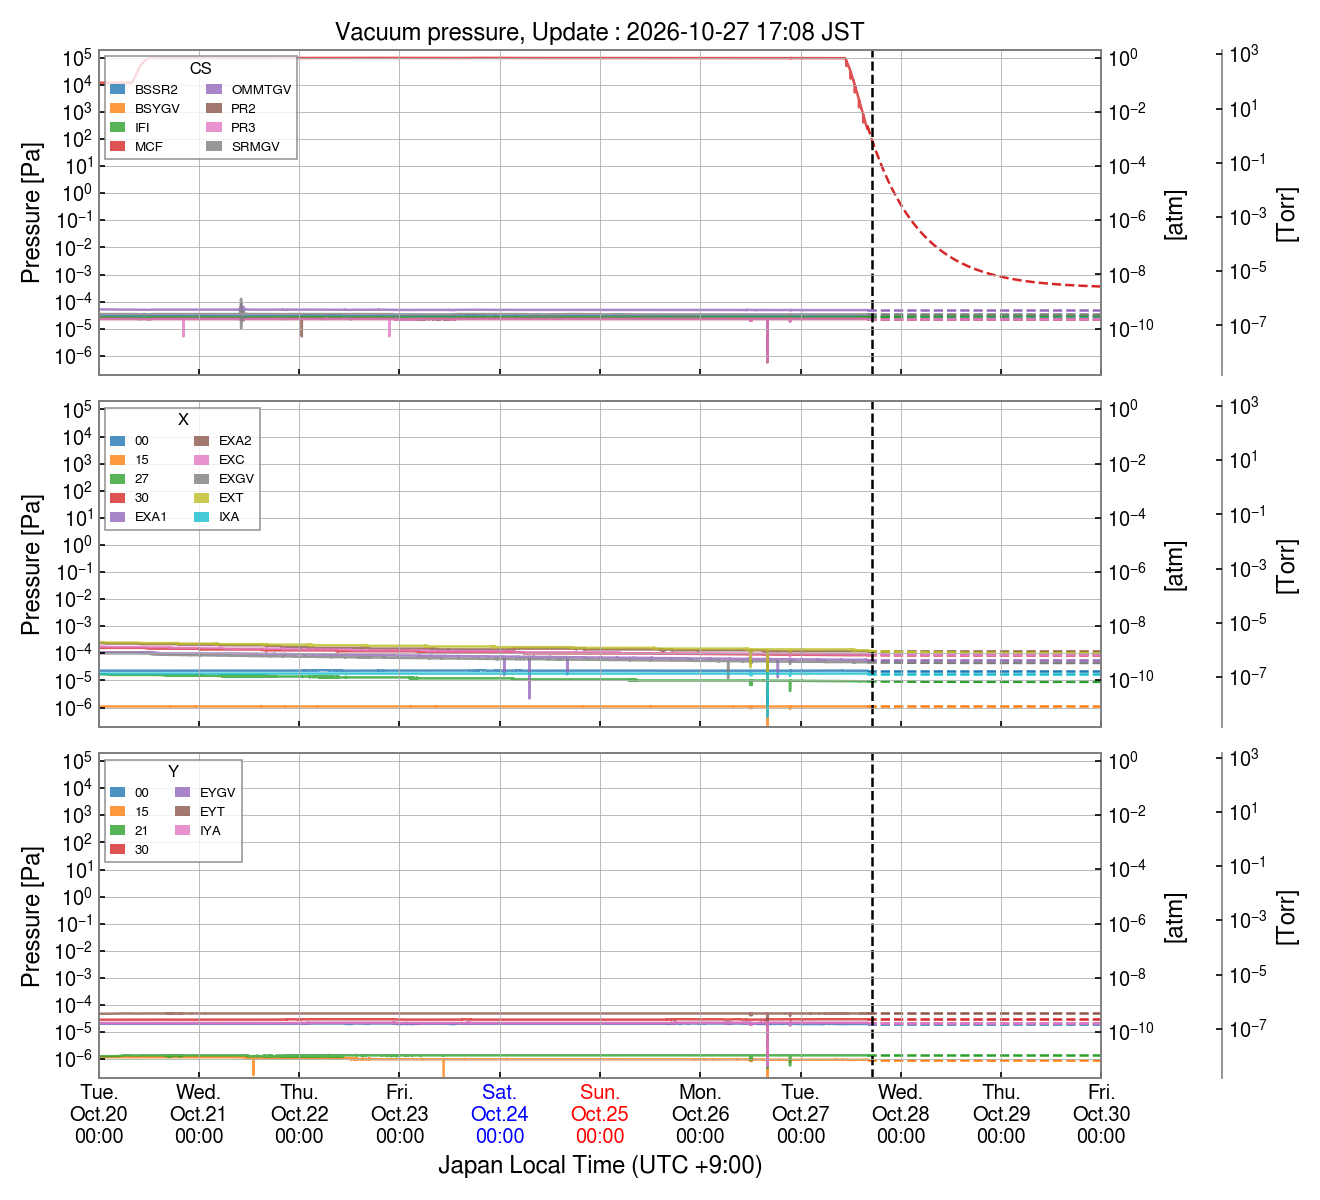
    • The legend shows only channels with data in the last day, in 2 columns.
    • The forecast was rewritten as a damped log-linear extrapolation (details below).
  • Restored the pre-2025 history from SEM_dev, then backfilled 2025-02-01 to 2026-10-18 with backfill_VAC.py. The 10-day recent window was processed first.
  • Rewrote index.html with the new per-chamber gauge links (MCF, IFI, PR2, PR3, BS-SR2, GVs, X/Y arms).
  • Re-synced chlist, pySEM.py and plot_VAC.py between SEM and SEM_dev after the revert. data_VAC.csv was restored from /mnt/slowmonitor/data/.
  • Removed the SEM_dev SEM.sh cron line, leaving only the SEM hourly job at :07.
  • The new forecast works as follows:
    • The slope of log10(P) is estimated over the last 6 h with Theil-Sen.
    • The slope decays with a 12 h time constant.
    • The result is clipped to 1e-8–101325 Pa.
    • Decreasing, increasing and flat trends were checked on synthetic data.

Final state

  • data_VAC.csv is about 19 MB and 35,867 hourly rows, continuous from 2024 to Oct 2026.
  • All subplots and the summary plot show current data.
  • The MCF pump-down forecast decays monotonically and levels off, and increasing trends are extrapolated upward.
  • The hourly cron updates the page.

Remaining items

  • backfill_VAC.py is a 0-byte file, with no copy in SEM_dev. It is no longer needed because the backfill is complete.
  • The forecast does not reproduce oscillations. It gives a flat mean-level line, and a seasonal (daily) component can be added later if needed.
  • The cause of the 16:13 revert is not identified.
Images attached to this report
Comments to this report:
tatsuki.washimi - 13:36 Wednesday 28 October 2026 (37755) Print this report

1. Prediction Line Continuity Fix

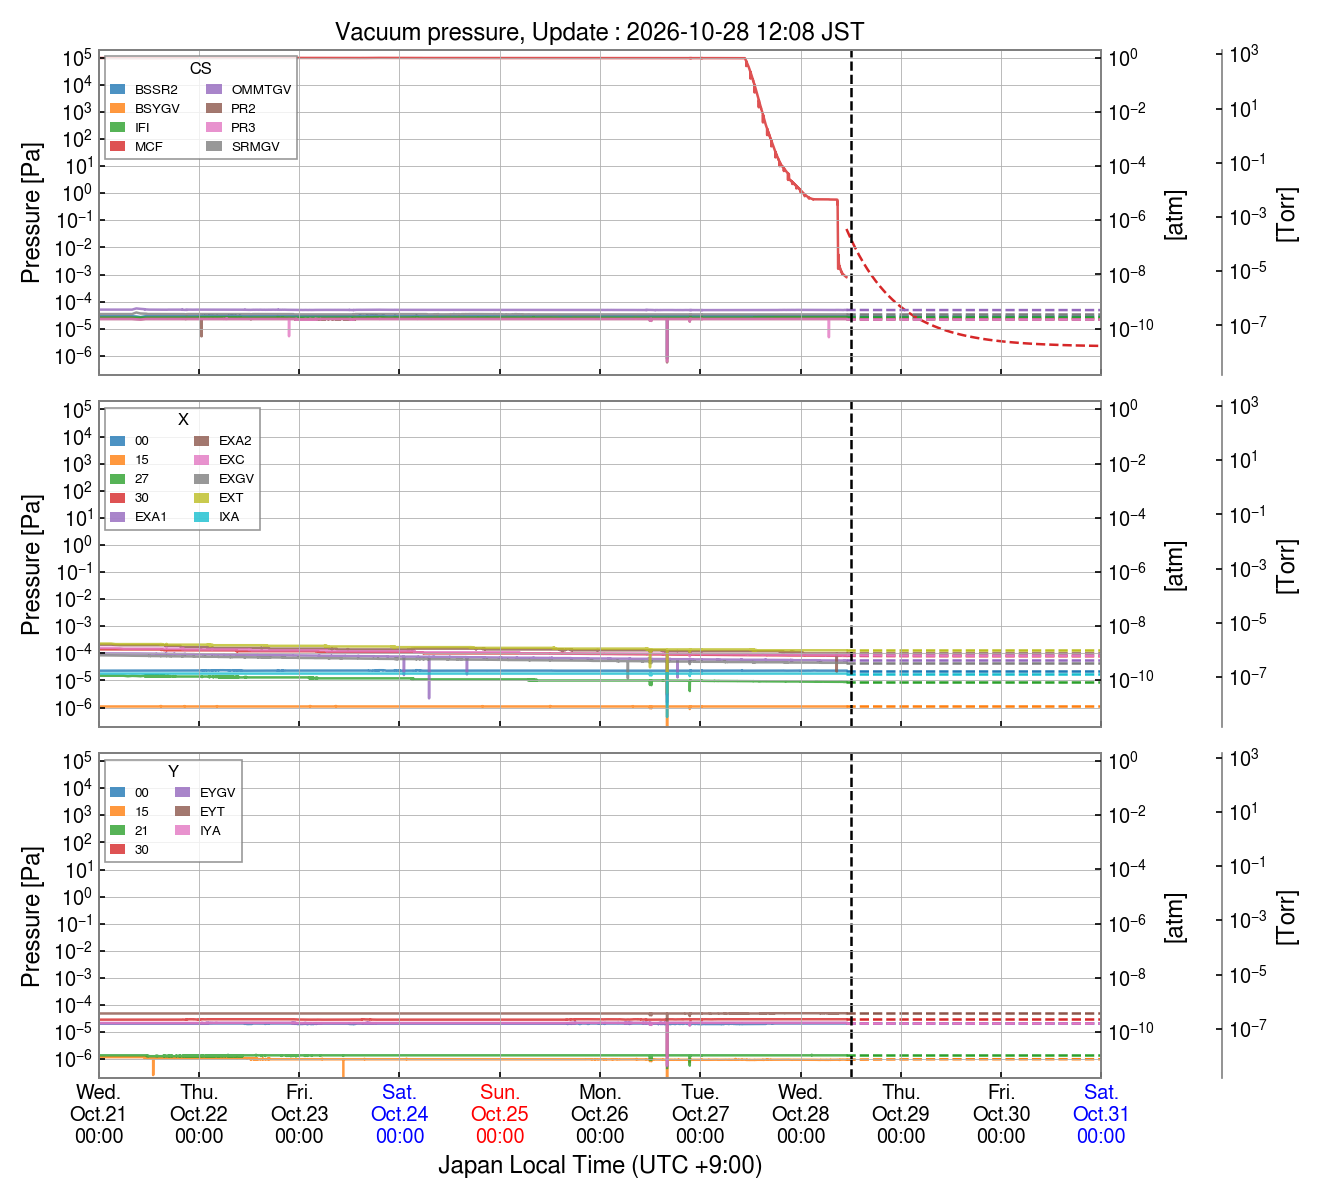
  • Issue: The MCF forecast line (dashed) showed an unphysical 2-order-of-magnitude vertical gap from the measured data (solid) at current time tlastt_{\text{last}}tlast​.
  • Cause: Forecast baseline y0y_0y0​ used the regression intercept (s*0 + icpt) instead of the actual latest observation.
  • Fix: Anchored y0y_0y0​ directly to the latest measured value (y0=log⁡10(Platest)y_0 = \log_{10}(P_{\text{latest}})y0​=log10​(Platest​)), guaranteeing continuous transitions.

2. Adaptive Window for Physical Regime Changes (TMP Turn-On)

  • Issue: MCF had a sudden physical pressure plunge at ~08:50 JST when the turbo molecular pump (TMP) was started. A fixed 6-hour window included the pre-TMP roughing plateau and transition plunge, overestimating the pump-down slope (s=−0.58 dec/hs = -0.58\text{ dec/h}s=−0.58 dec/h vs. actual −0.15 dec/h-0.15\text{ dec/h}−0.15 dec/h).
  • Fix: Implemented backward adaptive scanning from tlastt_{\text{last}}tlast​ using a normalized rate metric relative to 10−7 Pa10^{-7}\text{ Pa}10−7 Pa base vacuum: Metric=∣Δlog⁡10PΔt∣log⁡10(P/10−7 Pa)\text{Metric} = \frac{\left|\frac{\Delta \log_{10} P}{\Delta t}\right|}{\log_{10}(P / 10^{-7}\text{ Pa})}Metric=log10​(P/10−7 Pa)​ΔtΔlog10​P​​​
    • Avoids any singularity at P=1 PaP = 1\text{ Pa}P=1 Pa (log⁡101=0\log_{10} 1 = 0log10​1=0) while scaling appropriately across both atmospheric and ultra-high vacuum ranges.
    • Automatically isolates the post-TMP smooth regime (09:00 onwards, ~4 hours), yielding accurate physical slopes while retaining the full 6-hour window for steady channels.

3. Filtering of Non-Physical Communication Spikes (Glitch Rejection)

  • Issue: Isolated 1-minute downward spikes (e.g. simultaneous drop by a factor of 40 across all channels at 2026-10-26 16:02 JST due to EPICS/NDS2 buffer packet dropouts) produced visual needles on plots and risked corrupting the latest observation.
  • Fix: Implemented 5-point rolling log-median outlier rejection (clean_spikes and clean_spikes_tsd) with a 0.5 decade0.5\text{ decade}0.5 decade threshold.
    • Applied immediately before plotting (Plot_TSD, Plot_Trend, Vacuum_summary.png) and forecast calculation, while keeping raw historical records intact in data_VAC.csv.
    • Effectively removed all communication glitch needles across all plots without affecting real physical pump-down curves.

4. Synchronization and Verification

  • Synchronized changes between /users/PEM/SEM/script/plot_VAC.py and /users/PEM/SEM_dev/script/plot_VAC.py.
  • Re-executed the pipeline and verified clean, spike-free plots and continuous prediction curves in /mnt/slowmonitor/VAC/Vacuum_summary.png.
Images attached to this comment
Search Help
×

Warning

×