[Tanaka, Hirose, Saito]
Using the 20 dB RF amplifier and the 40 dB RF amplifier, the beat signal amplitude was increased to 23 dBm. After replacing the phase detector with a Phase Frequency Discriminator (PFD), it was confirmed that the beat signal frequency followed changes in the LO frequency. However, the error signal appeared to oscillate at approximately 260 kHz. This oscillation may be caused by a resonance of the sub-laser PZT.
-
First, the alignment was adjusted to maximize the beat signal. The signal level under various RF amplifier configurations was as follows:
No RF amplifier: -51 dBm
40 dB RF amplifier only: -5 dBm
20 dB RF amplifier only: -20 dBm
40 dB RF amplifier followed by the 20 dB RF amplifier: 8 dBm
20 dB RF amplifier followed by the 40 dB RF amplifier: 23 dBm
-
Therefore, lock acquisition was attempted using the phase detector with the 20 dB RF amplifier followed by the 40 dB RF amplifier. A 1 MHz low-pass filter was applied in the SR560 used for feedback to the sub-laser PZT, while a flat filter was implemented in Moku:Lab. Various gains and integrator settings were tested. However, no behavior indicating that the beat frequency was being pulled toward the LO frequency was observed.
-
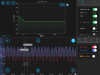
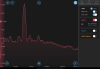
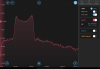
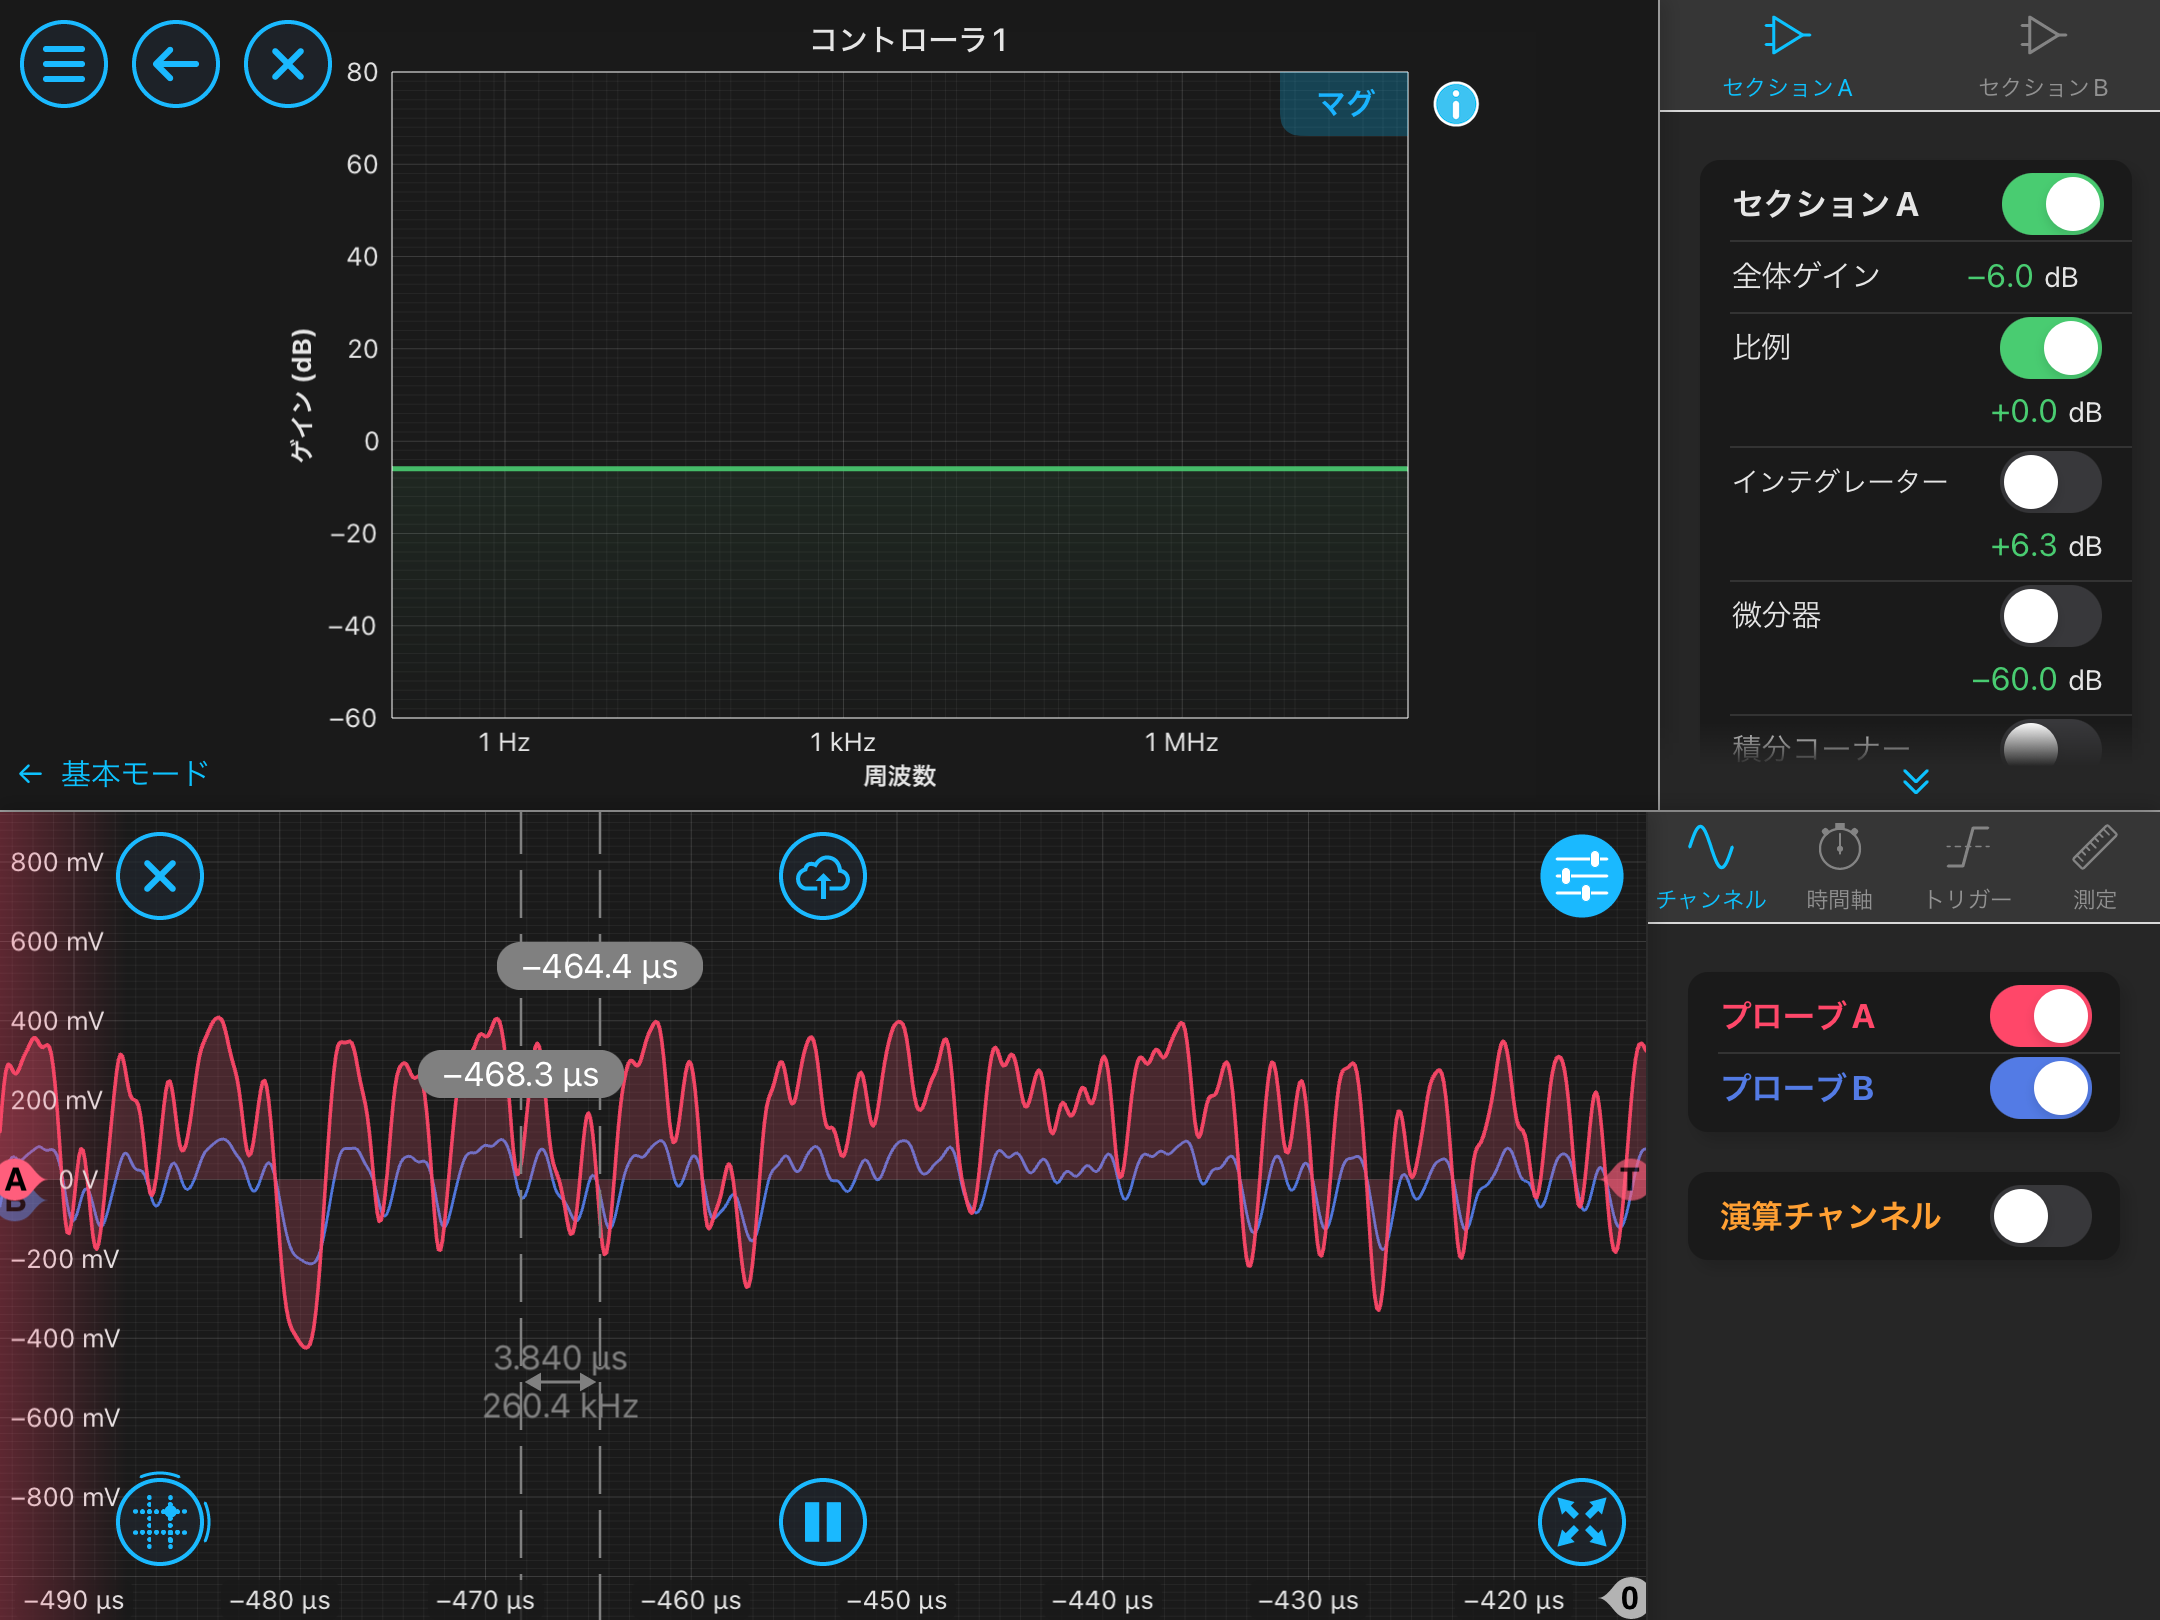
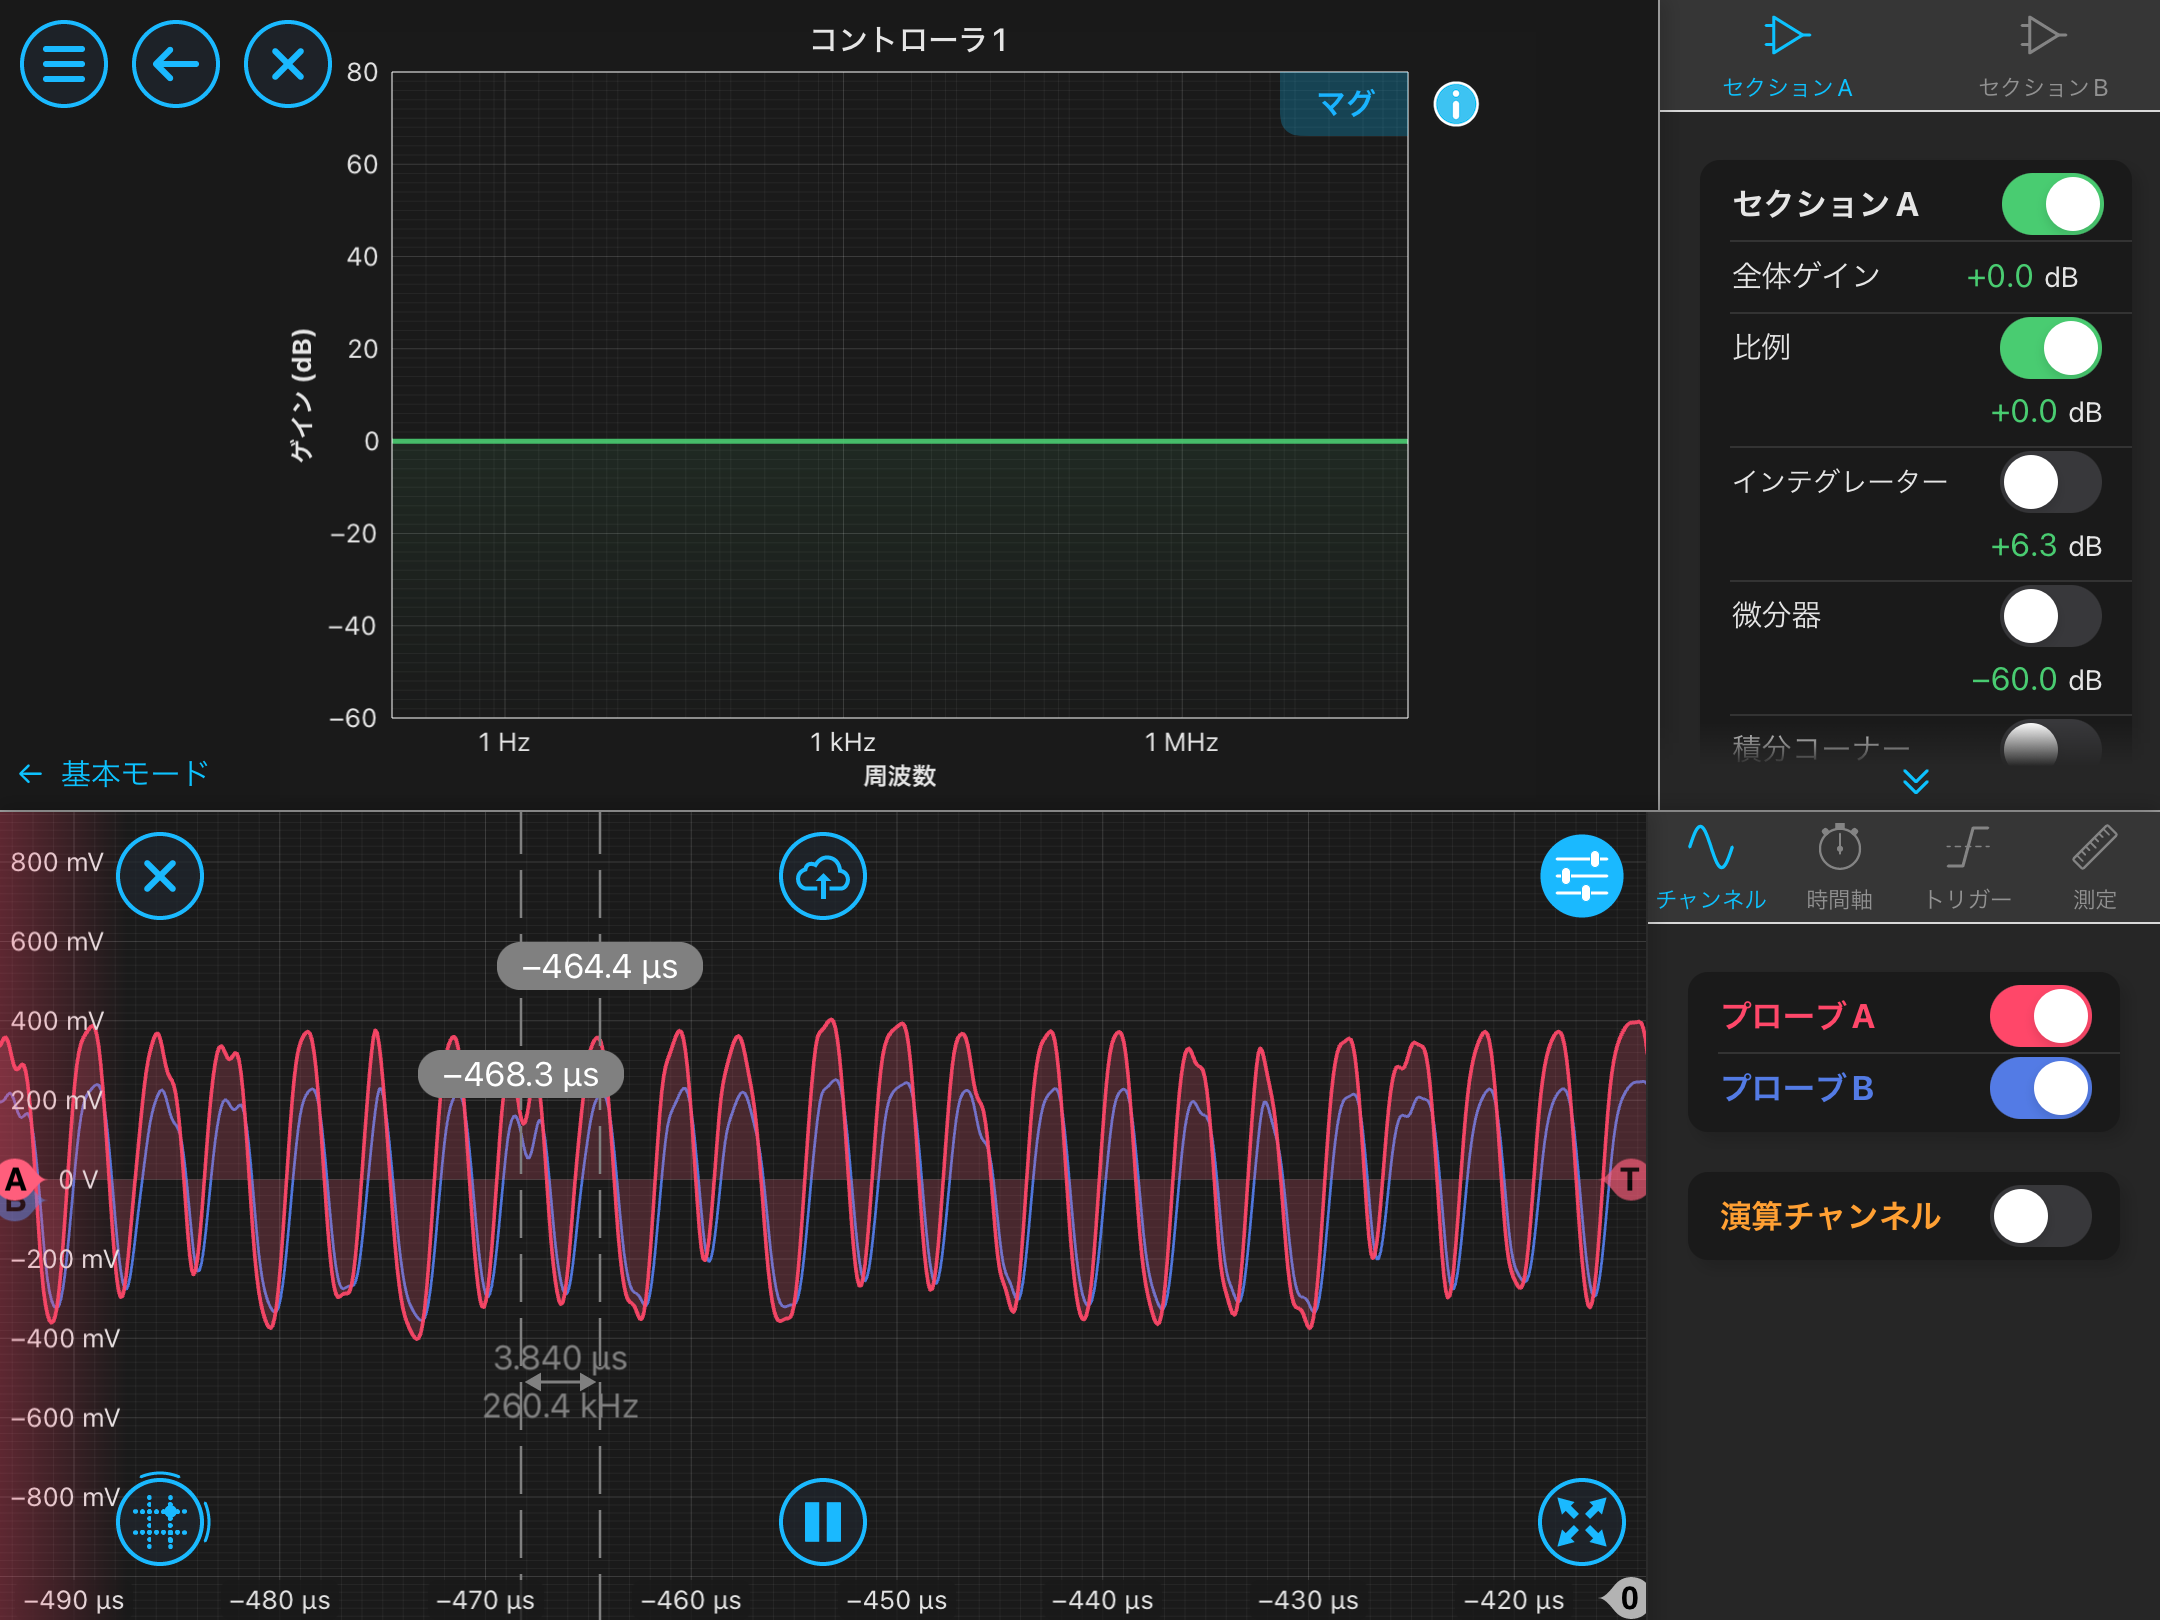
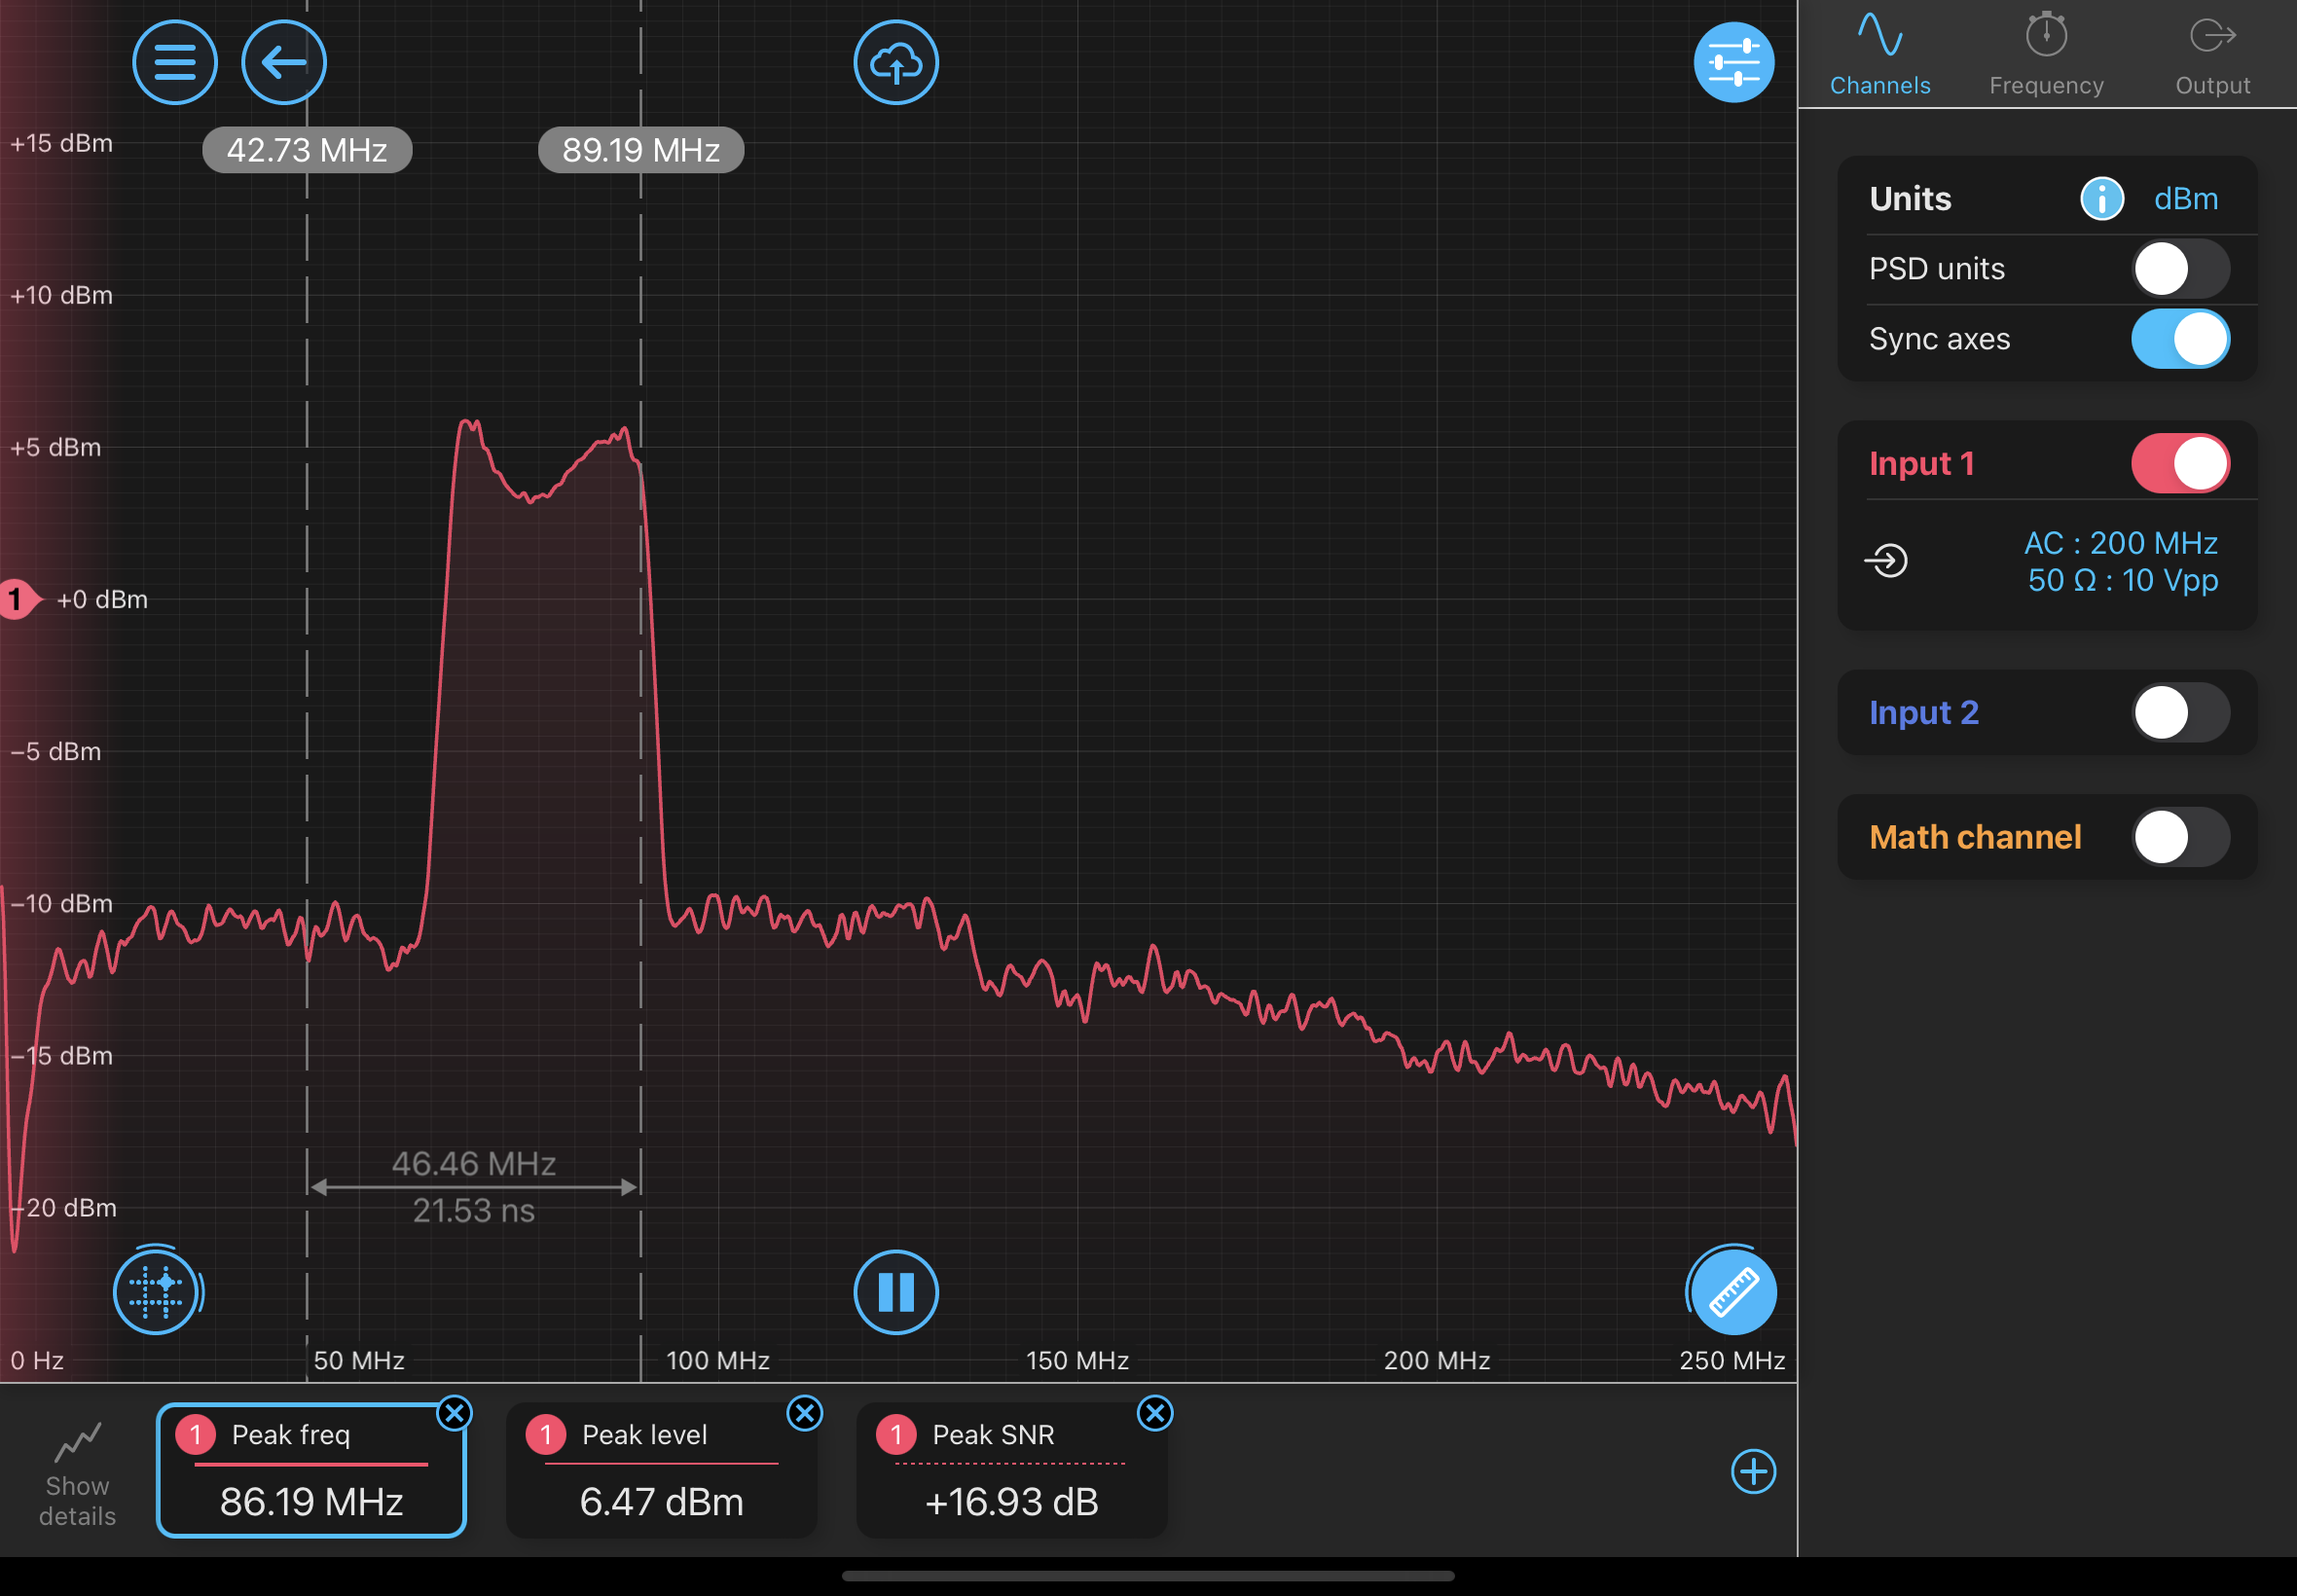
Next, the phase detector was replaced with a PFD. With a filter consisting of an overall gain of -6 dB and an integrator providing 6 dB of gain at 1 Hz (Photo 1), it was observed that the beat signal frequency followed changes in the LO frequency. In the lower plot of Photo 1, the red trace represents the error signal and the blue trace represents the feedback signal. Since the feedback signal changed when the LO frequency was varied, the LO frequency and beat signal frequency were measured for feedback signal levels of approximately 0 V and ±1 V. The beat signal spectrum exhibited a shape with a dip at the center and peaks on both sides (Photo 2). Therefore, the frequencies of the two peaks were measured, and their average was taken as the beat signal frequency. In Photo 2, the light red trace corresponds to a feedback signal of approximately +1 V, while the red trace corresponds to a feedback signal of approximately -1 V.
The results are summarized below:
Feedback Signal LO Frequency Beat Signal Frequency
Approximately -1 V 85.066 MHz 85.16 MHz
Approximately 0 V 88.066 MHz 87.99 MHz
Approximately +1 V 89.666 MHz 89.74 MHz
-
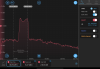
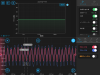
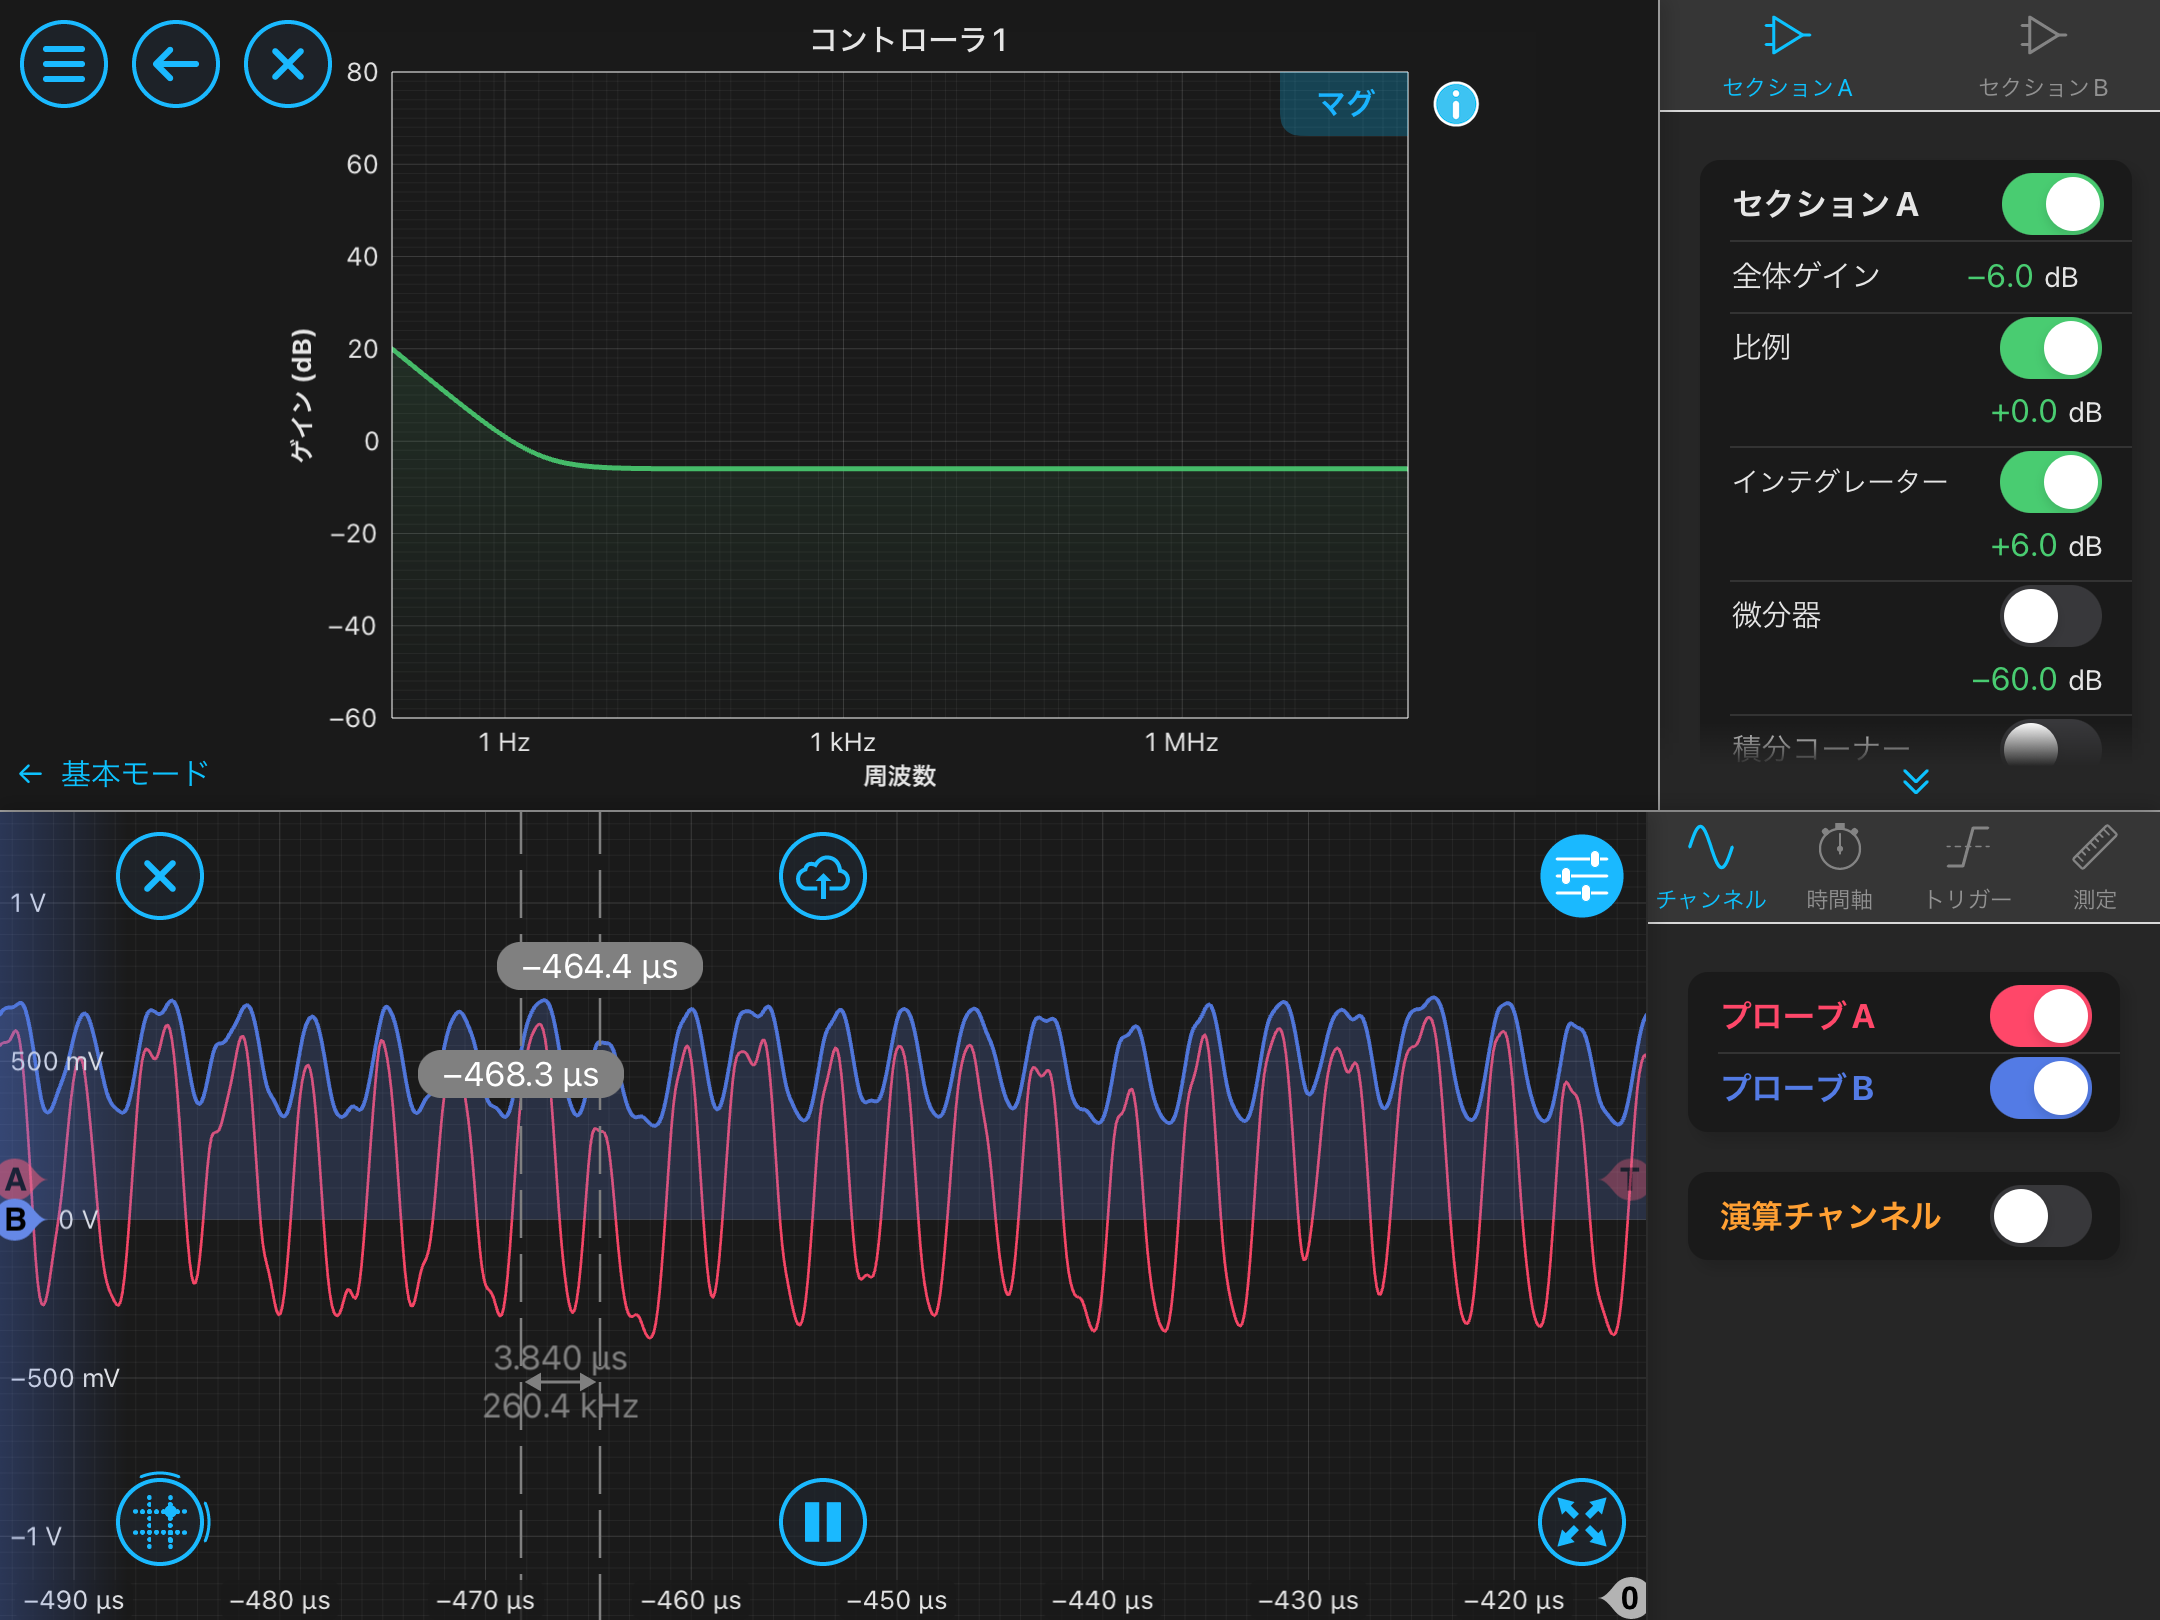
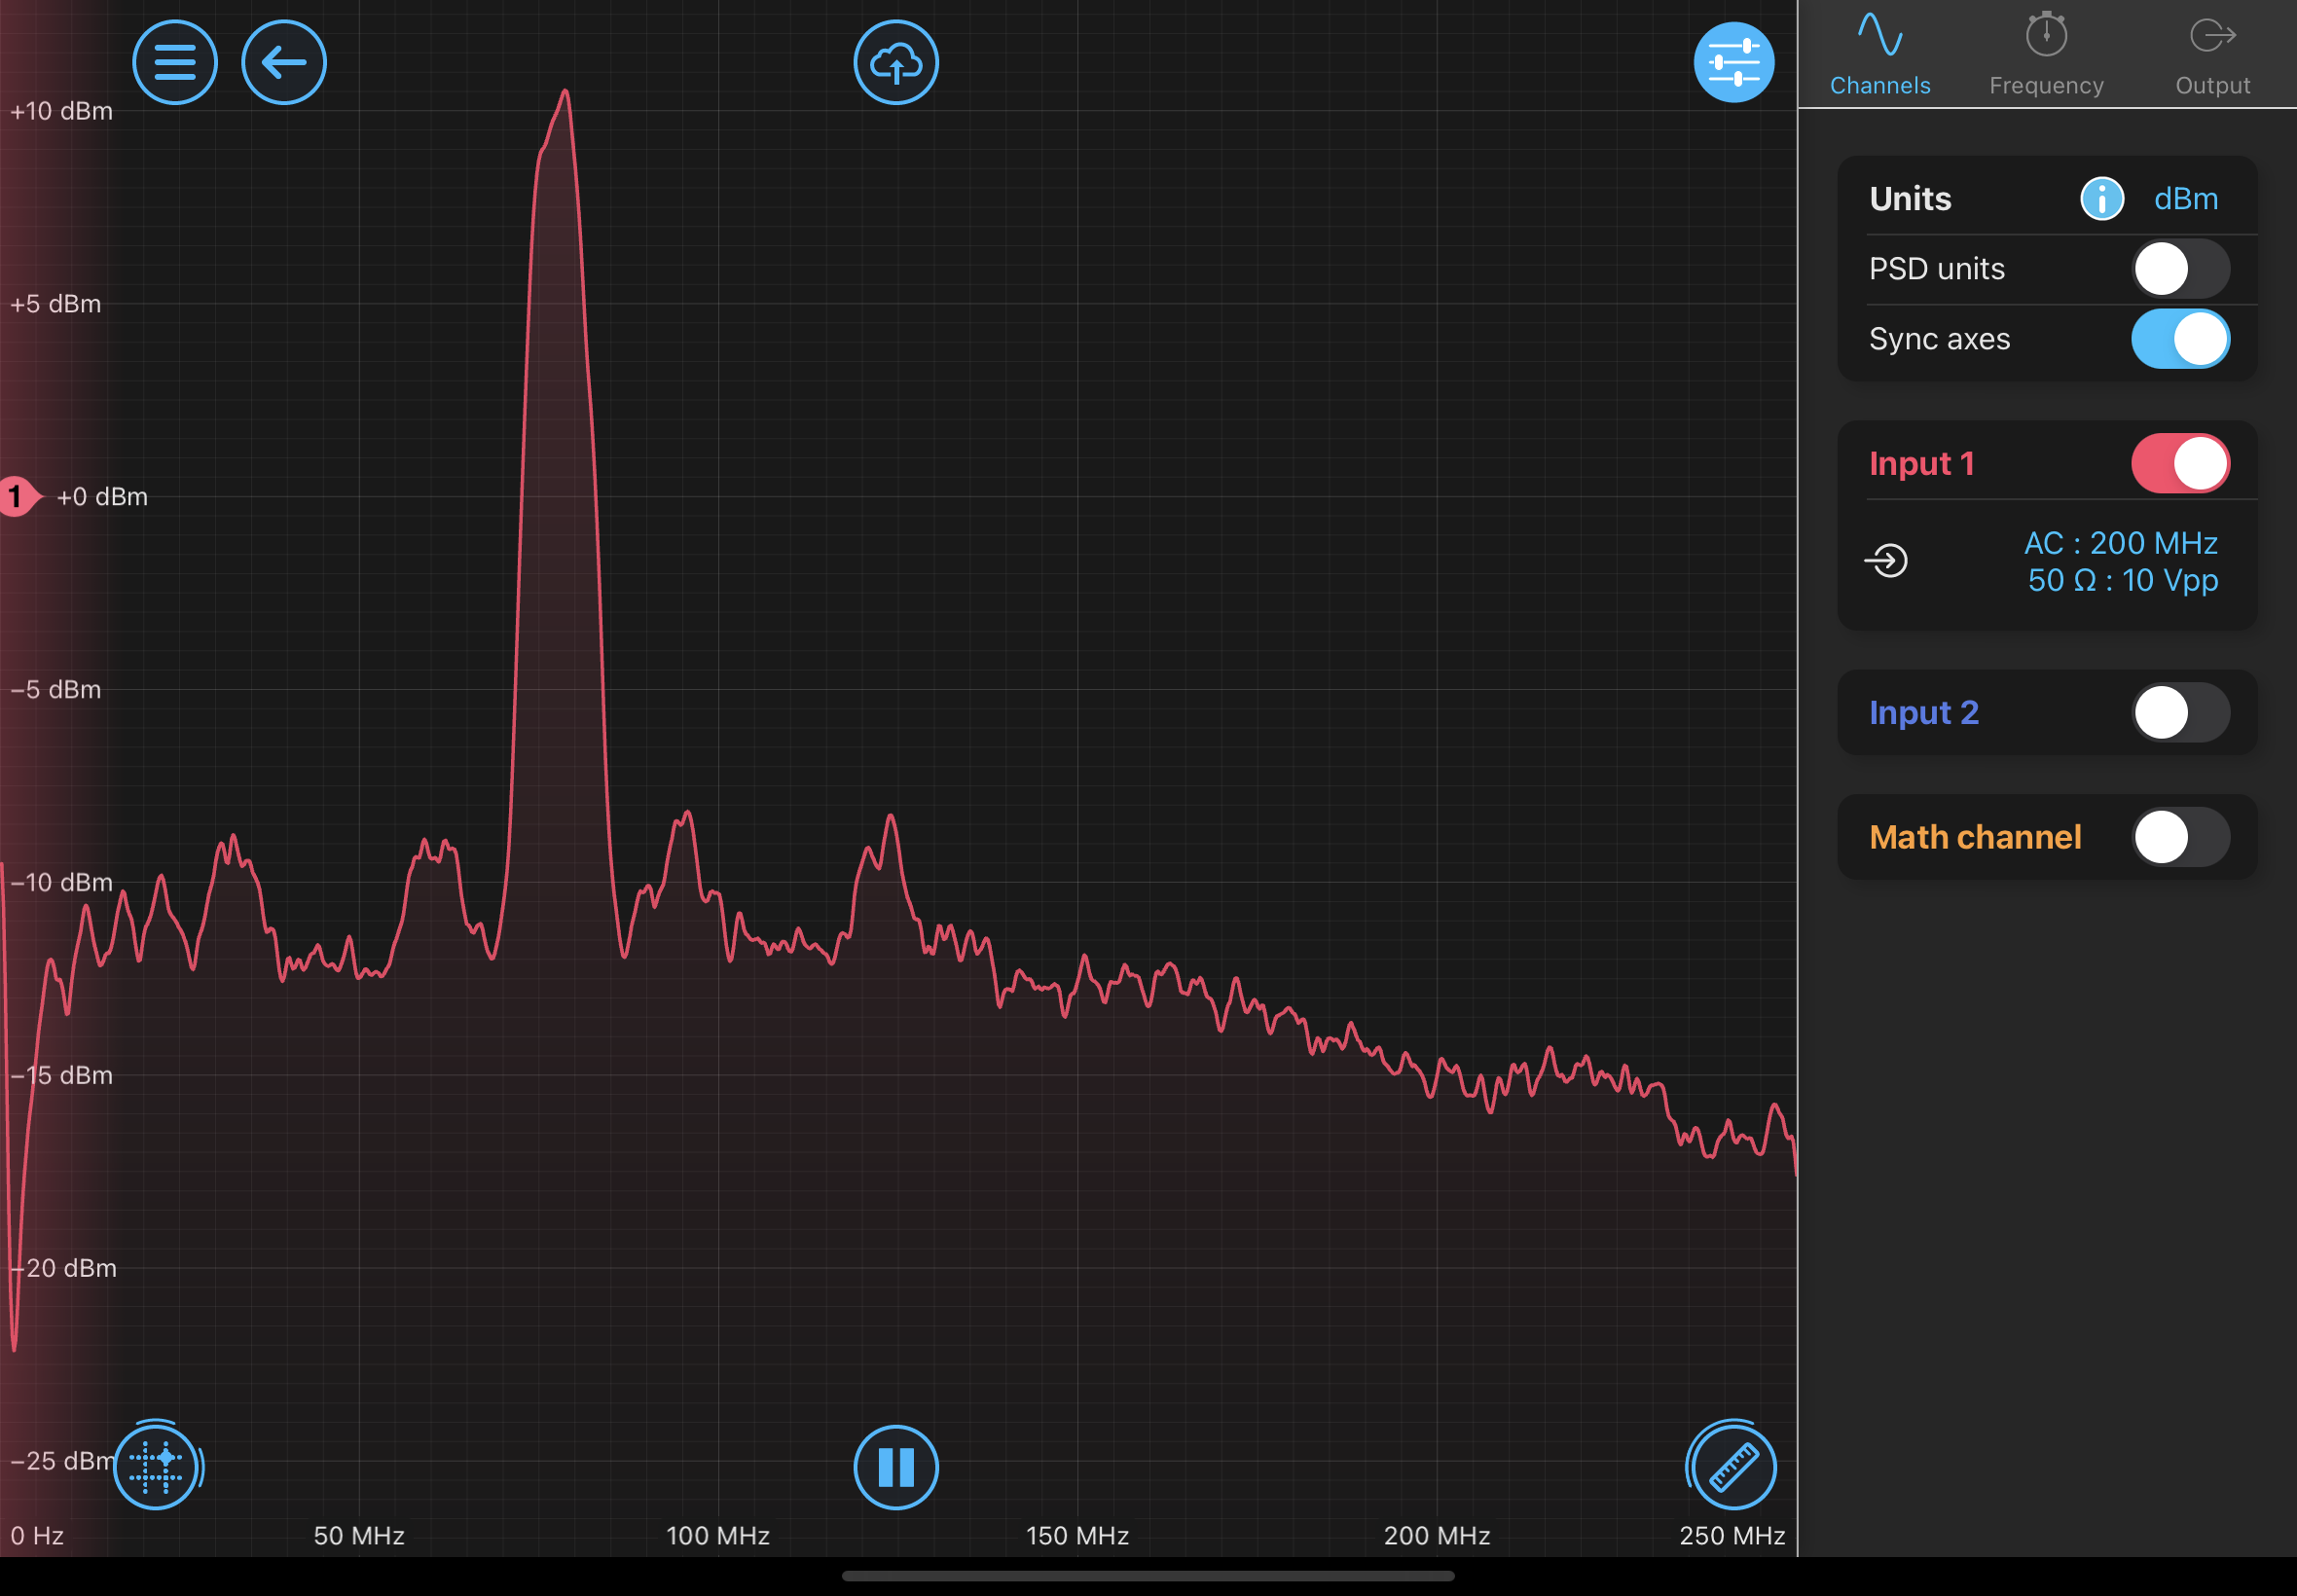
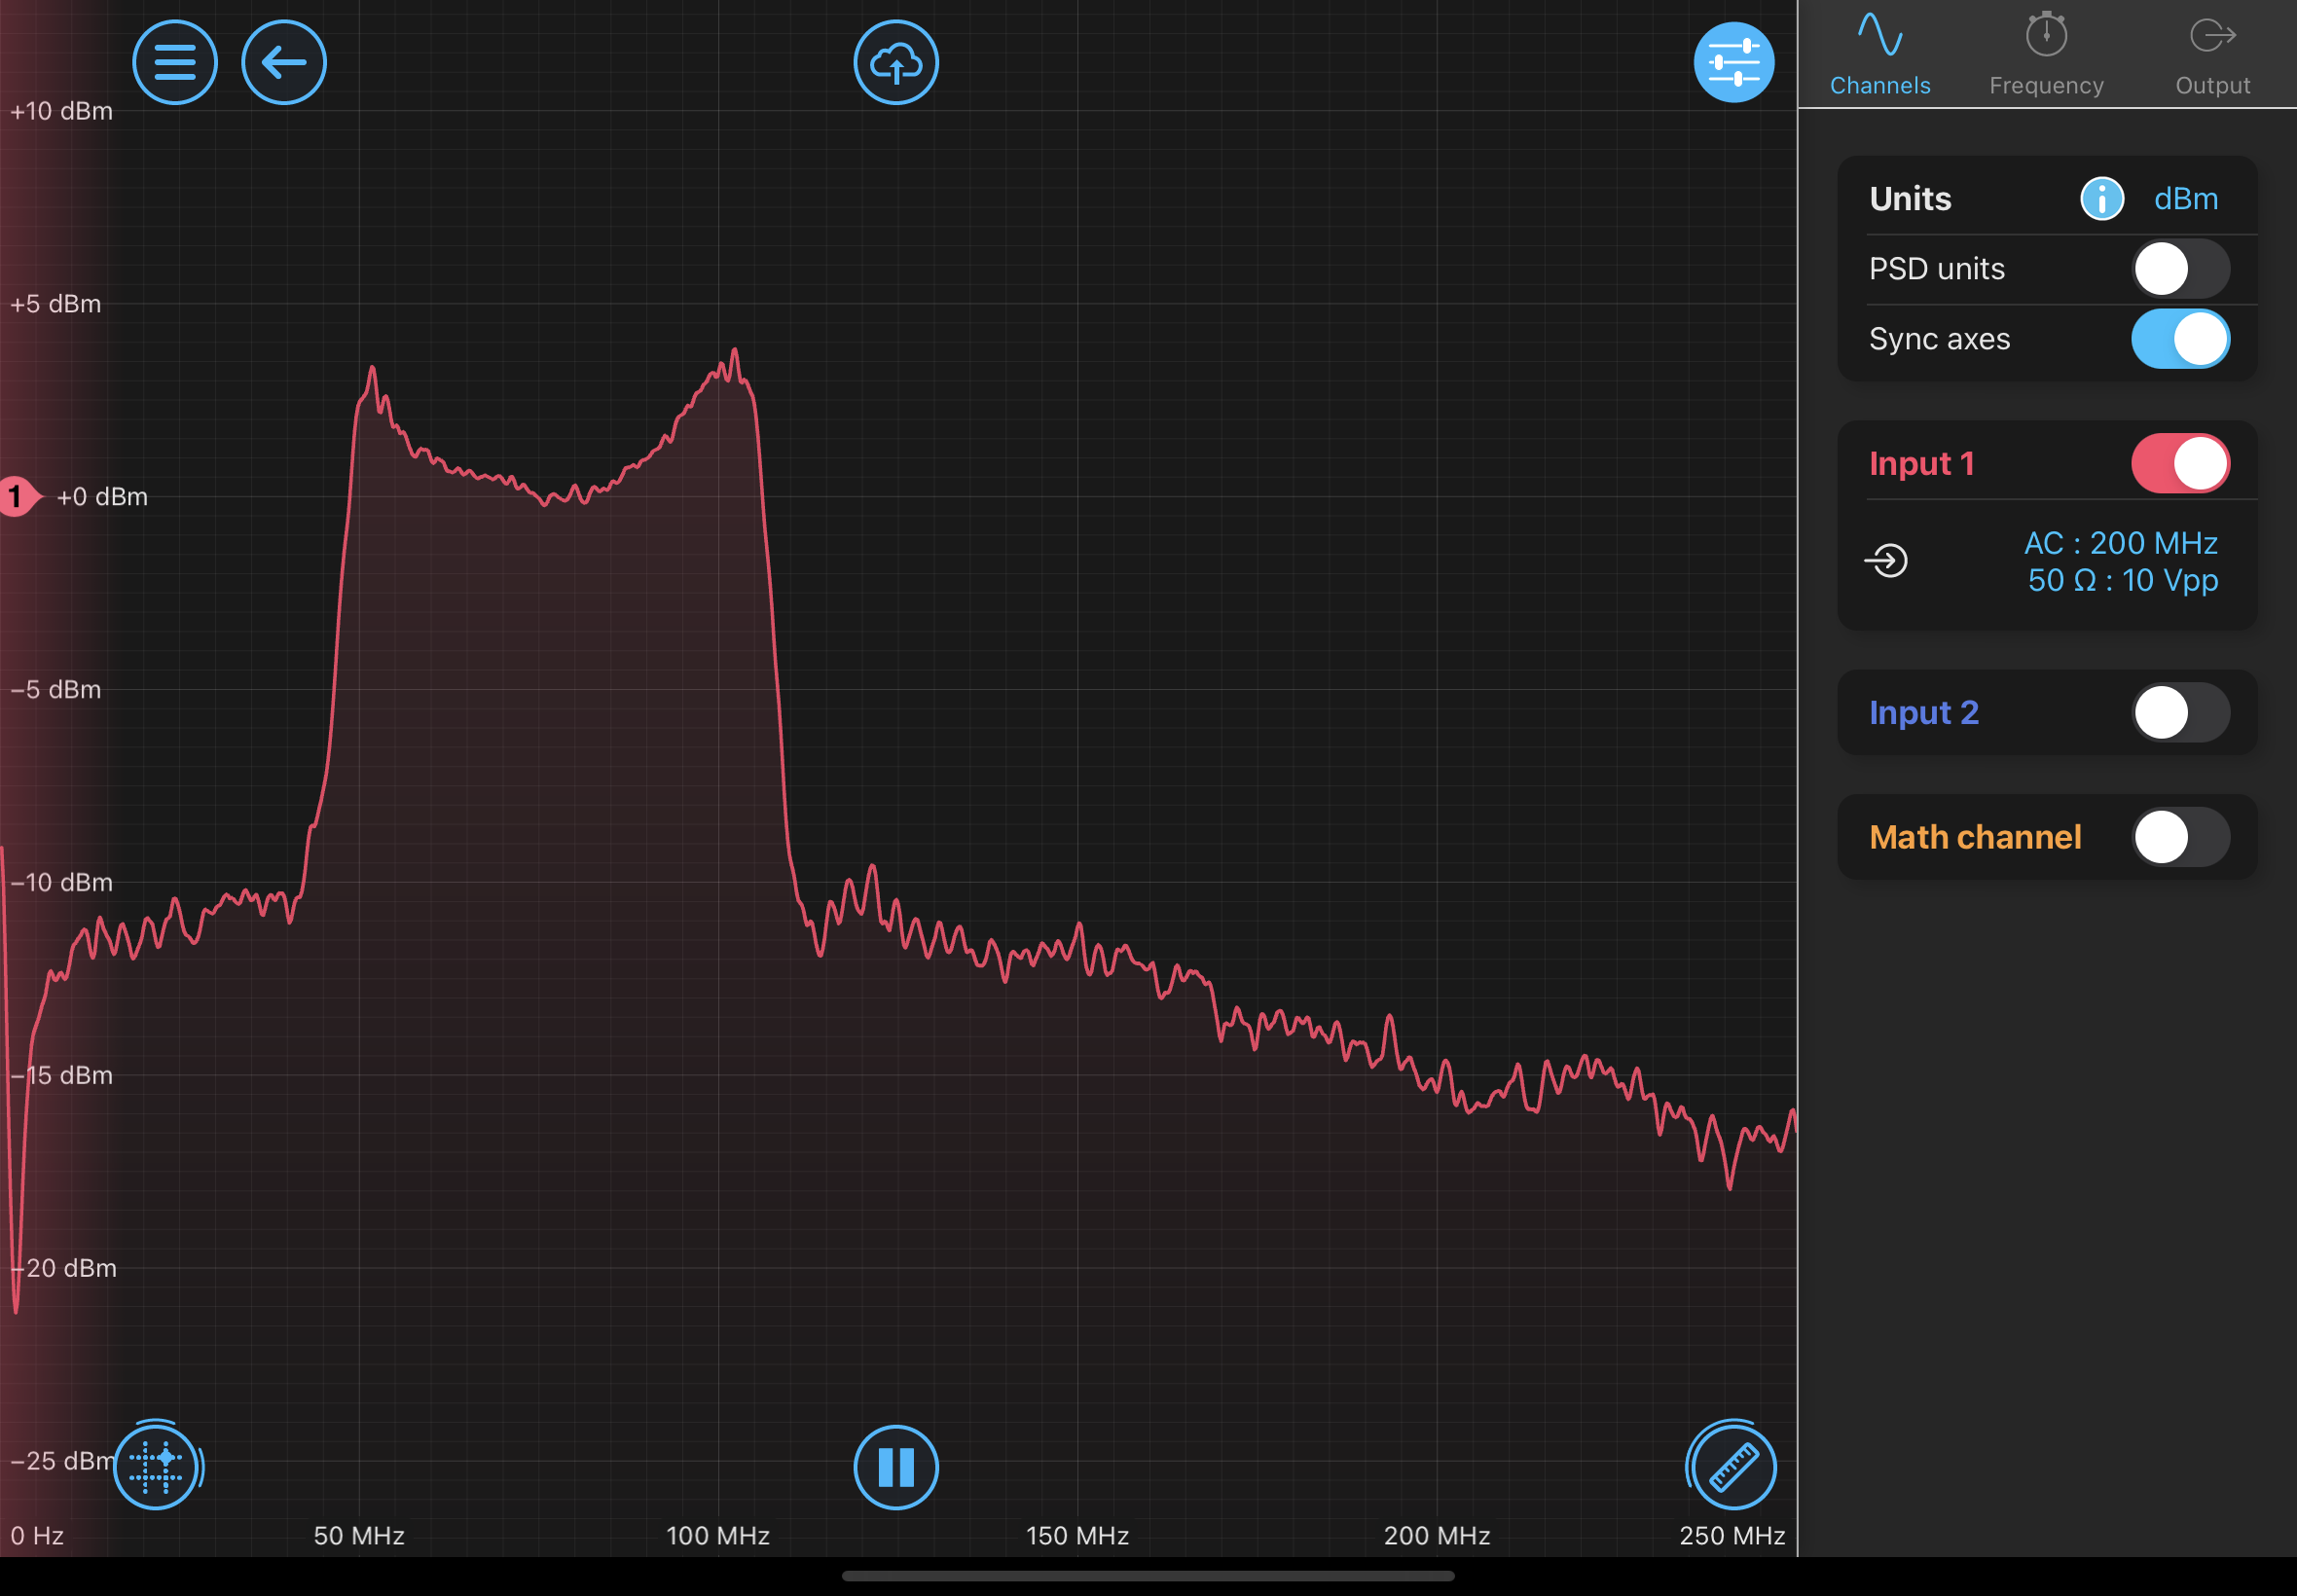
In addition, when using a flat filter and gradually increasing the gain, the error signal began oscillating at approximately 260 kHz, and the width of the beat signal increased. This oscillation may have been caused by a resonance of the sub-laser PZT. The corresponding error signals and beat signals are shown below:
Flat filter with a gain of -6 dB (Photo 3), corresponding beat signal (Photo 4)
Flat filter with a gain of 0 dB (Photo 5), corresponding beat signal (Photo 6)
Flat filter with a gain of +6 dB (Photo 7), corresponding beat signal (Photo 8)


