Silent run - 5:12
1. Shake injection to TMSX table EXC2
11/27 05:42:00 - 06:17:00 (JST)
EXC : K1:PEM-EXCITATION_EX0_RACK_2_EXC
REF : K1:PEM-ACC_TMSX_TABLE_TMS_Z_OUT_DQ
info : TMSX EXC2 50 - 900 Hz 171 point 5 Hz resolution 50cnt excitation
2. Shake injection to TMSX table EXC3
11/27 06:17:00 - 06:52:00 (JST)
EXC : K1:PEM-EXCITATION_EX0_RACK_3_EXC
REF : K1:PEM-PORTABLE_EXC_RACK_EX0_ADC0_DSUB26_OUT_DQ
info : TMSX EXC3 50 - 900 Hz 171 point 5 Hz resolution 50cnt excitation
3. Shake injection to TMSX table EXC4
11/27 06:52:00 - 07:27:00 (JST)
EXC : K1:PEM-EXCITATION_EX0_RACK_4_EXC
REF : K1:PEM-PORTABLE_EXC_RACK_EX0_ADC0_DSUB27_OUT_DQ
info : TMSX EXC4 50 - 900 Hz 171 point 5 Hz resolution 100cnt excitation
Silent run 7:27 - 7:47
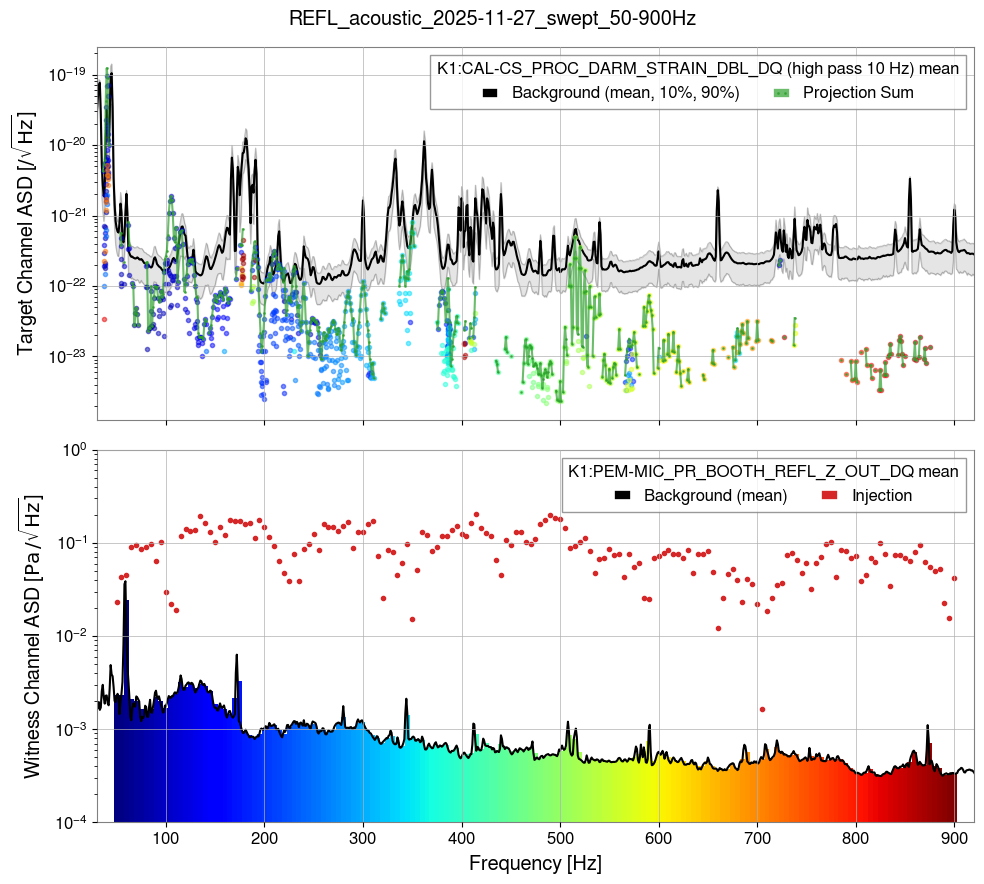
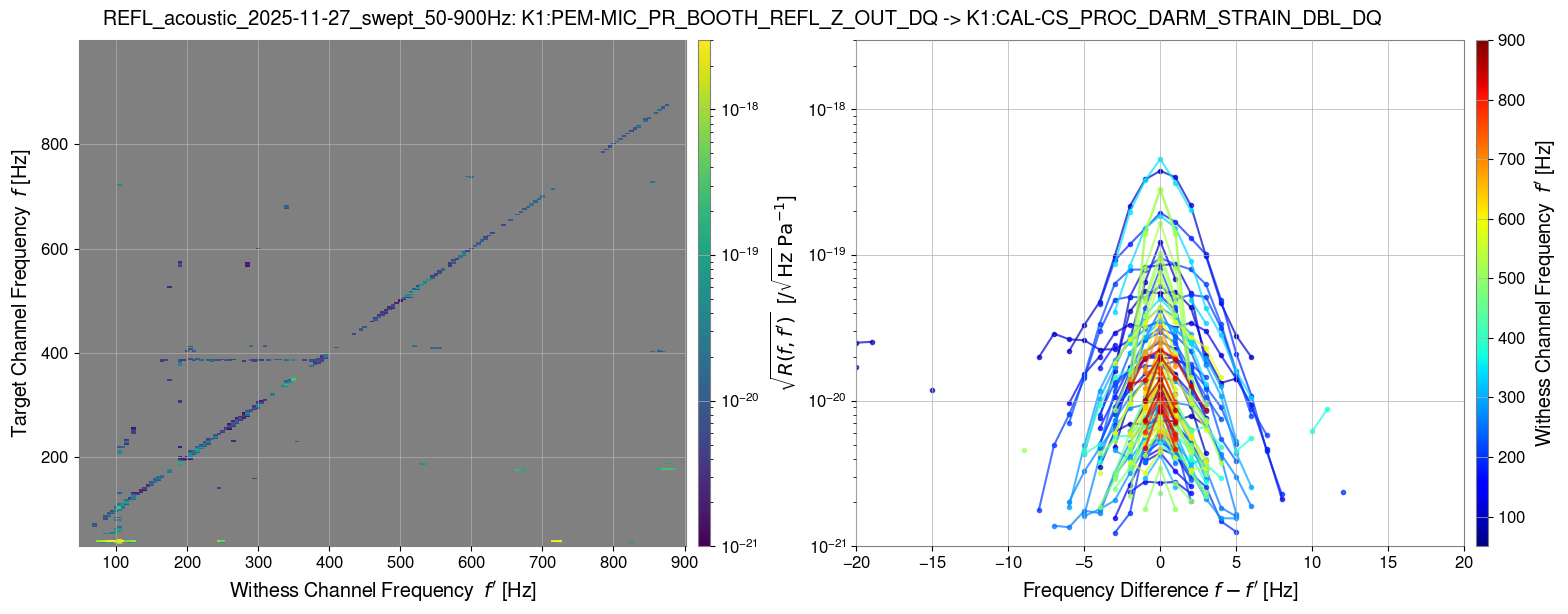
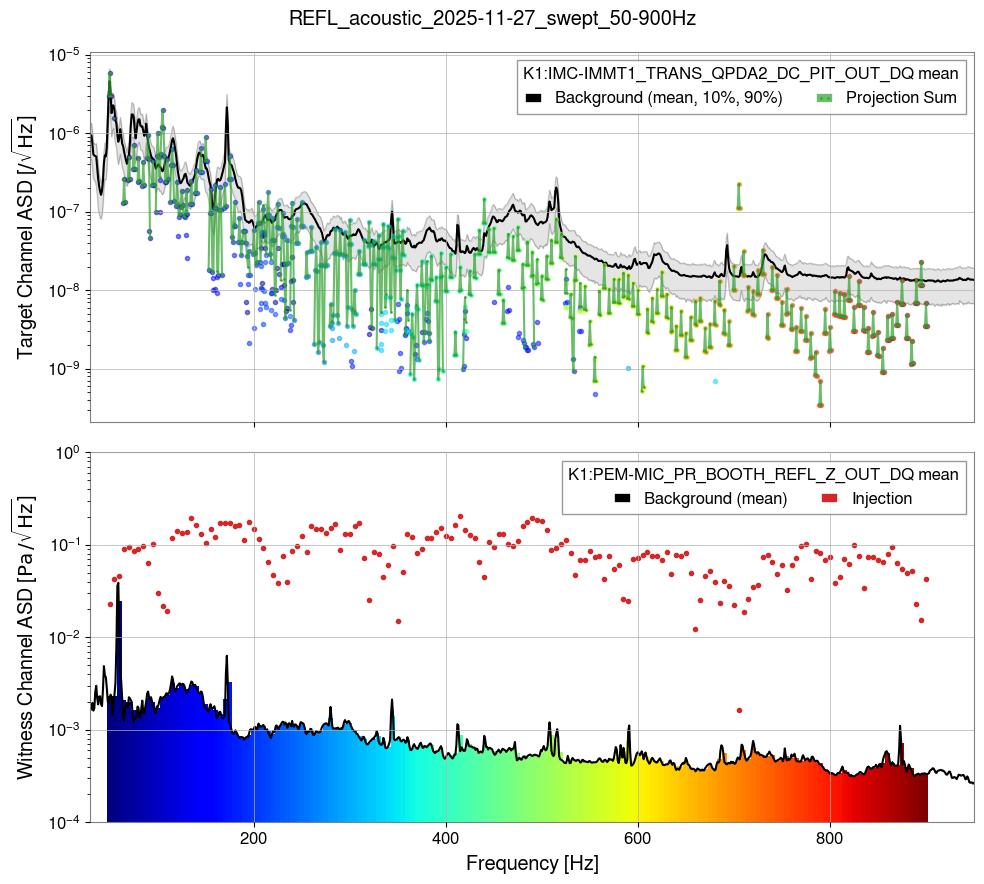
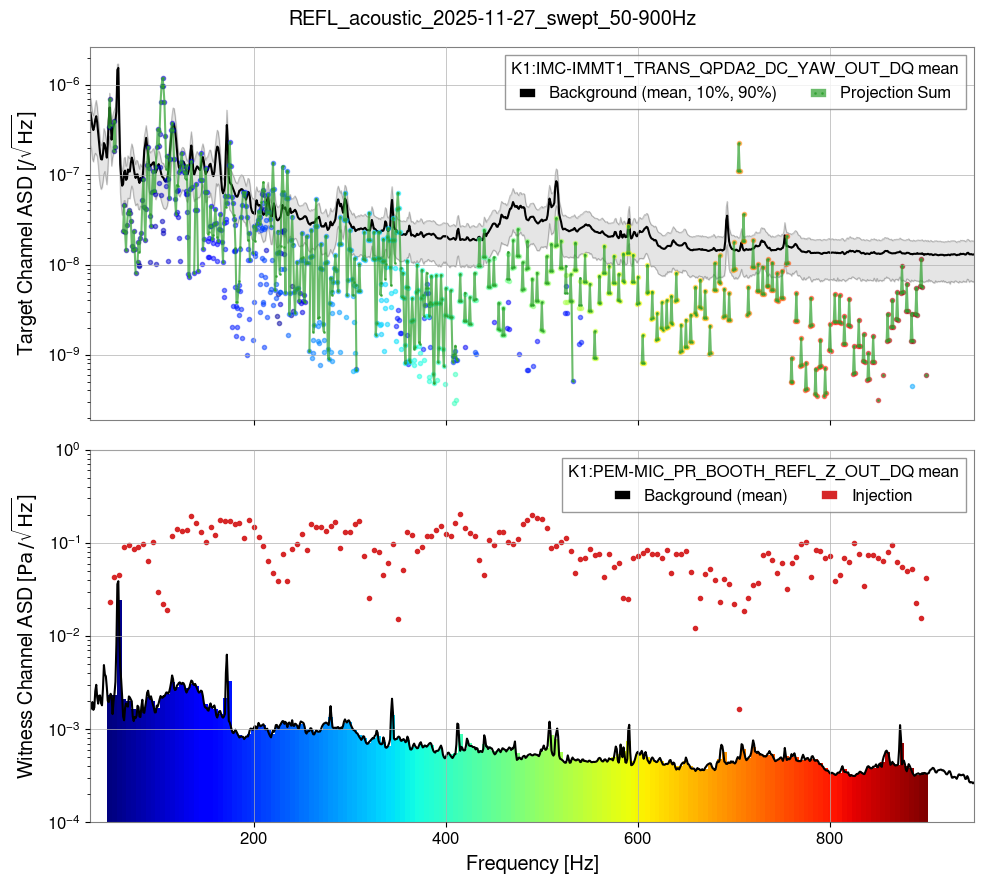
4. Acoustic injection to REFL
11/27 07:47:00 - 08:22:00 (JST)
EXC : K1:PEM-EXCITATION_MCF0_RACK_14_EXC
REF : K1:PEM-MIC_PR_BOOTH_REFL_Z_OUT_DQ
Info : REFL 50 - 900 Hz 171 point 5 Hz resolution 100 cnt excitation
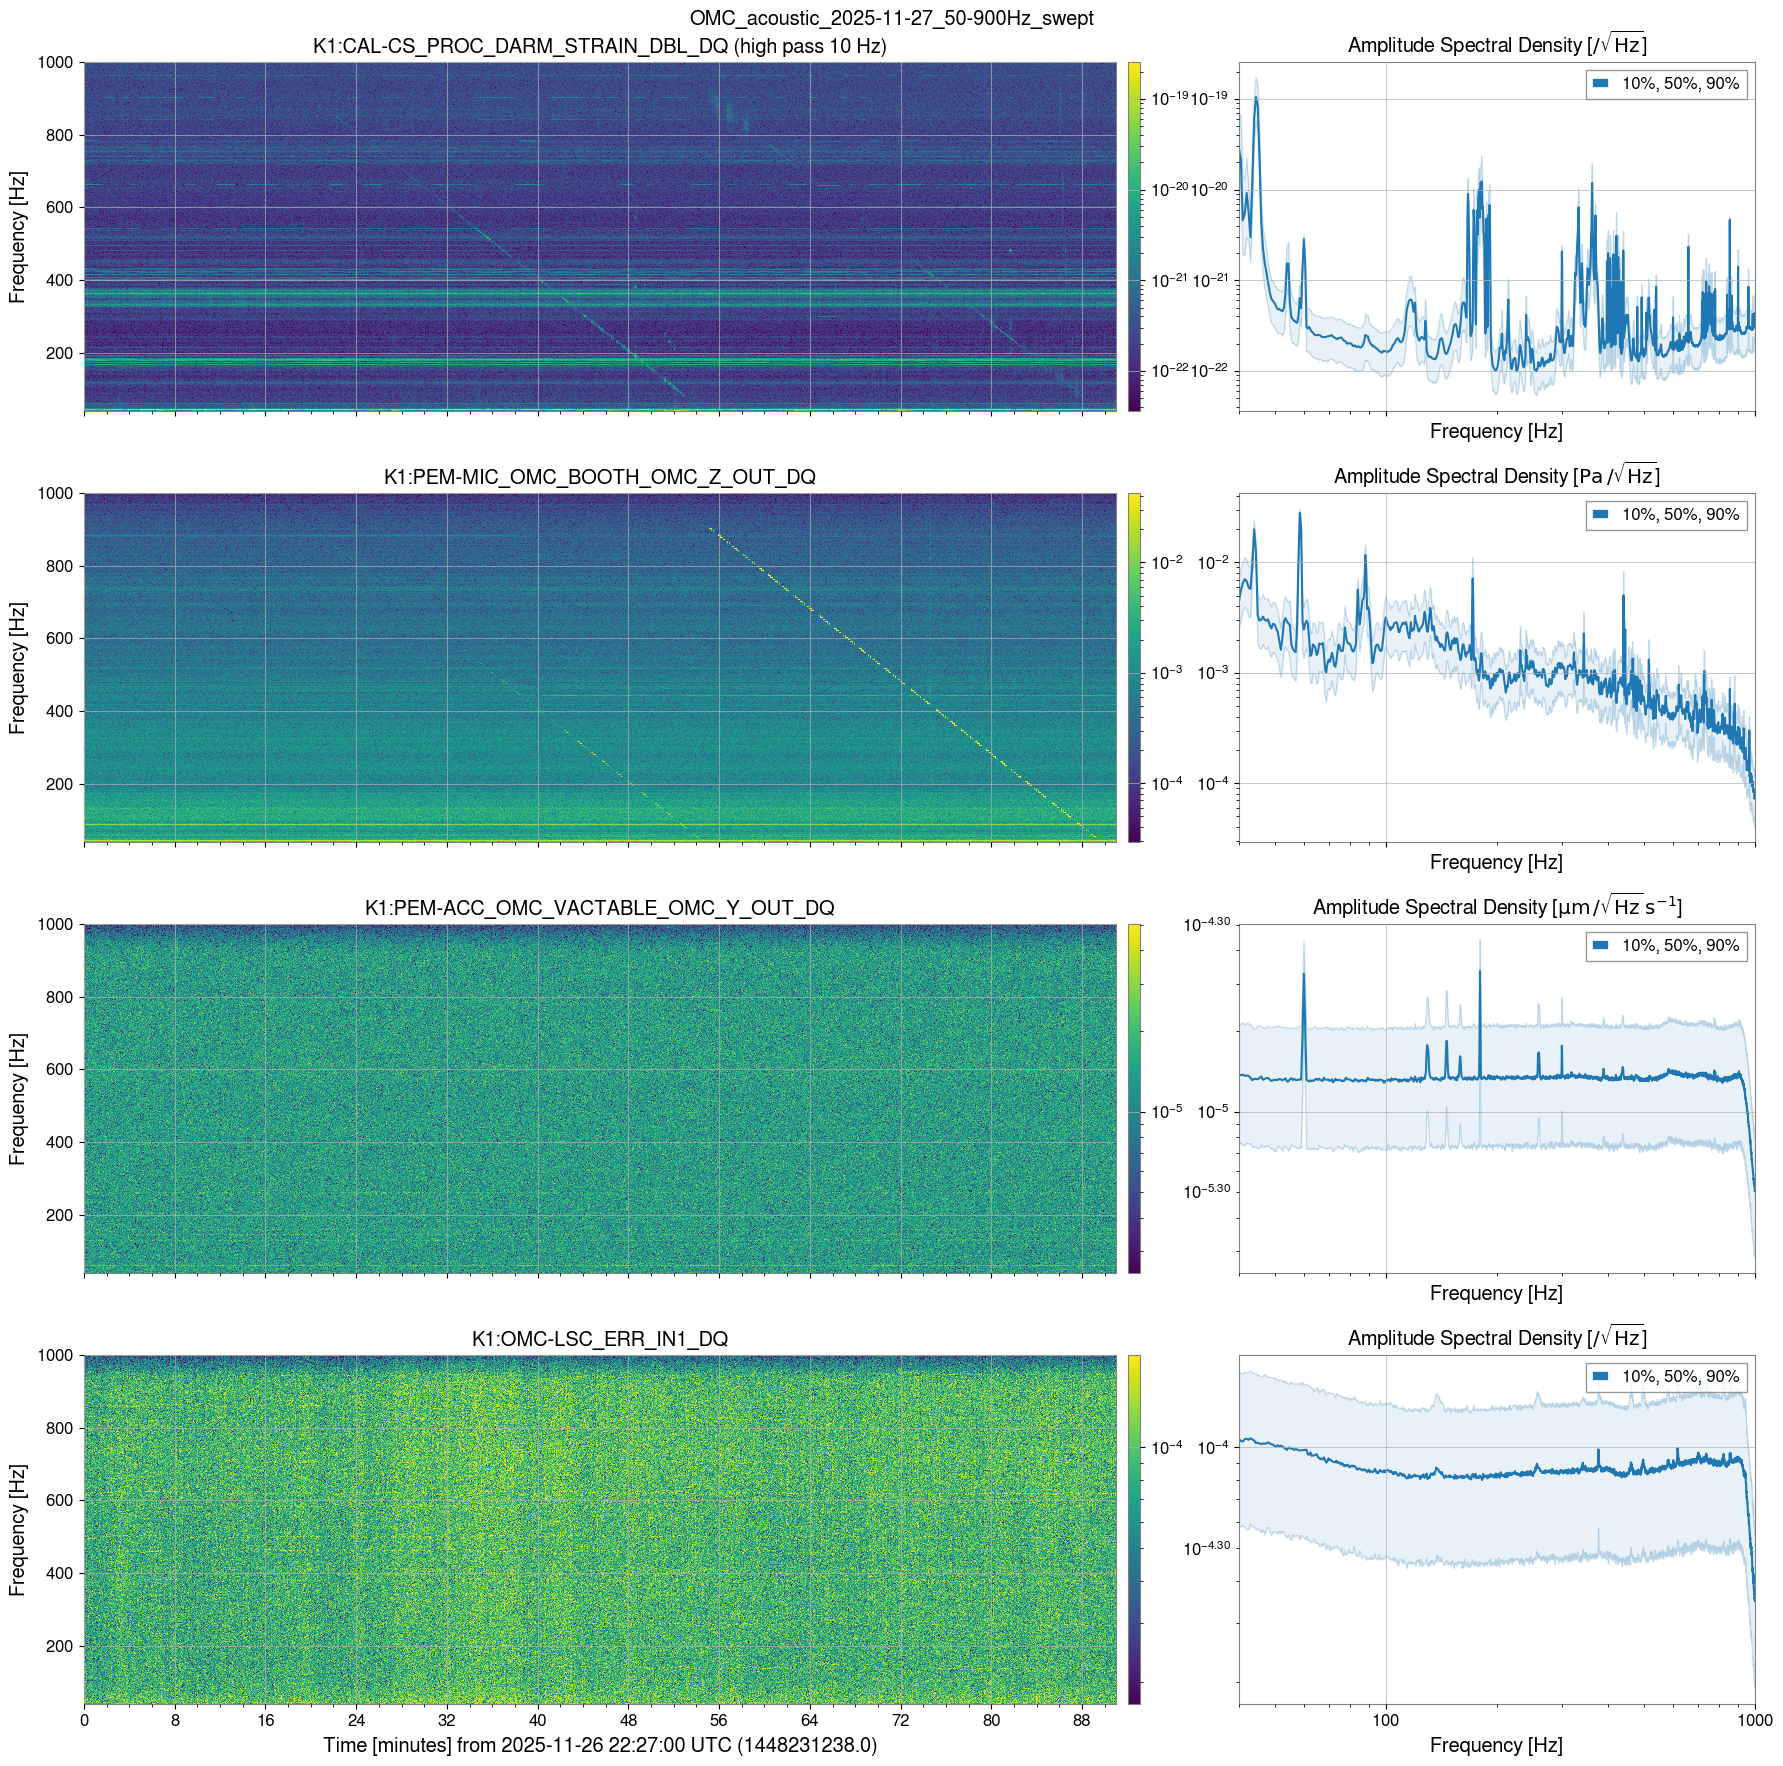
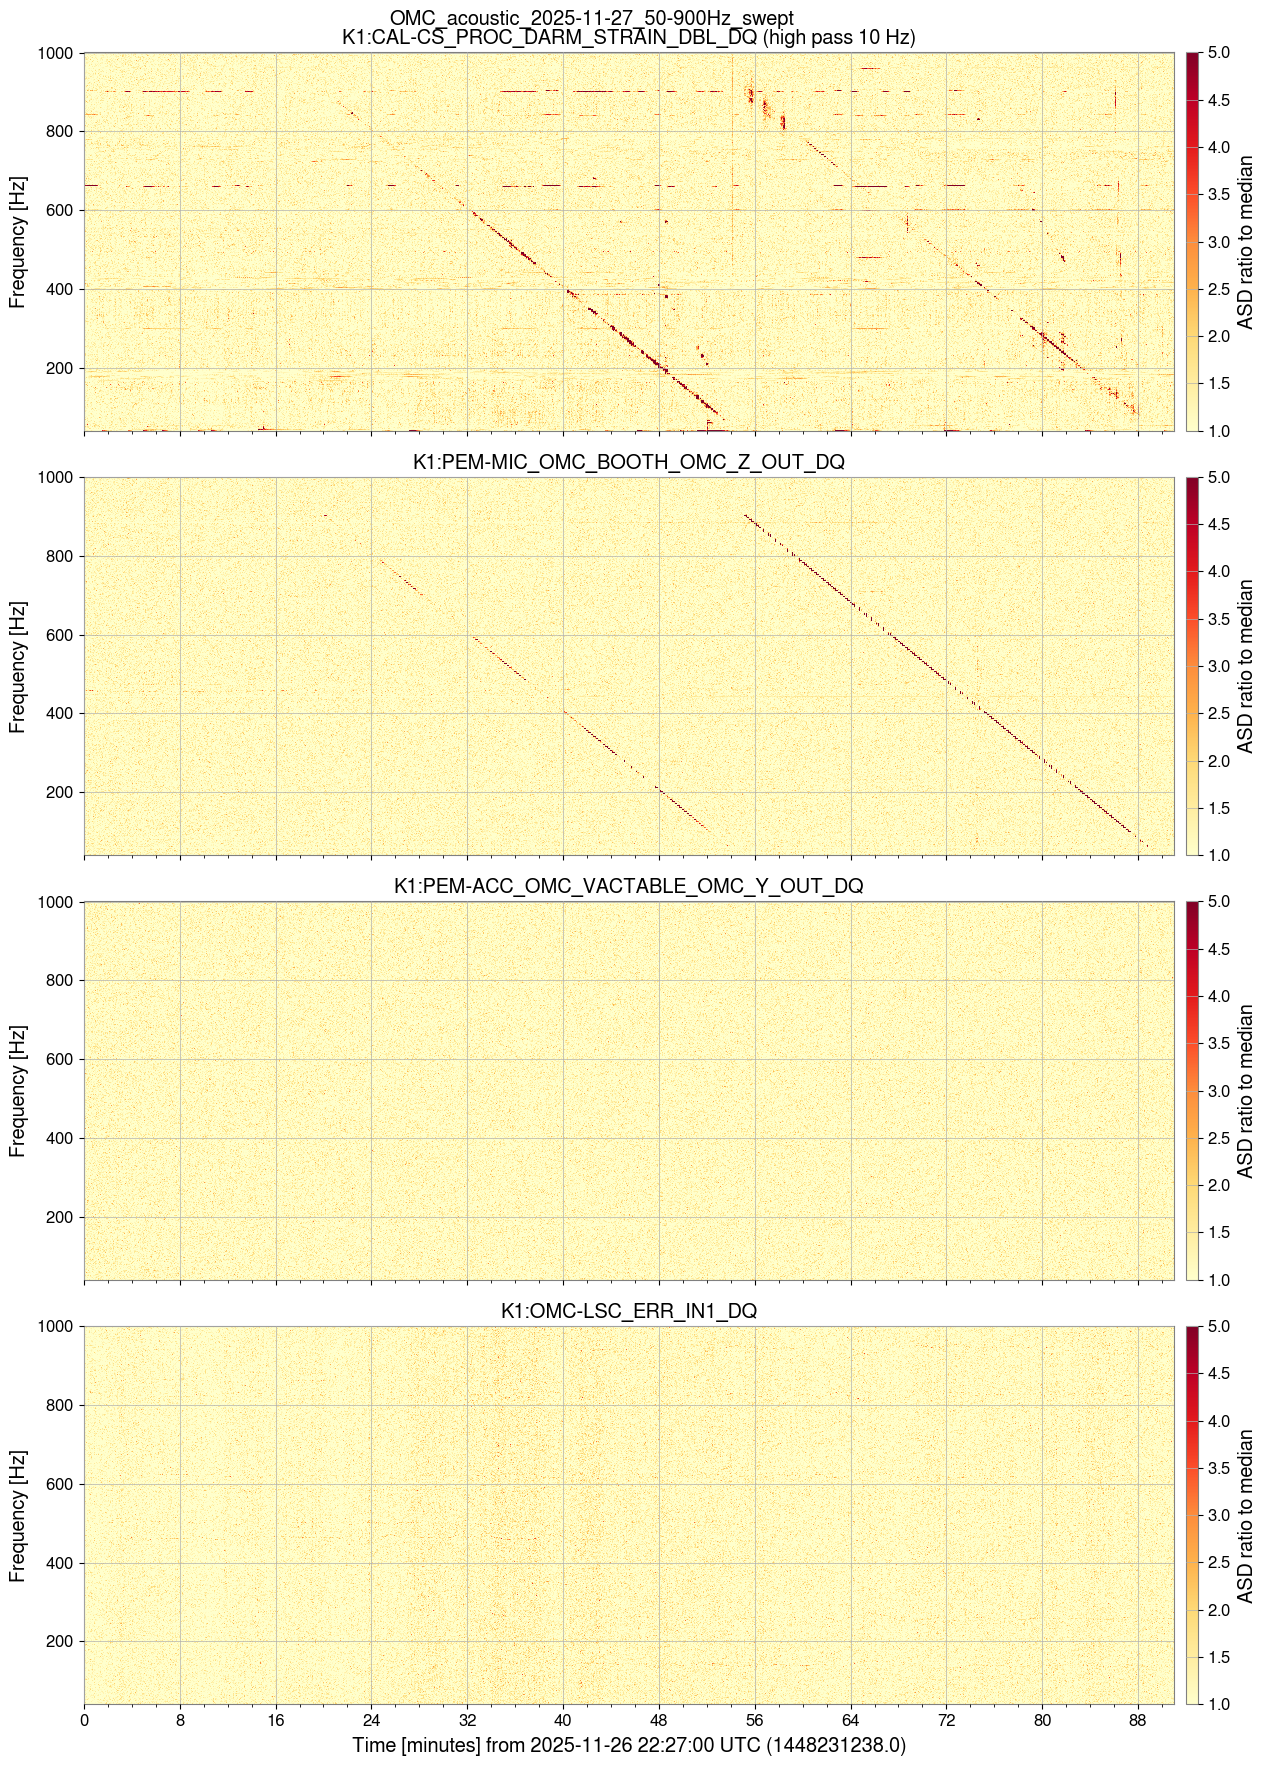
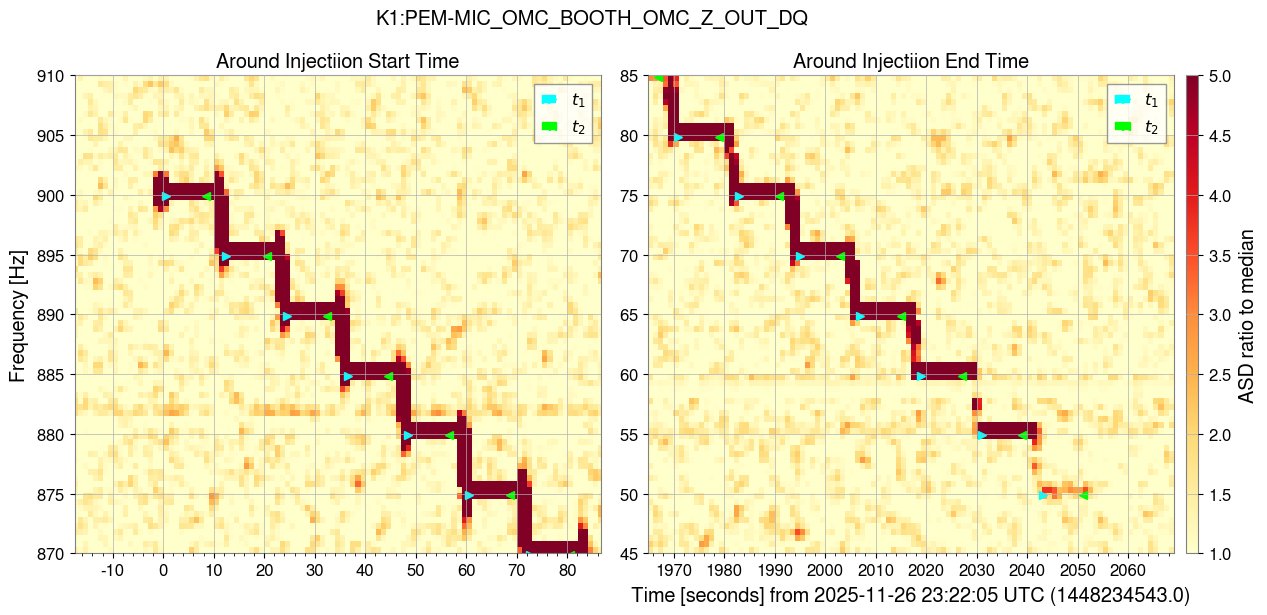
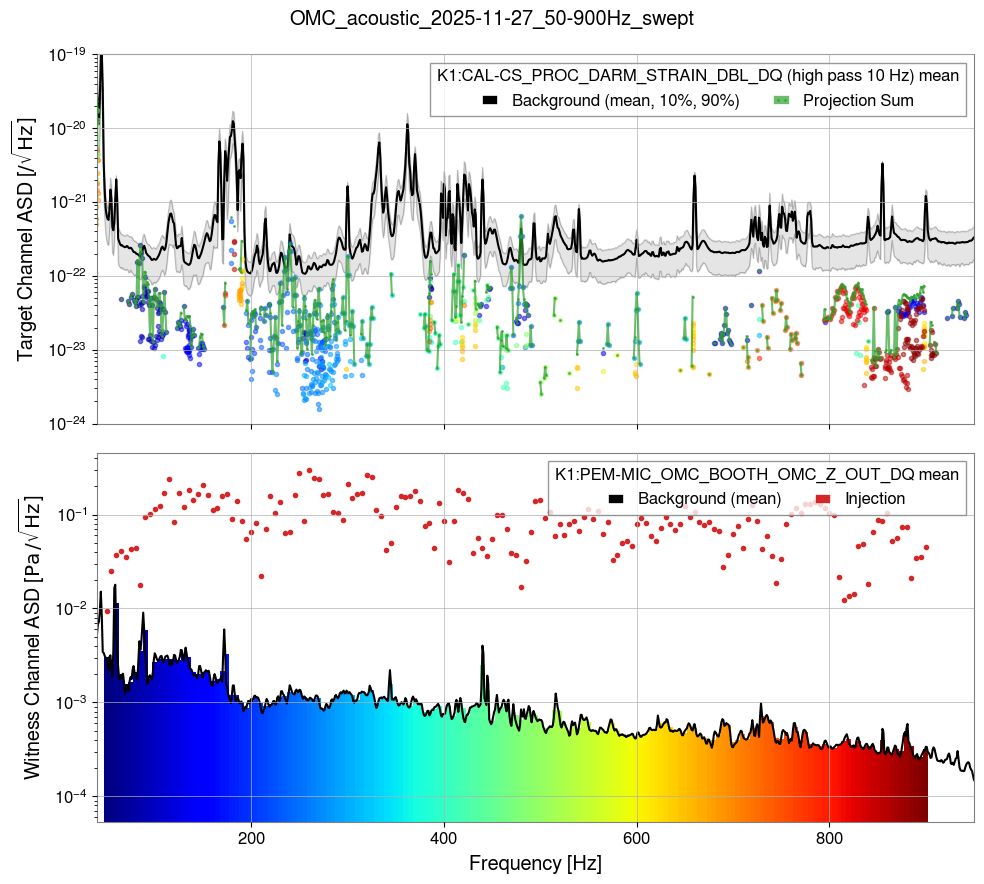
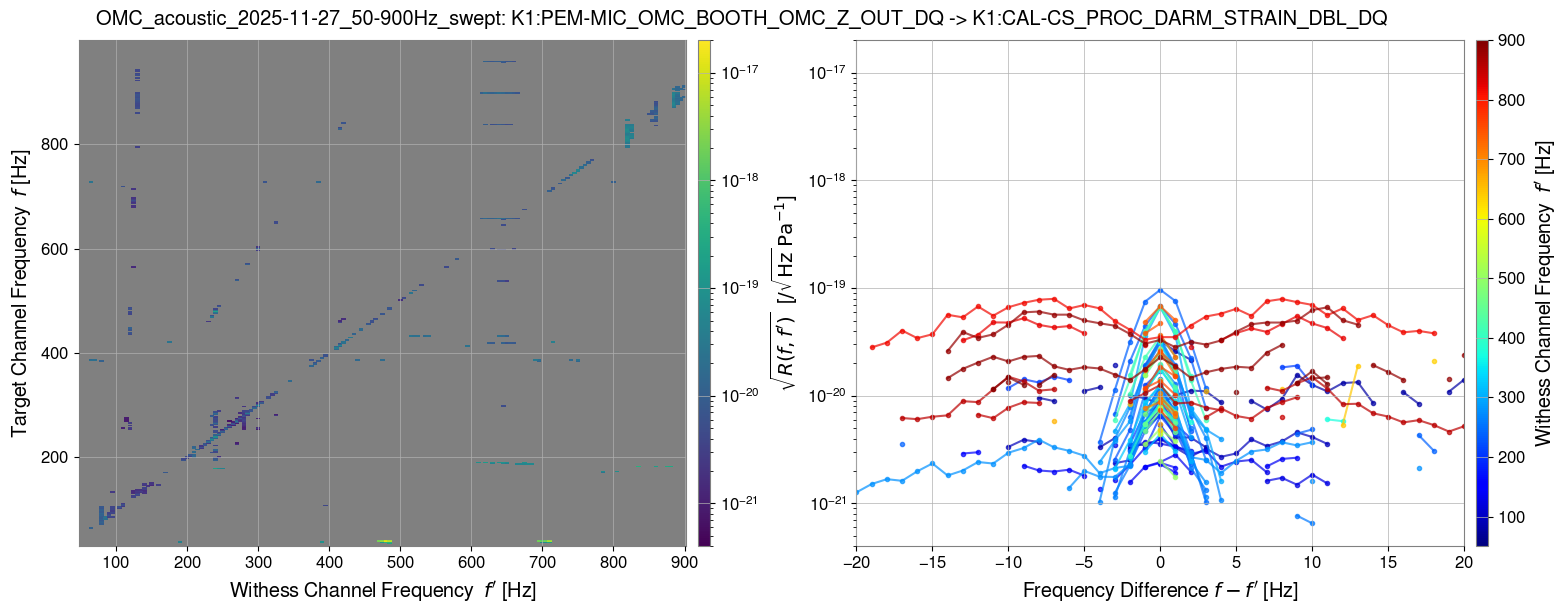
5. Acoustic injection to OMC
11/27 08:22:00 - 08:57:00 (JST)
EXC : K1:PEM-EXCITATION_SR3_RACK_6_EXC
REF : K1:PEM-MIC_OMC_BOOTH_OMC_Z_OUT_DQ
Info : OMC 50 - 900 Hz 171 point 5 Hz resolution 100 cnt excitation
During the measurement, SRM was tripped
Silent run - 12:18:30
1. Shake injection to TMSX table EXC1
11/27 12:18:30 - 12:32:00 (JST)
EXC : K1:PEM-EXCITATION_EX0_RACK_1_EXC
REF : K1:PEM-PORTABLE_EXC_RACK_EX0_ADC0_DSUB25_OUT_DQ
Info : TMSX EXC1 1 - 10 Hz 10 points 1 Hz resolution 60 seconds at one point 500cnt excitation
(But from my eye, the reference accelerometer response was not good maybe due to the position)
2. Shake injection to TMSX table EXC1
11/27 12:32:00 - 12:38:00 (JST)
EXC : K1:PEM-EXCITATION_EX0_RACK_1_EXC
REF : K1:PEM-PORTABLE_EXC_RACK_EX0_ADC0_DSUB25_OUT_DQ
Info : TMSX EXC1 10 - 50 Hz 9 points 5 Hz resolution 30 seconds at one point 500cnt excitation
3. Shake injection to TMSX table EXC2
11/27 12:38:00 - 12:45:00 (JST)
EXC : K1:PEM-EXCITATION_EX0_RACK_2_EXC
REF : K1:PEM-PORTABLE_EXC_RACK_EX0_ADC0_DSUB26_OUT_DQ
Info : TMSX EXC2 10 - 50 Hz 9 points 5 Hz resolution 30 seconds at one point 500cnt excitation
(From my eye, wide area injection can be performed from the accelerometer response)
4. Shake injection to TMSX table EXC2
11/27 12:45:00 - 12:58:00 (JST)
EXC : K1:PEM-EXCITATION_EX0_RACK_2_EXC
REF : K1:PEM-PORTABLE_EXC_RACK_EX0_ADC0_DSUB26_OUT_DQ
Info : TMSX EXC2 1 - 10 Hz 10 points 1 Hz resolution 60 seconds at one point 500cnt excitation
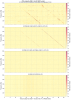
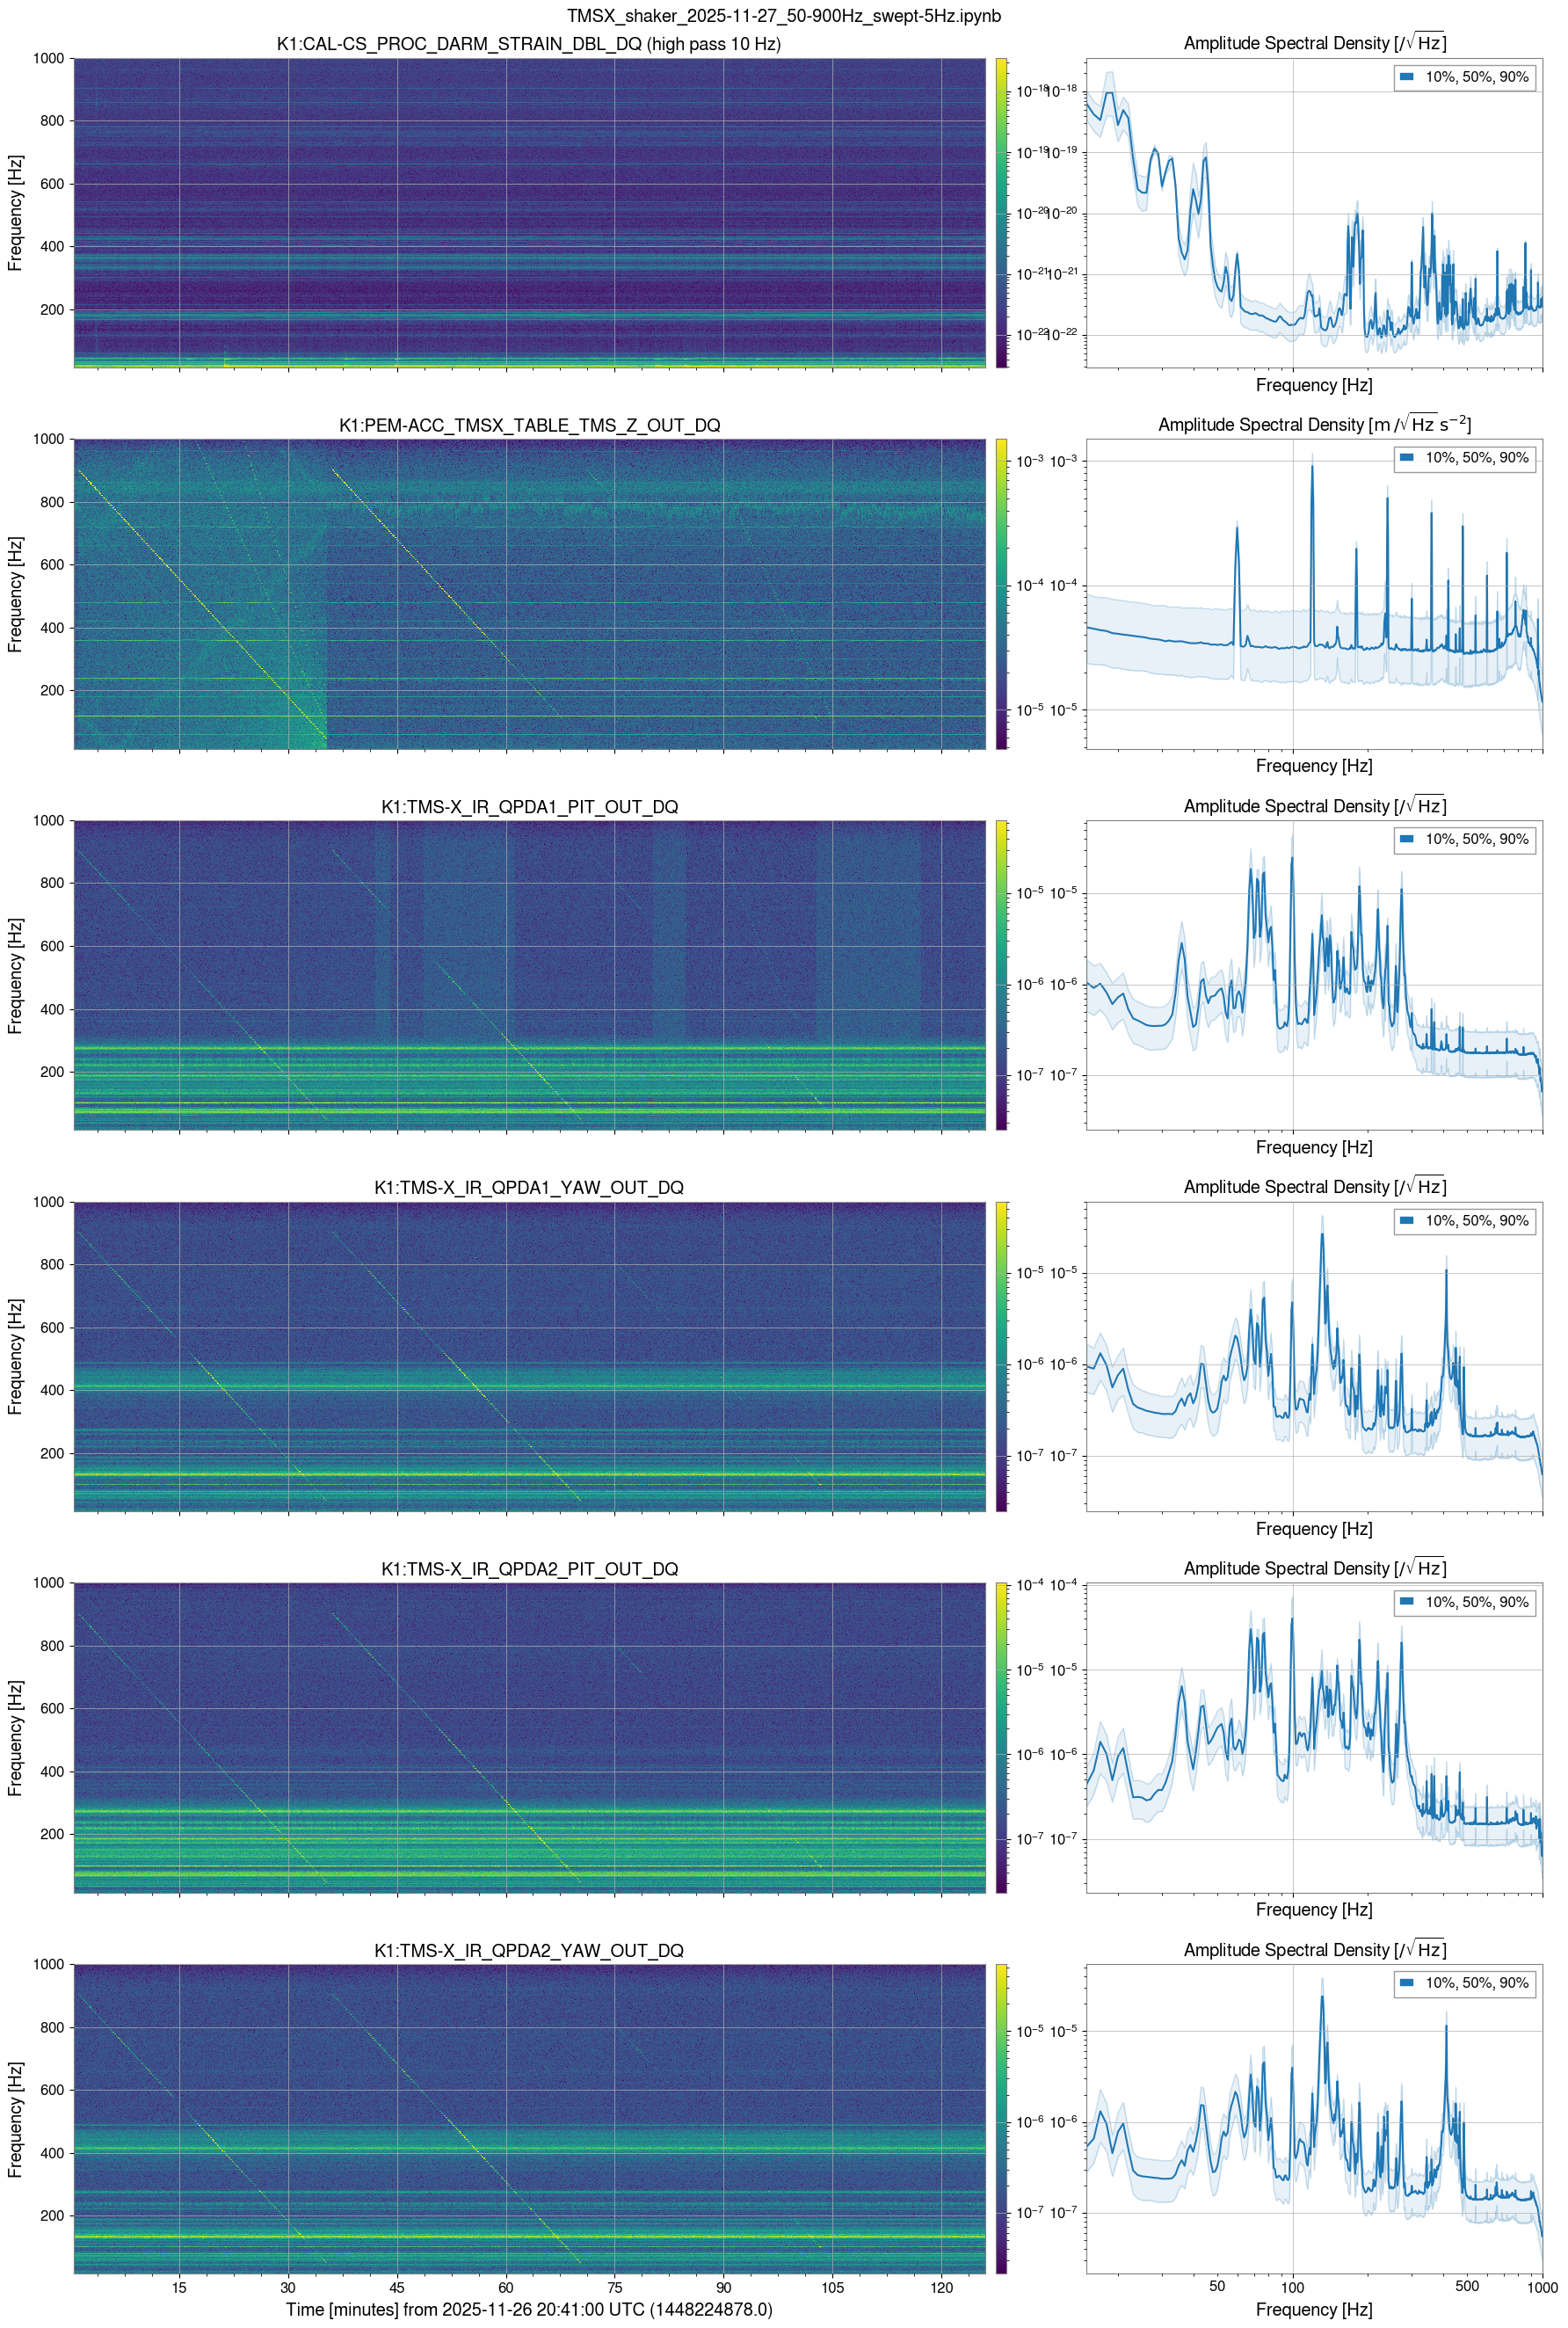
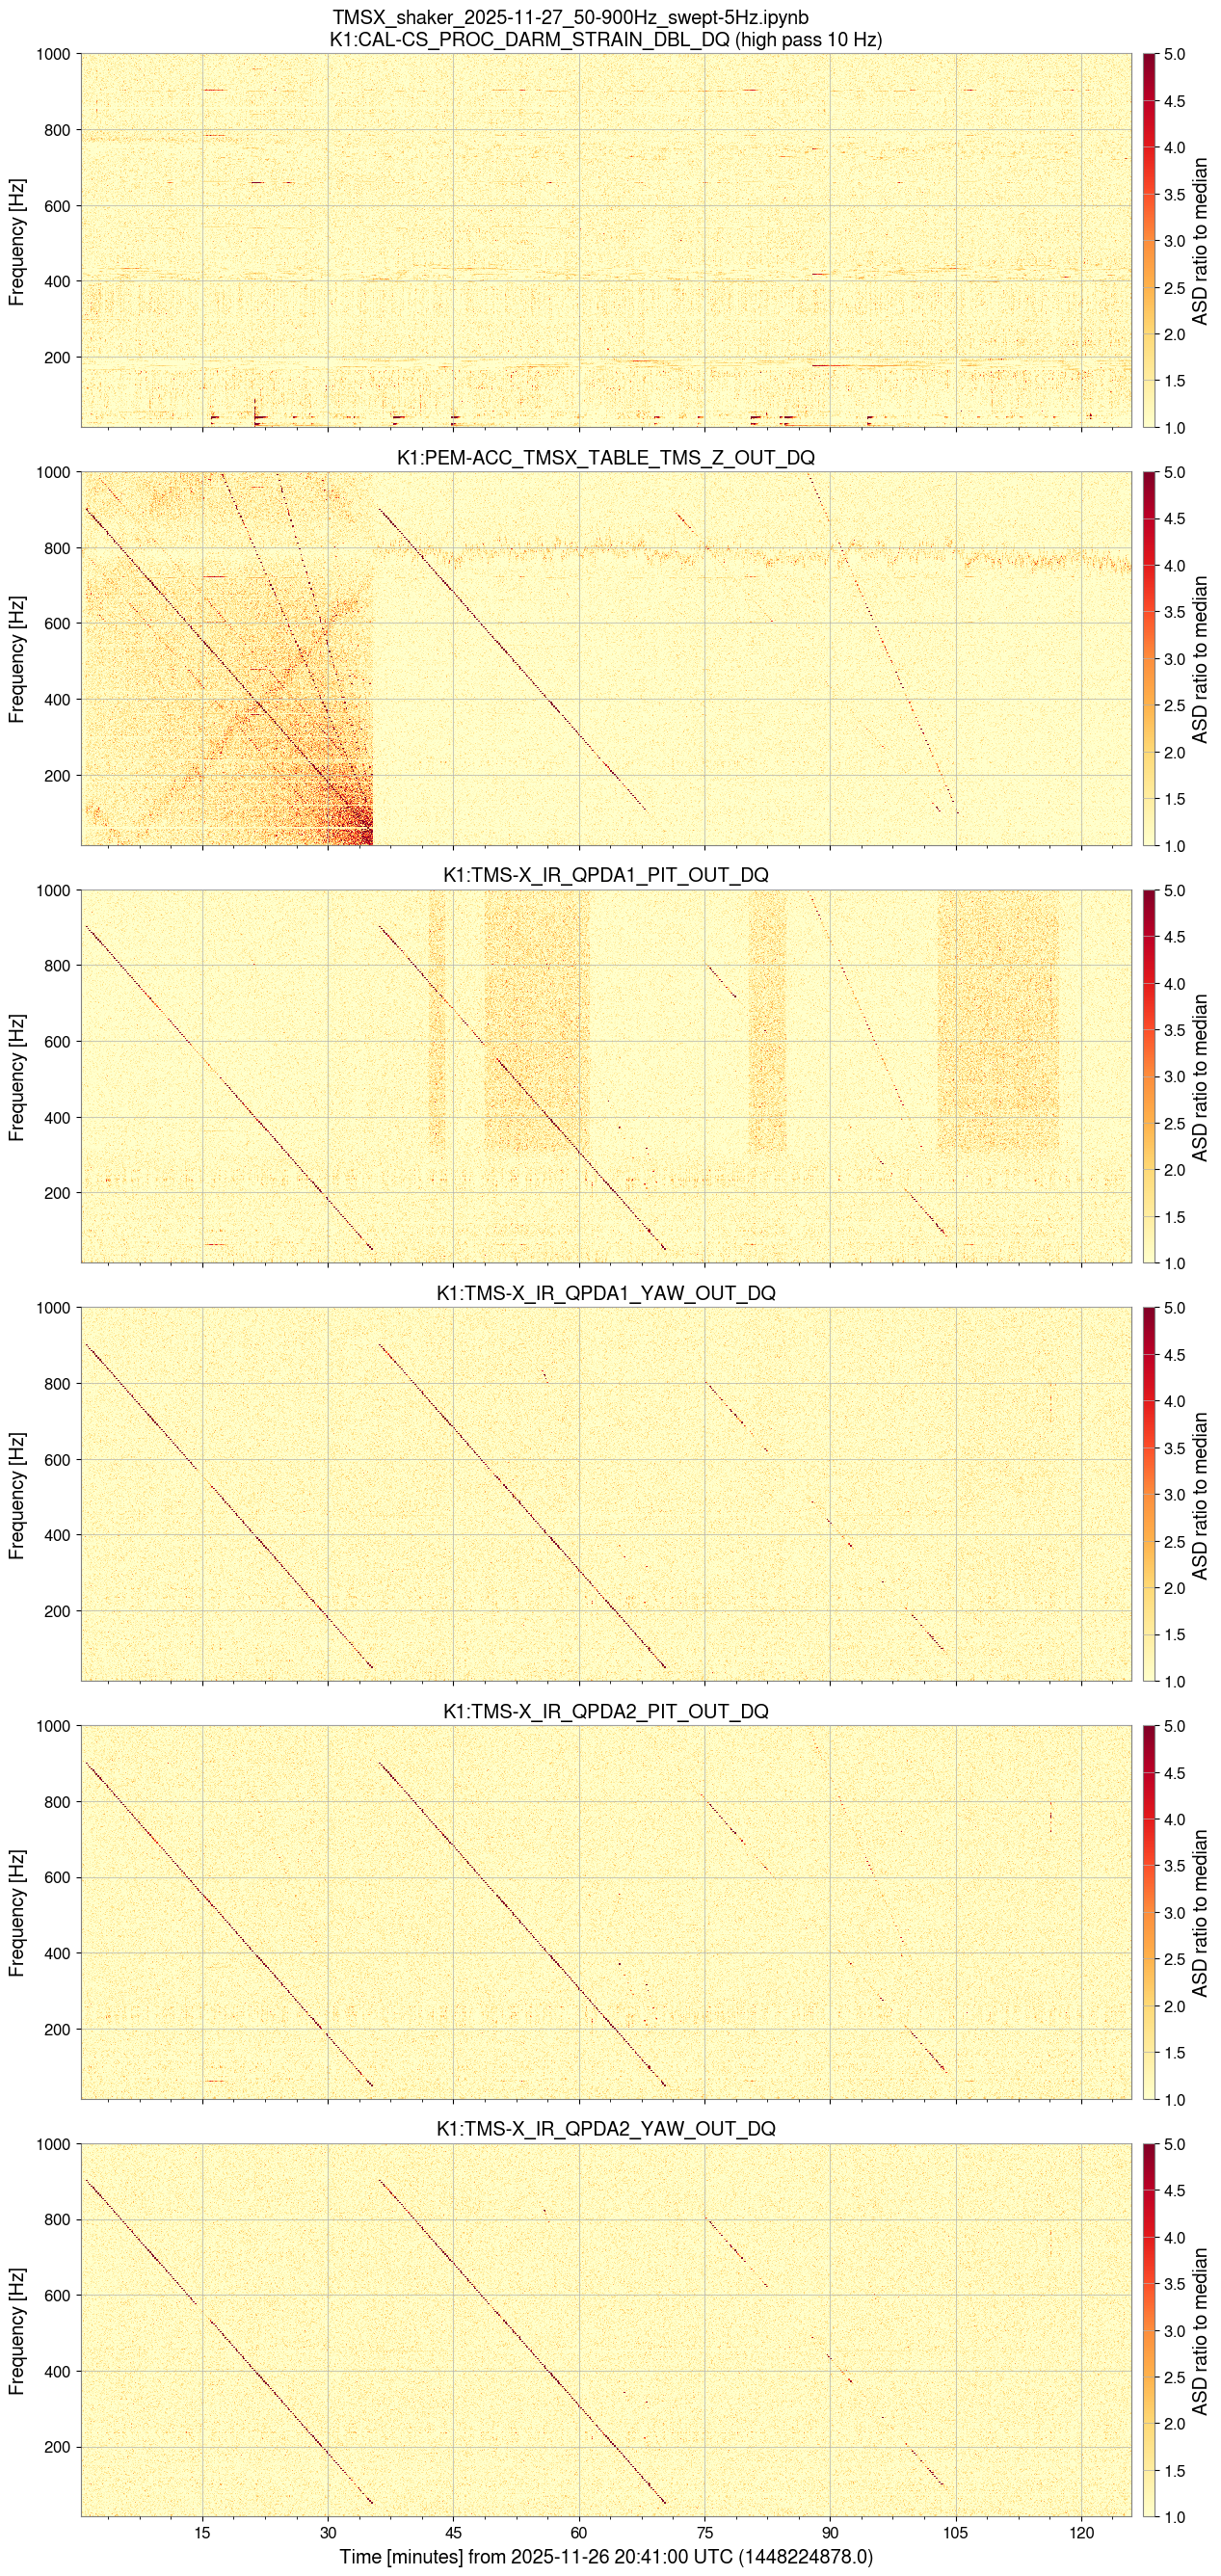
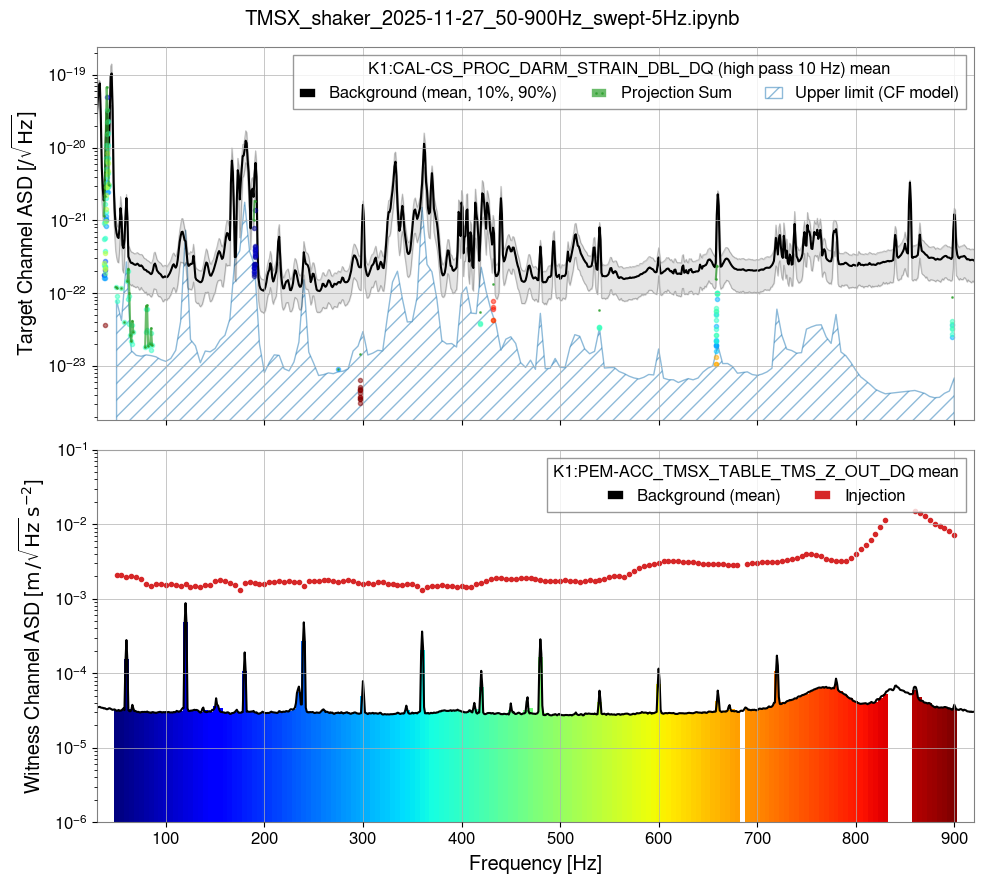
I analyzed the shaker injection data of
1. Shake injection to TMSX table EXC2
11/27 05:42:00 - 06:17:00 (JST)
EXC : K1:PEM-EXCITATION_EX0_RACK_2_EXC
REF : K1:PEM-ACC_TMSX_TABLE_TMS_Z_OUT_DQ
info : TMSX EXC2 50 - 900 Hz 171 point 5 Hz resolution 50cnt excitation
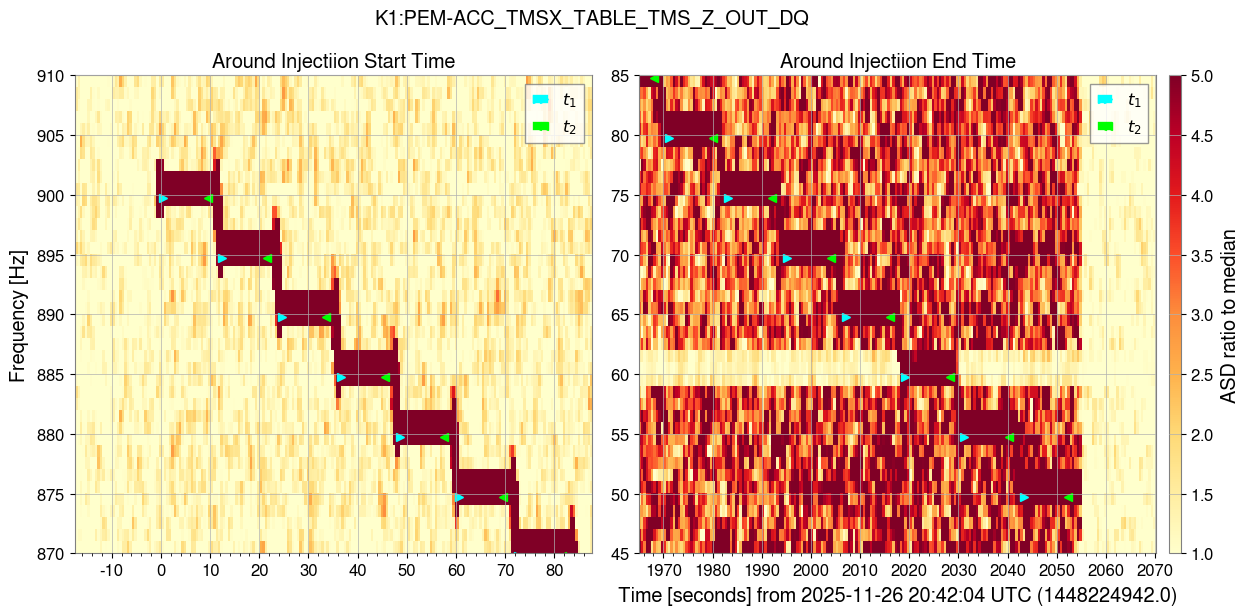
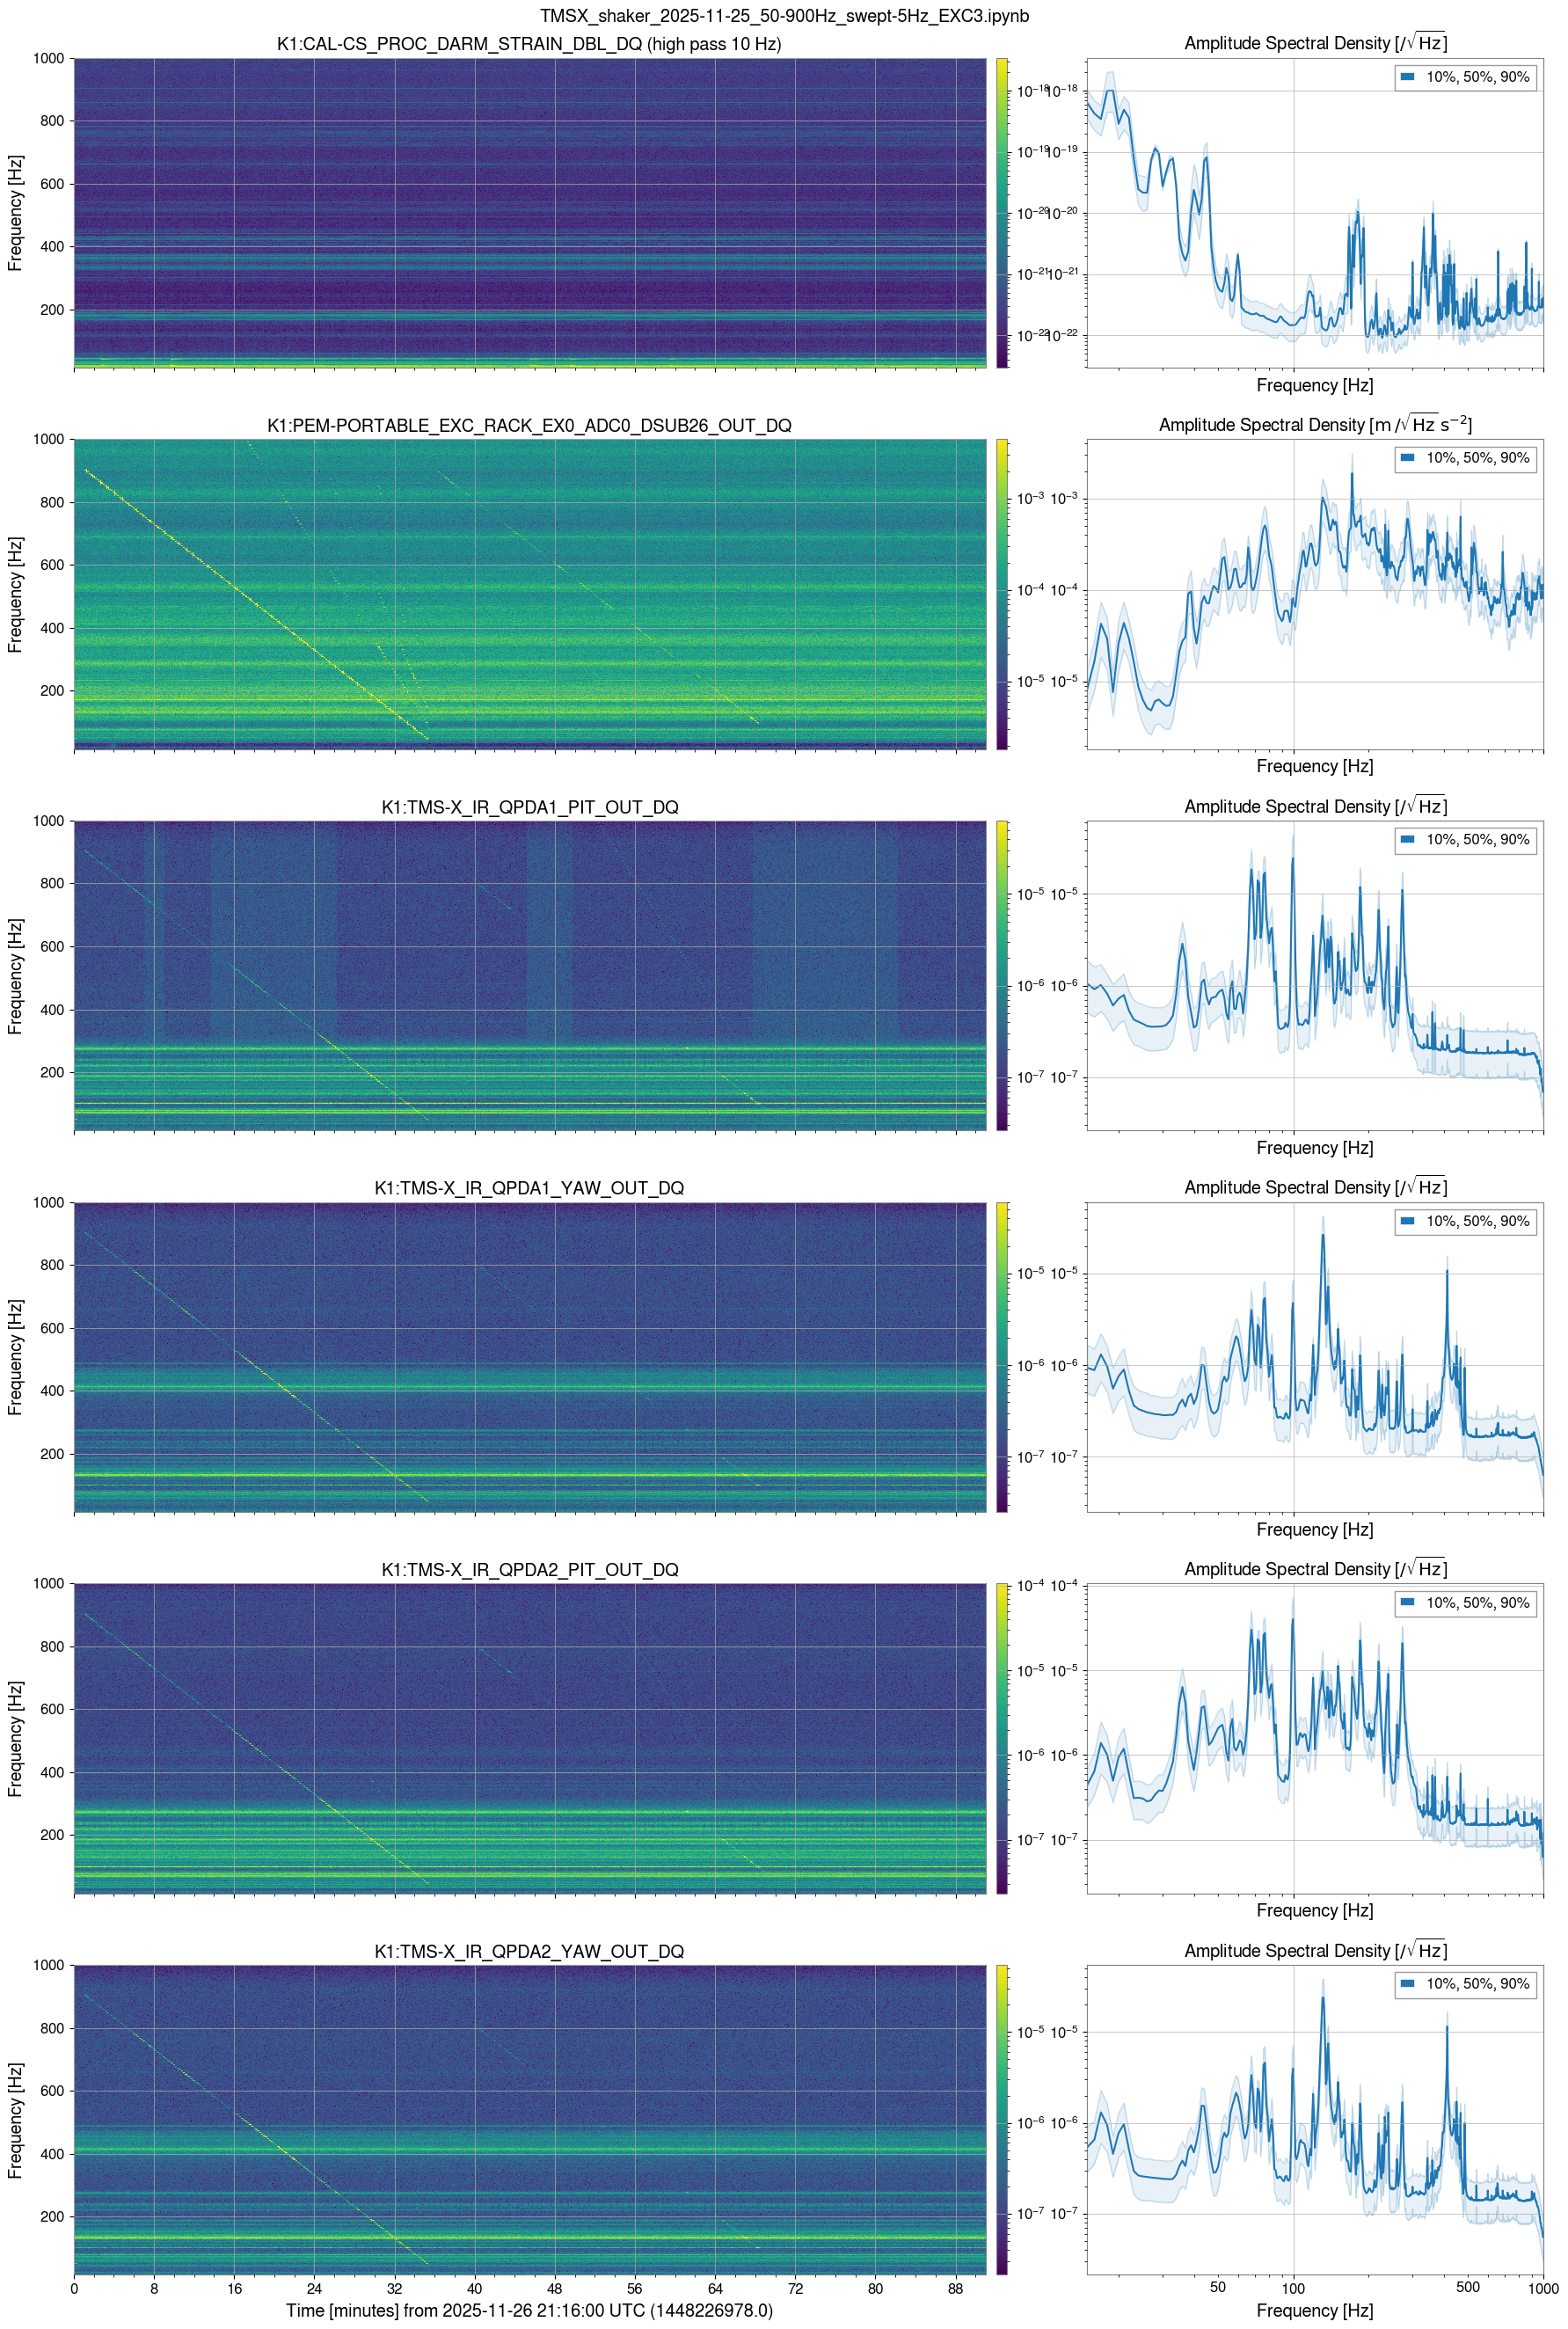
Some glitch time data is removed.
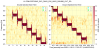
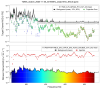
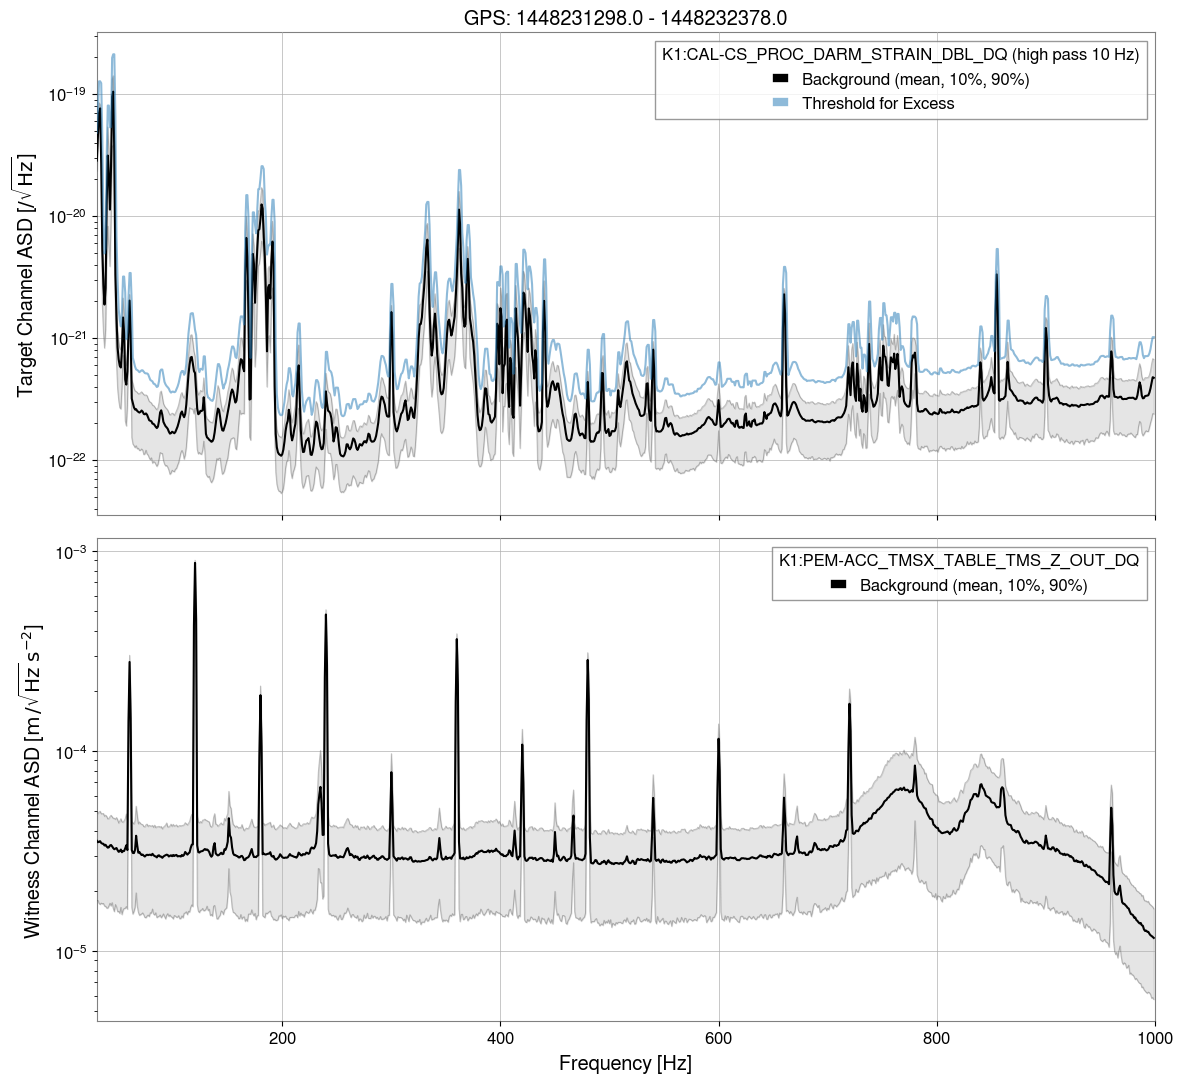
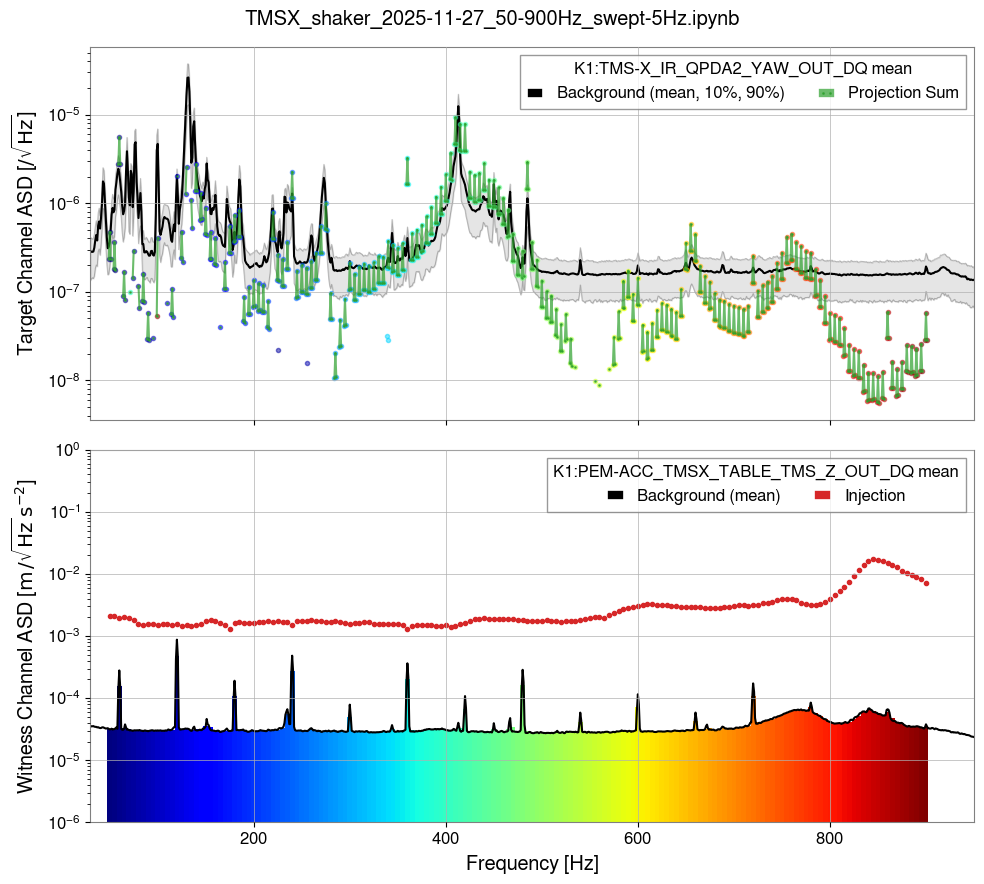
Note that the ACC spectrum w/o injection looks to be dominated by sensor noise or ADC noise. So the final projection should be overestimated.
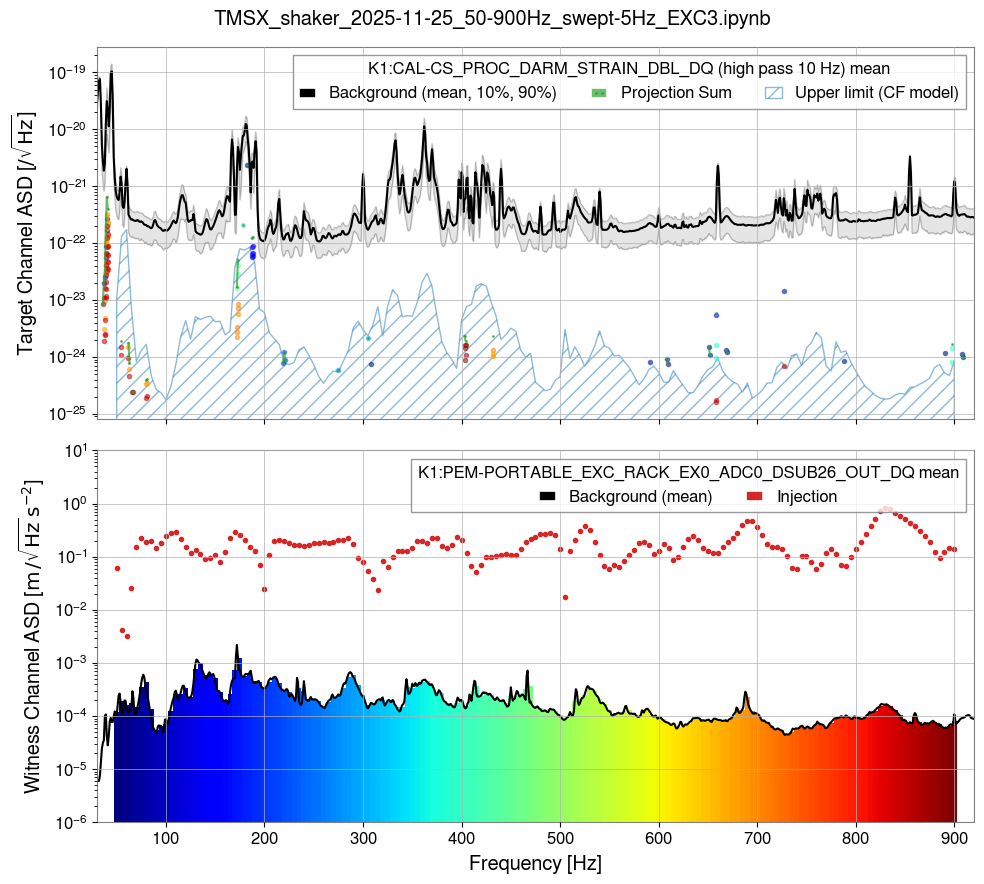
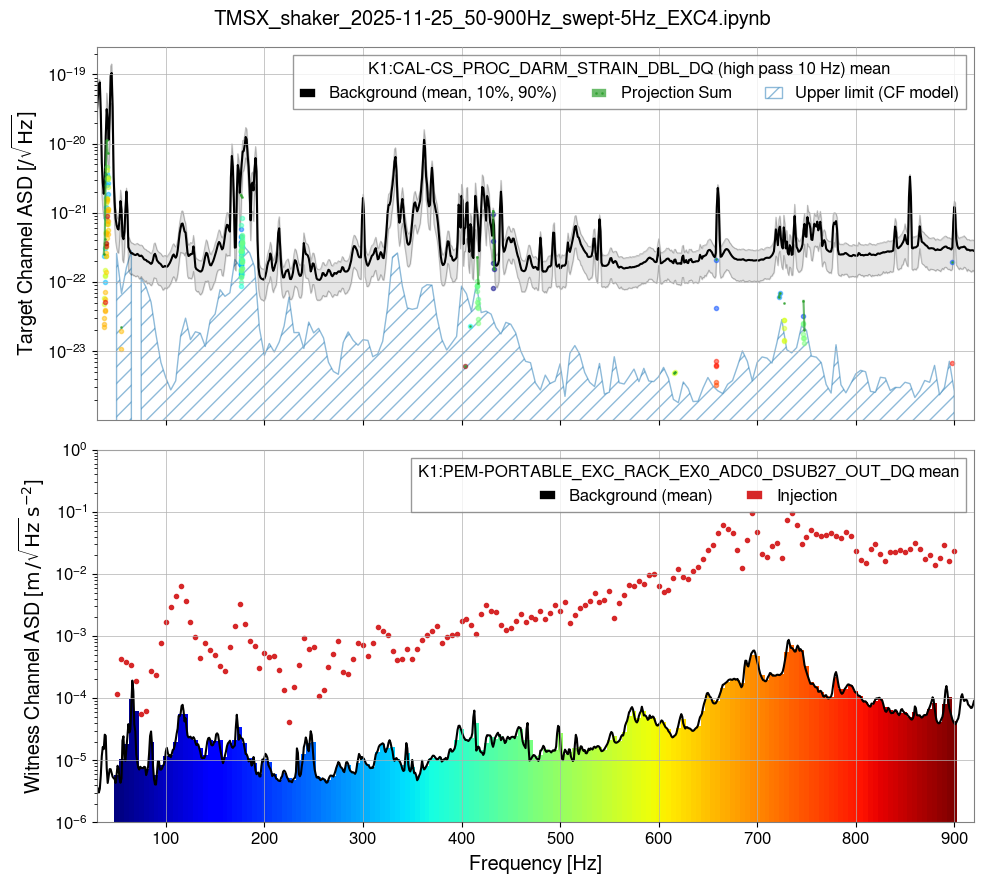
For the strain channel, almost no significant excesses were found, and the upper limit by the CF-model is plotted.


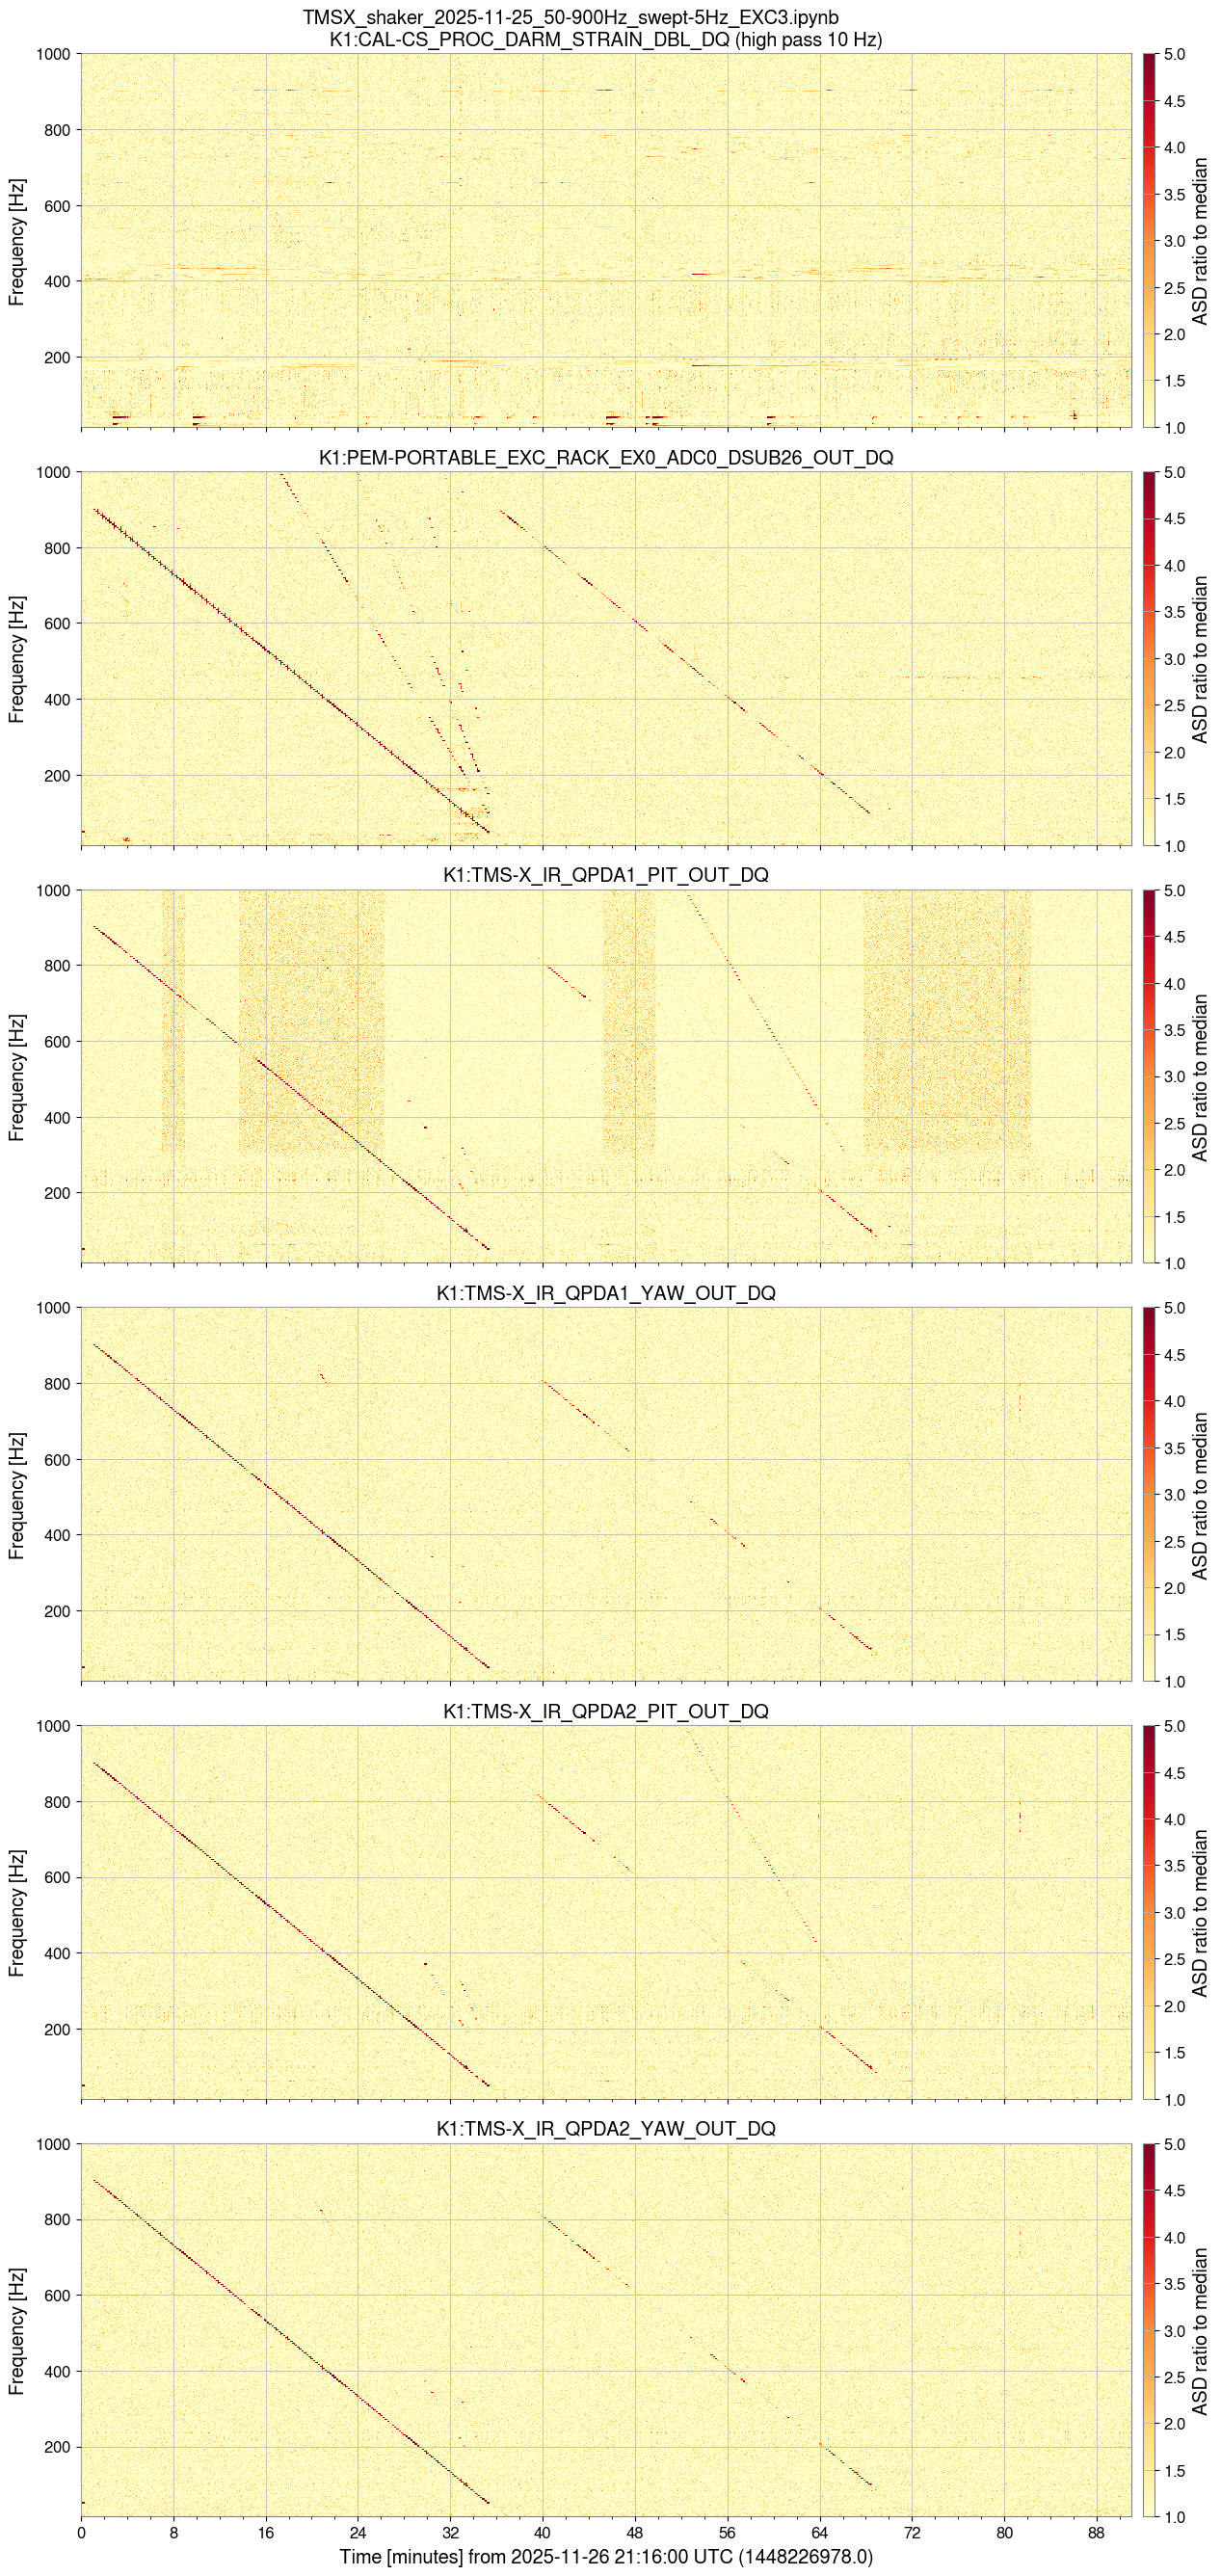
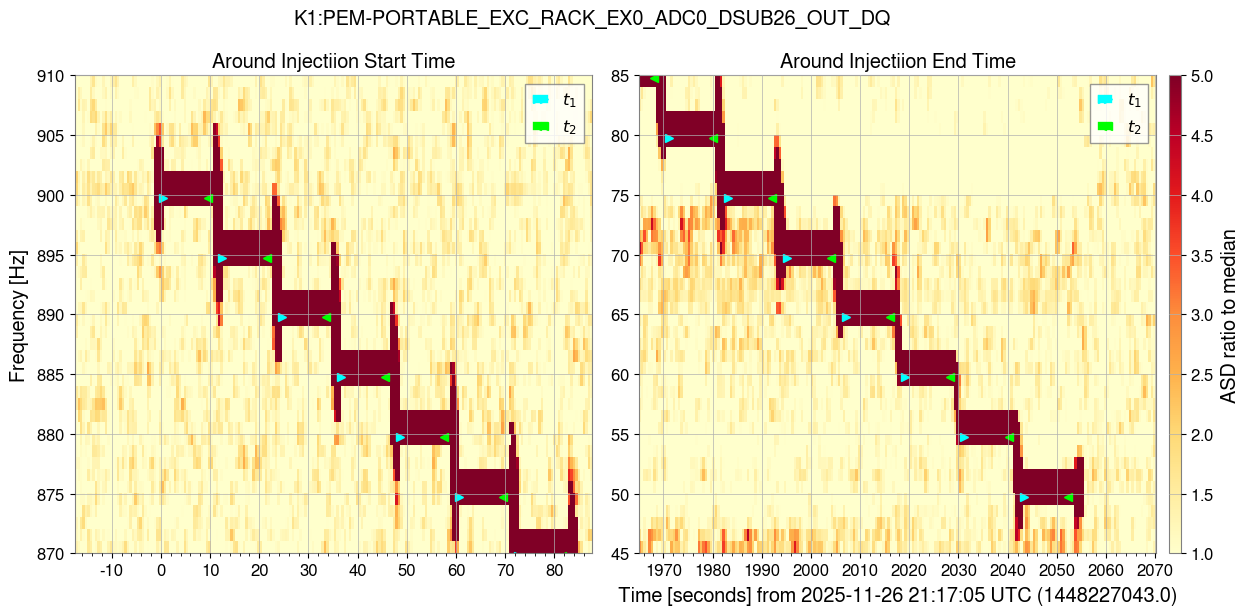
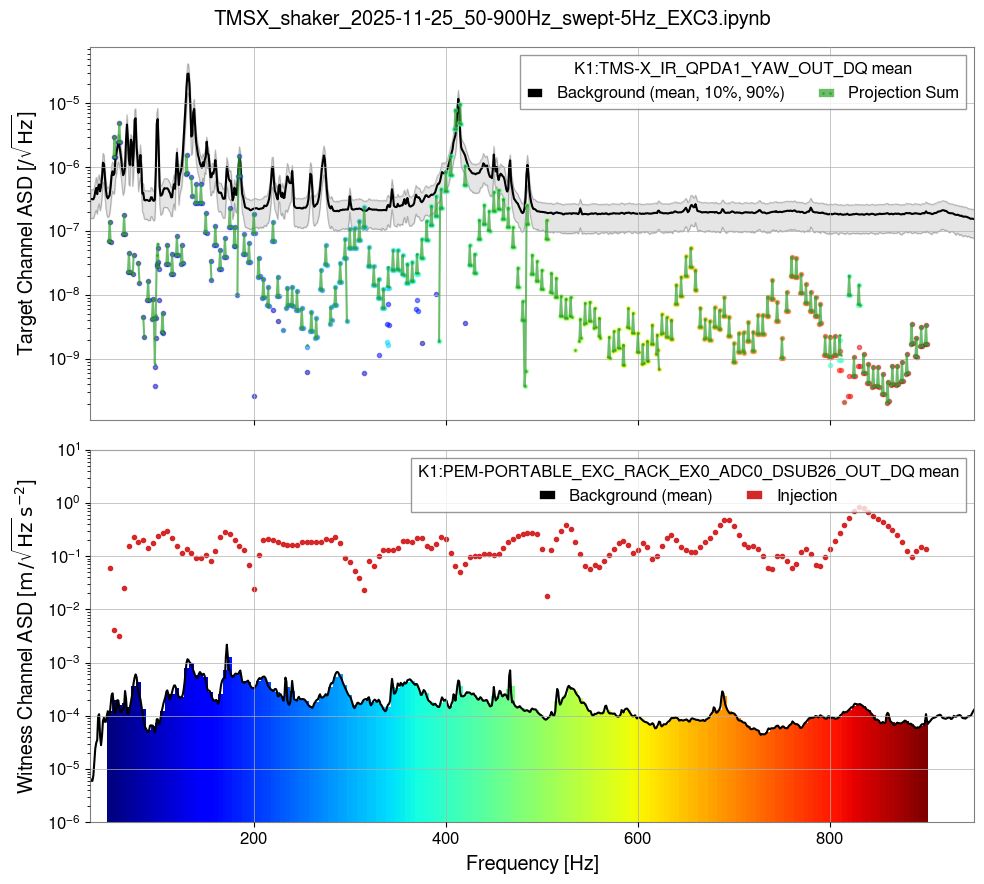
I analyzed the shaker injection data of
2. Shake injection to TMSX table EXC3
11/27 06:17:00 - 06:52:00 (JST)
EXC : K1:PEM-EXCITATION_EX0_RACK_3_EXC
REF : K1:PEM-PORTABLE_EXC_RACK_EX0_ADC0_DSUB26_OUT_DQ
info : TMSX EXC3 50 - 900 Hz 171 point 5 Hz resolution 50cnt excitation


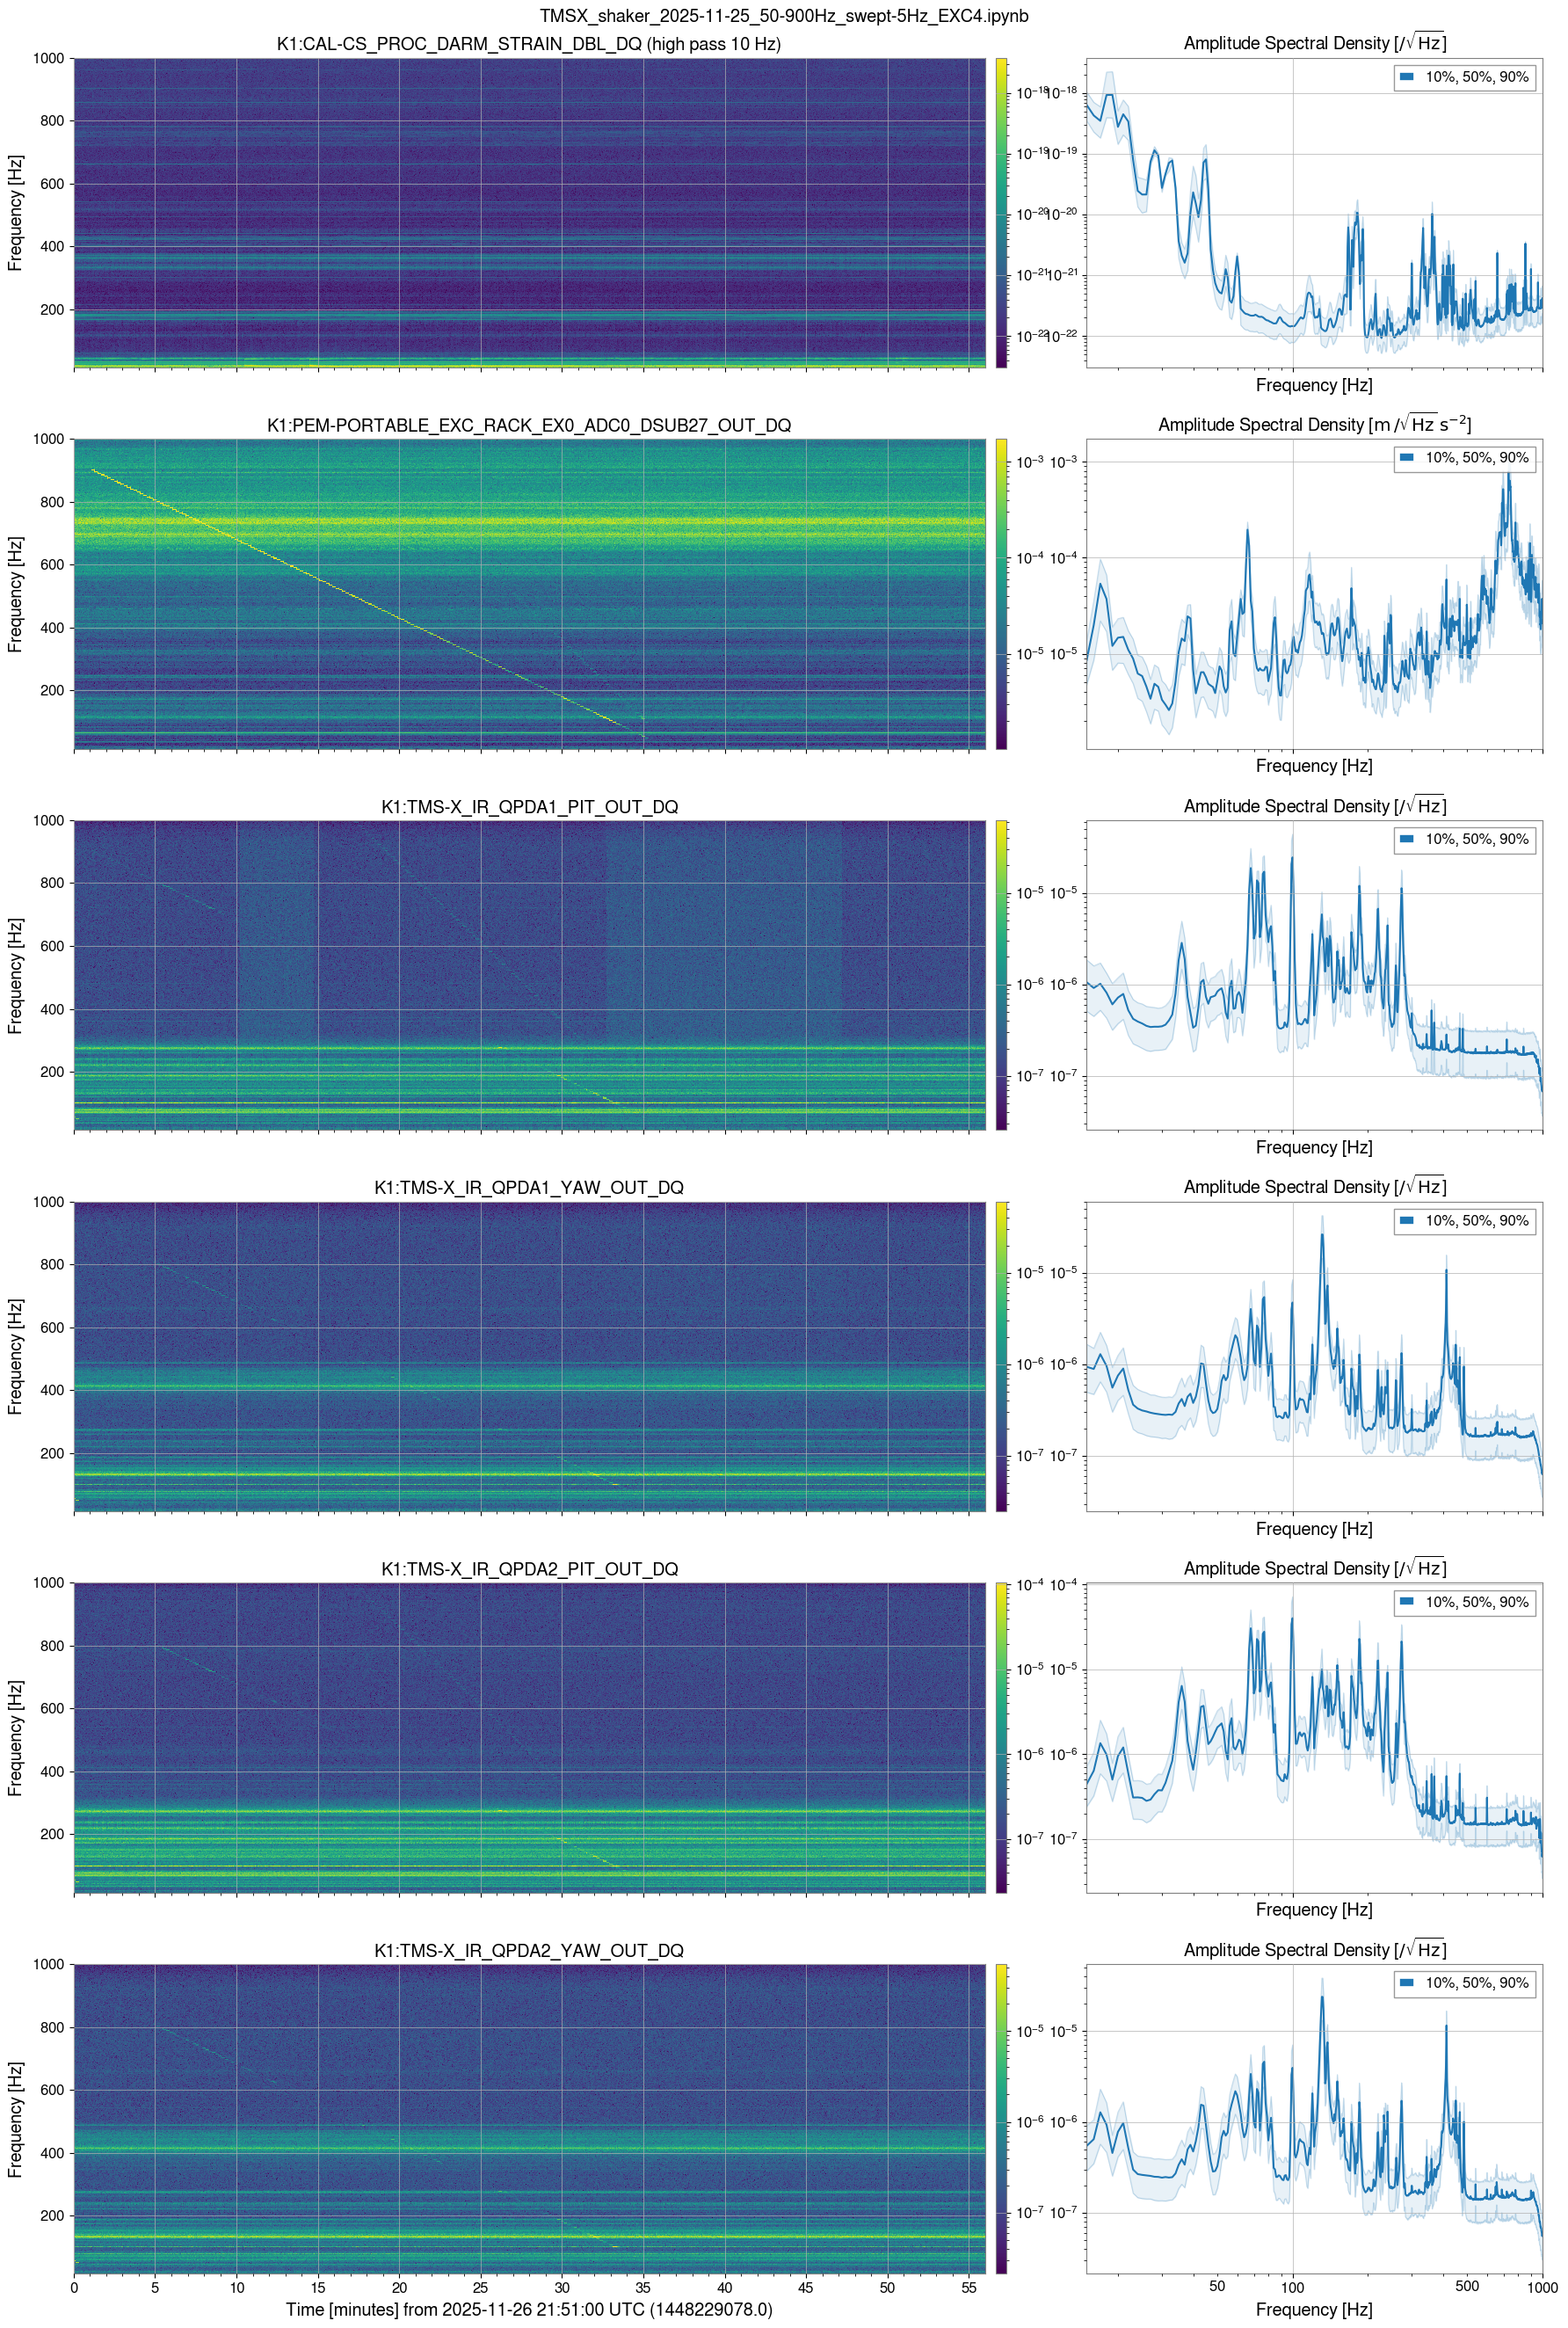
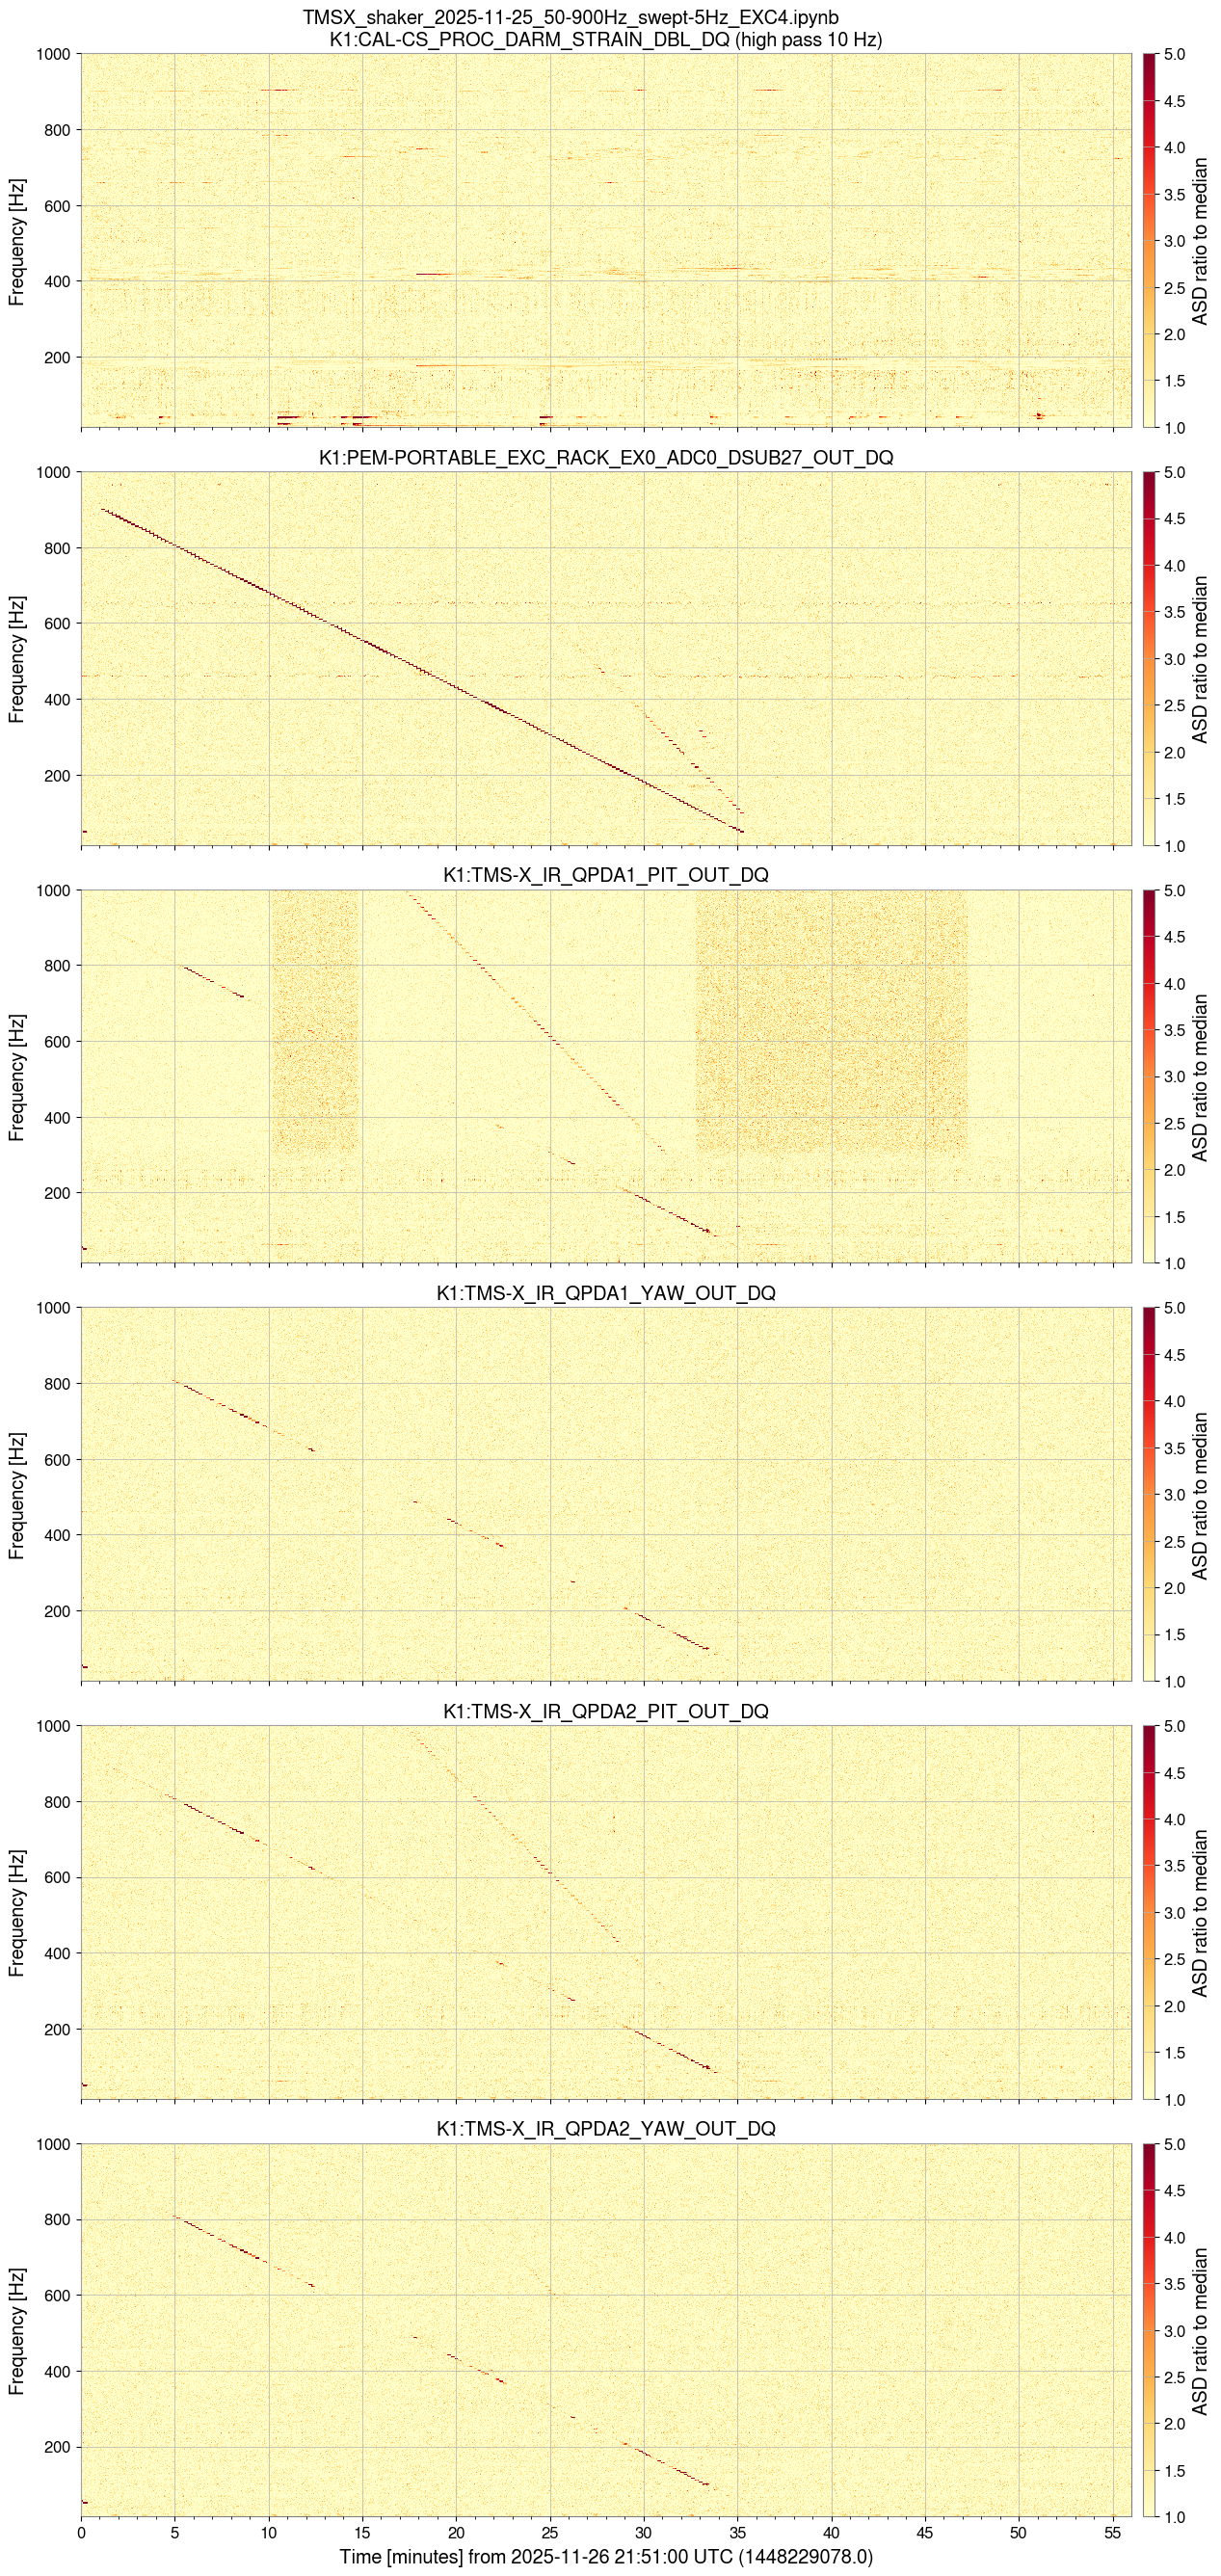
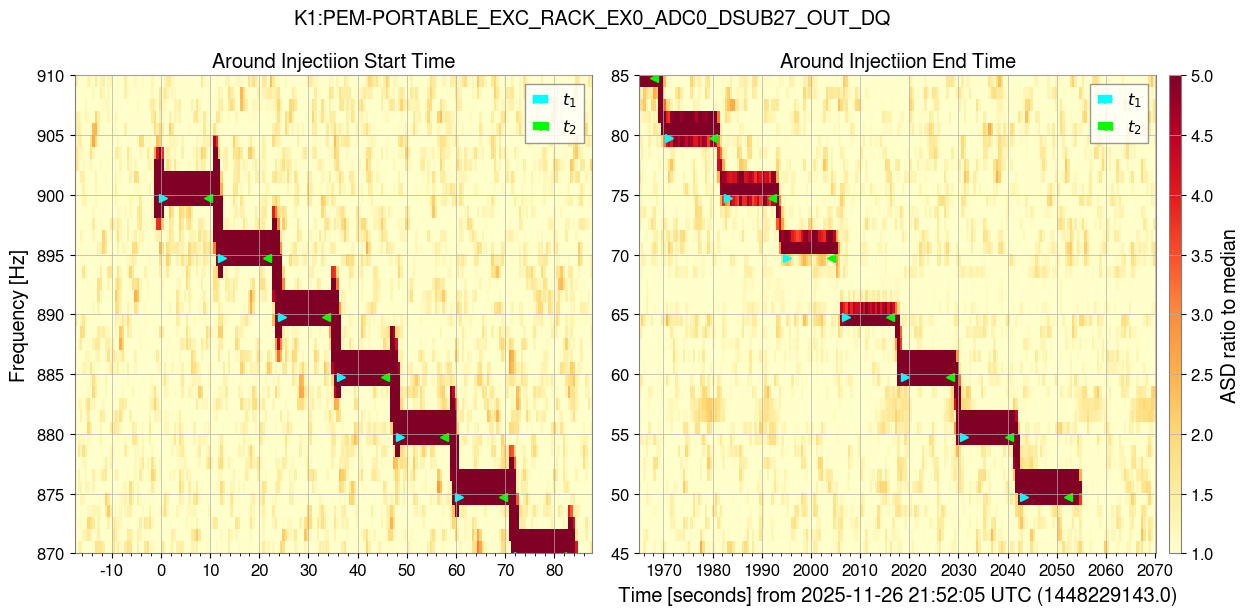
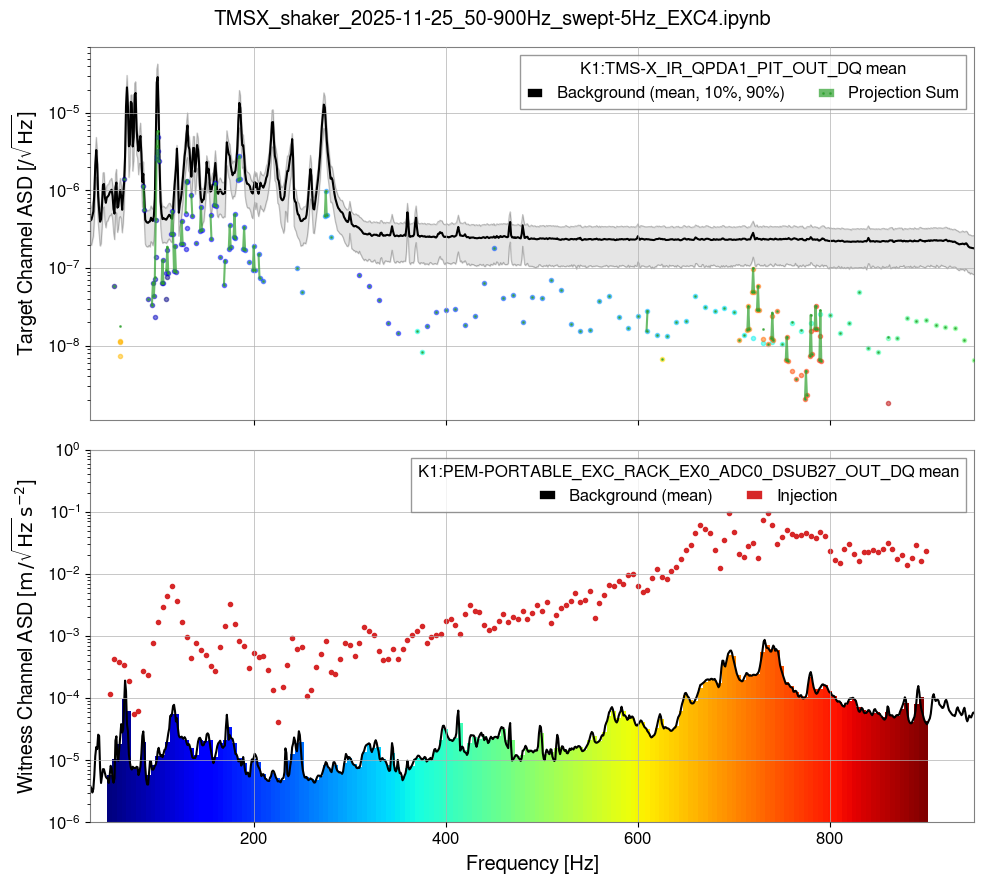
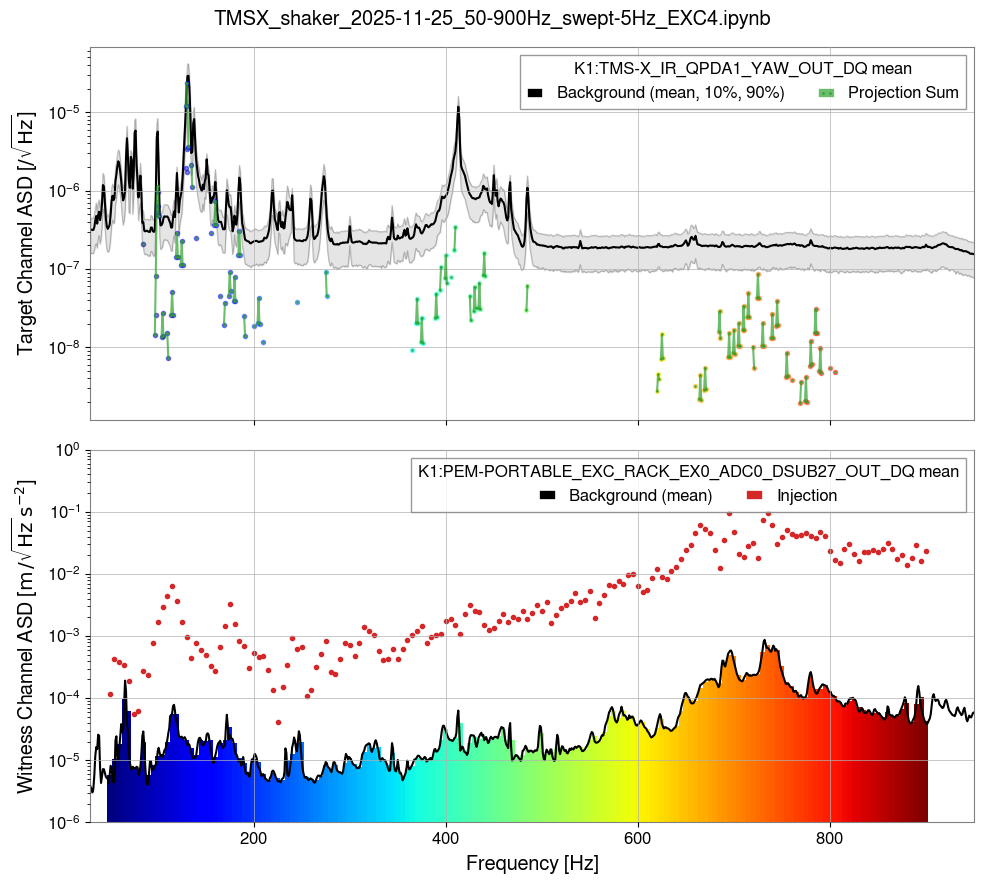
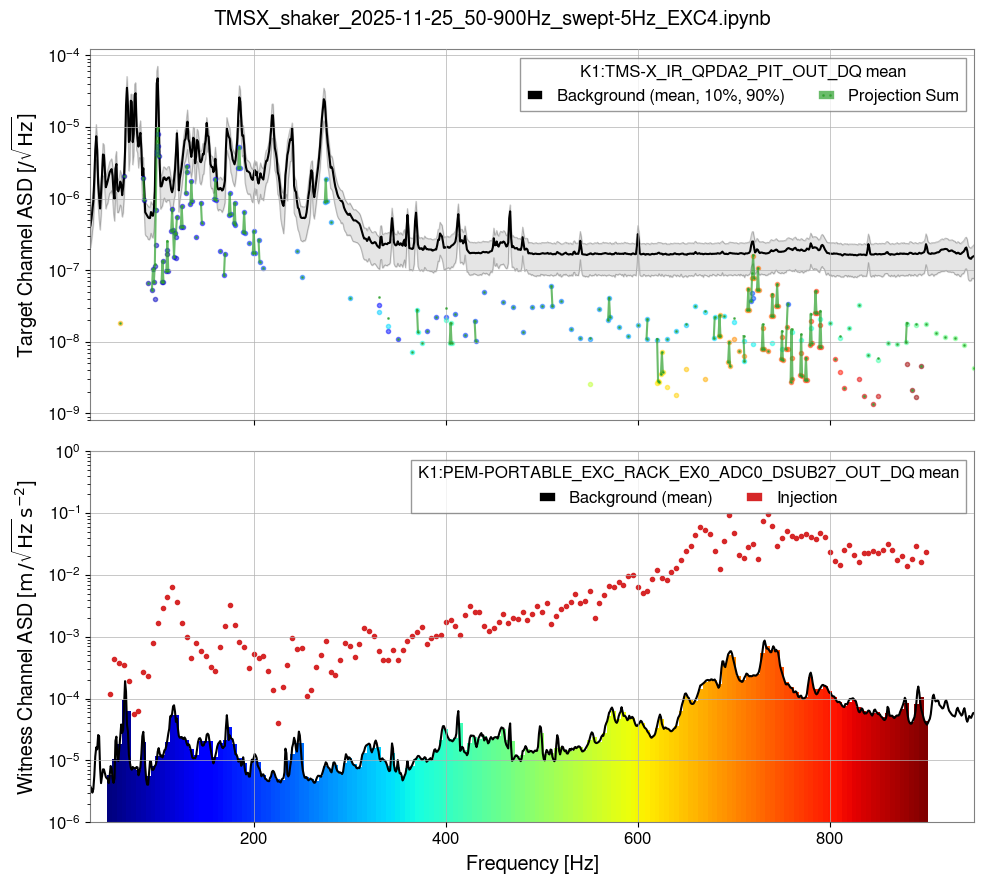
I analyzed the shaker injection data of
3. Shake injection to TMSX table EXC4
11/27 06:52:00 - 07:27:00 (JST)
EXC : K1:PEM-EXCITATION_EX0_RACK_4_EXC
REF : K1:PEM-PORTABLE_EXC_RACK_EX0_ADC0_DSUB27_OUT_DQ
info : TMSX EXC4 50 - 900 Hz 171 point 5 Hz resolution 100cnt excitationSilent run 7:27 - 7:47


I analyzed the shaker injection data ofThe A A
Silent run 7:27 - 7:47
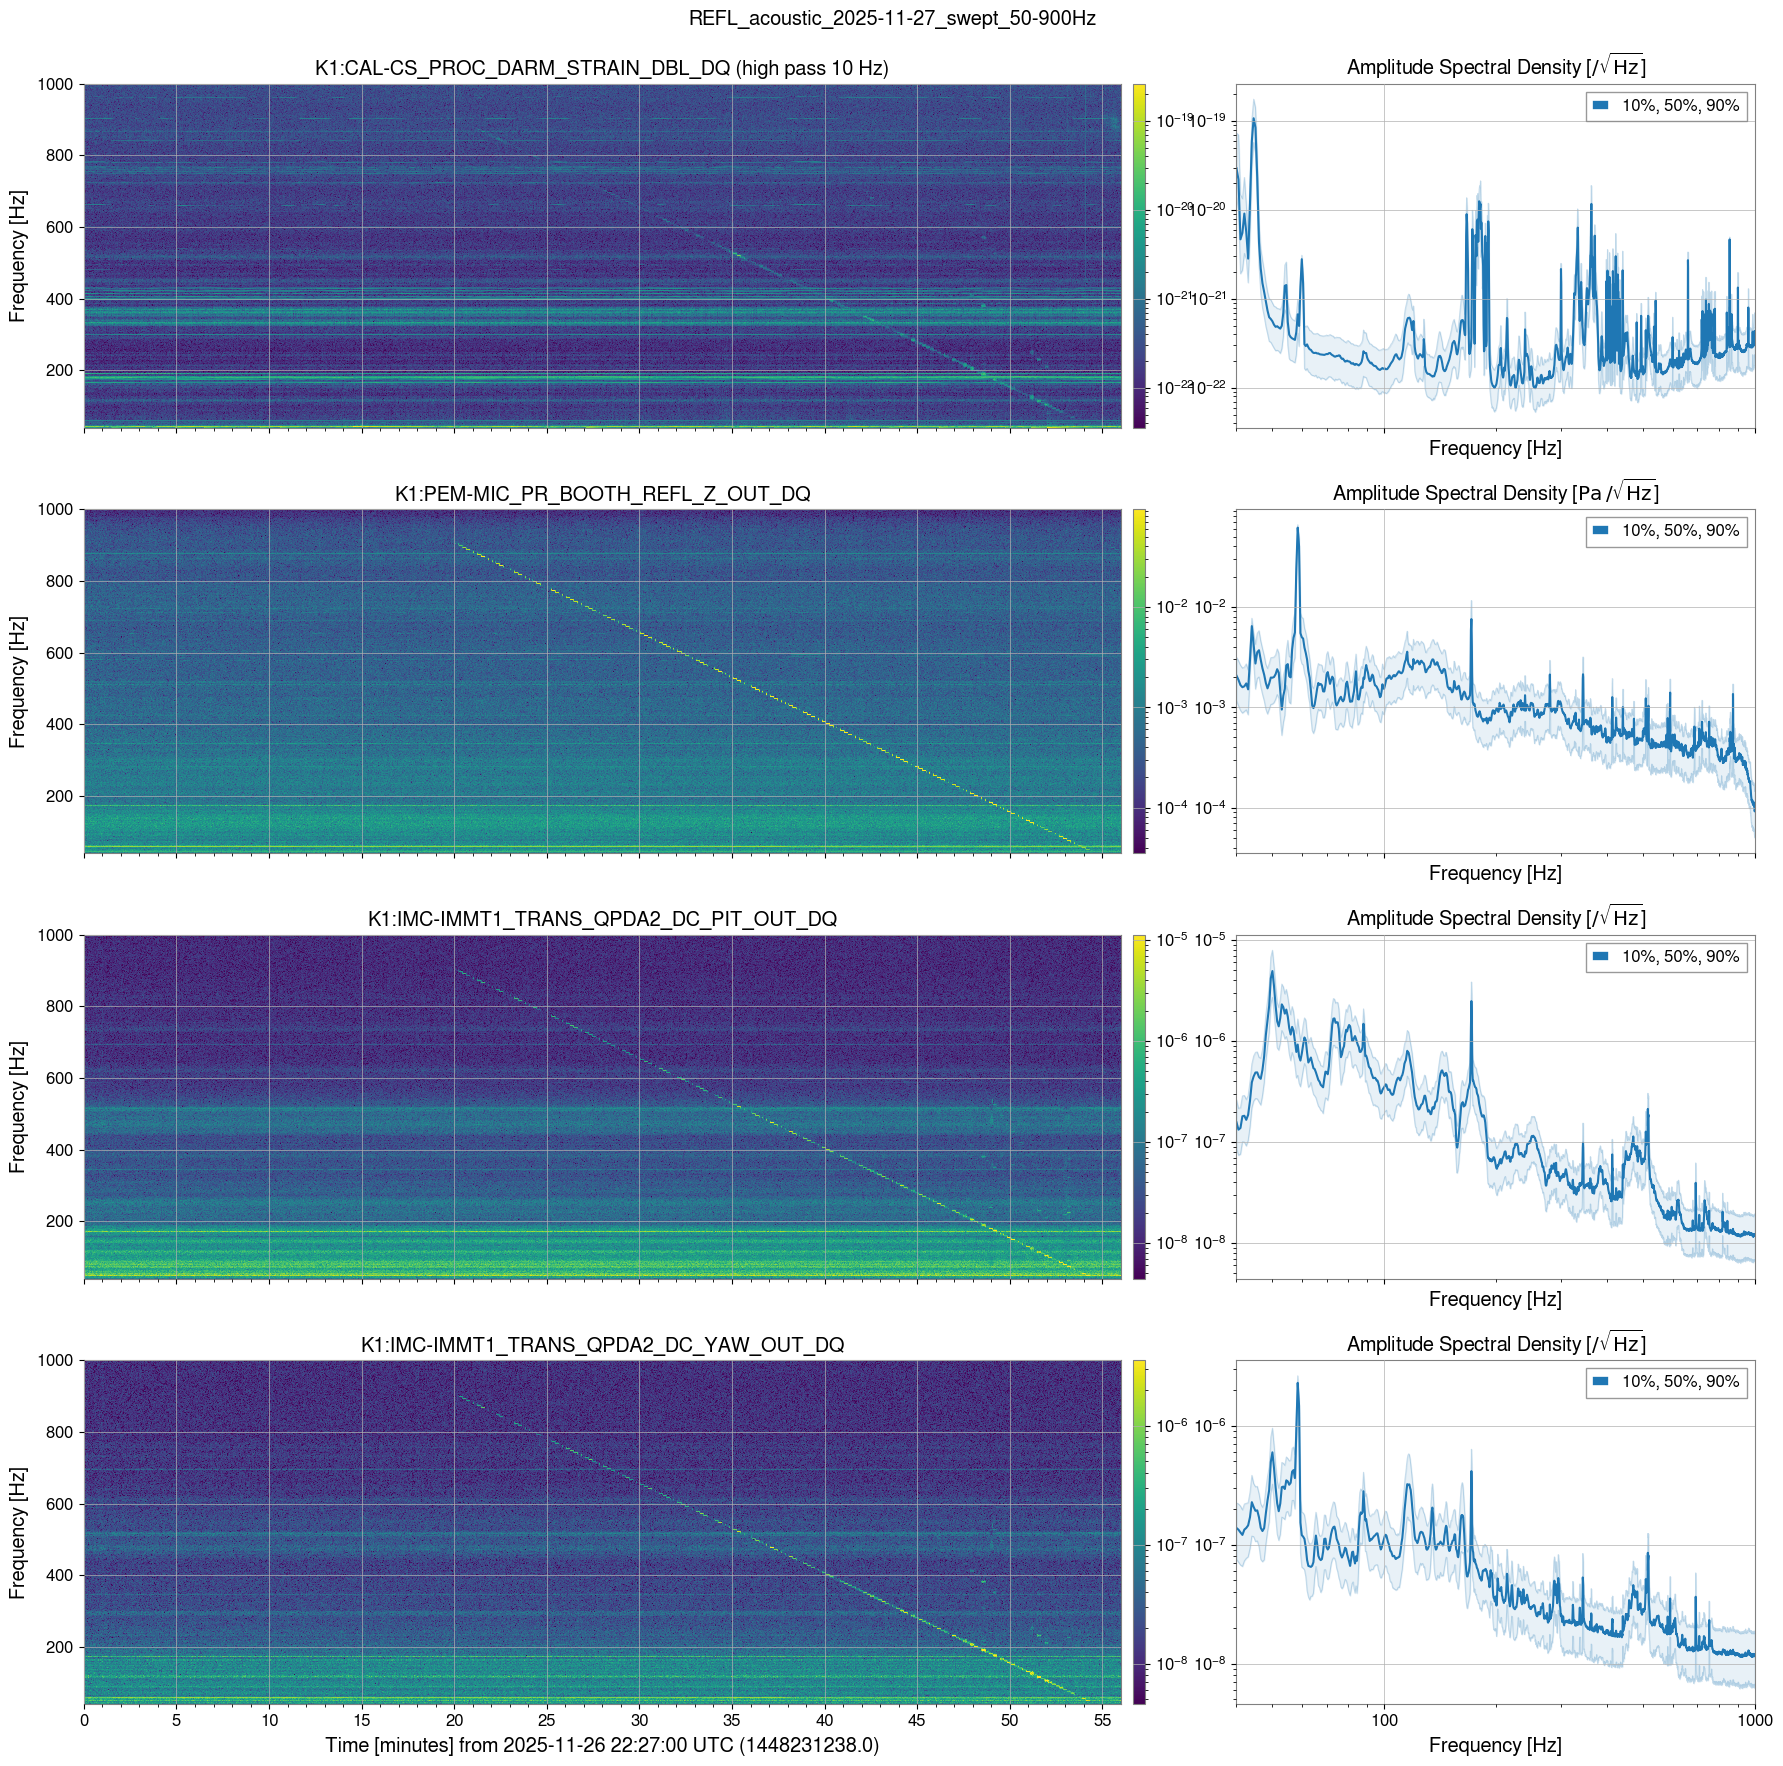
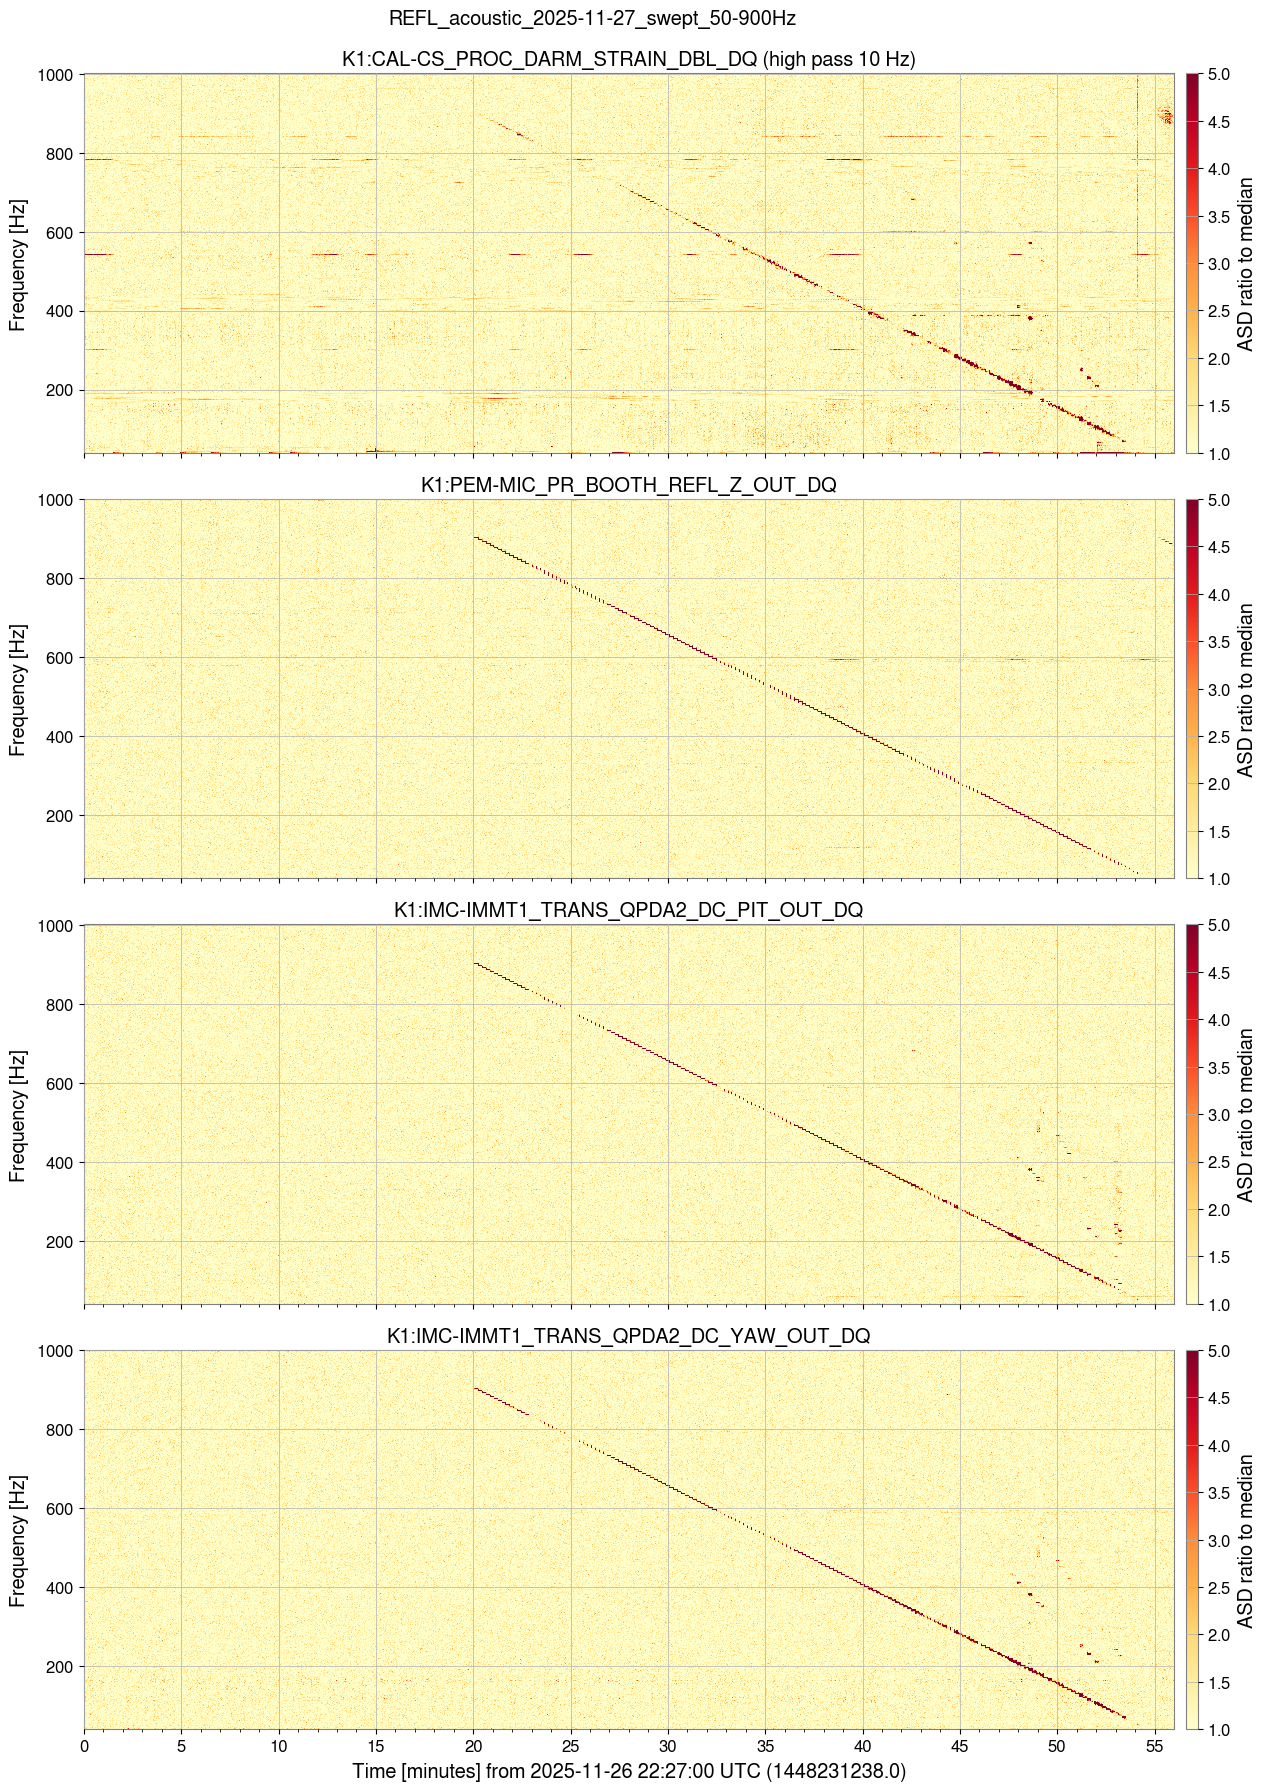
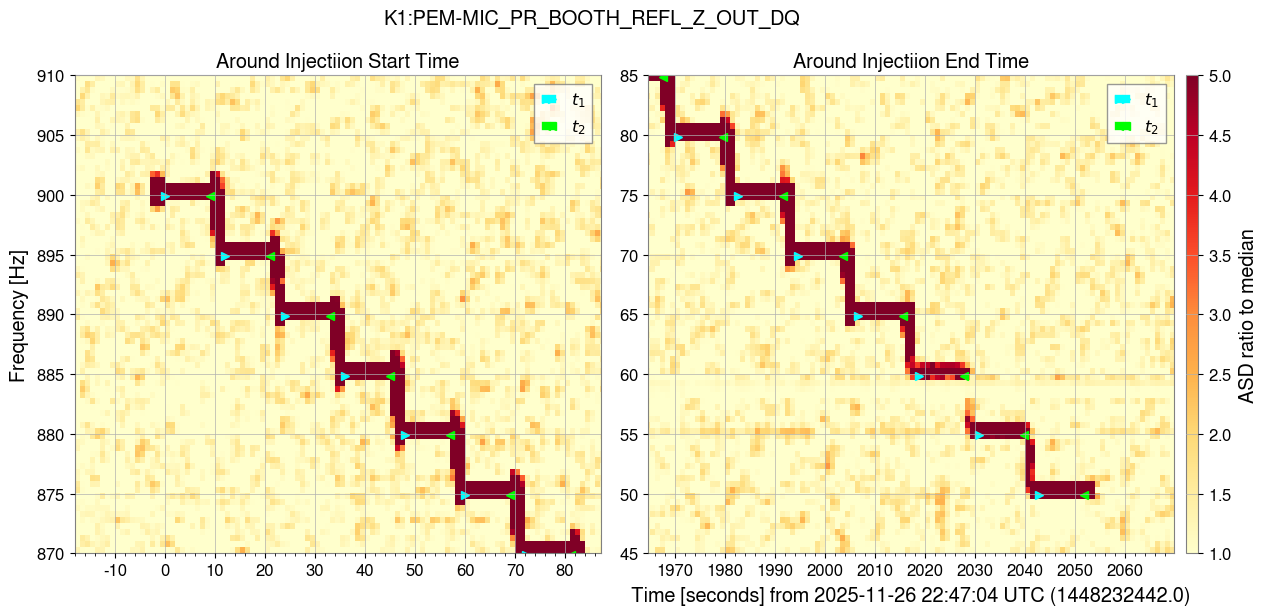
4. Acoustic injection to REFL
11/27 07:47:00 - 08:22:00 (JST)
EXC : K1:PEM-EXCITATION_MCF0_RACK_14_EXC
REF : K1:PEM-MIC_PR_BOOTH_REFL_Z_OUT_DQ
Info : REFL 50 - 900 Hz 171 point 5 Hz resolution 100 cnt excitation
The 5Hz step looks to be not enough


I analyzed the shaker injection data of
5. Acoustic injection to OMC
11/27 08:22:00 - 08:57:00 (JST)
EXC : K1:PEM-EXCITATION_SR3_RACK_6_EXC
REF : K1:PEM-MIC_OMC_BOOTH_OMC_Z_OUT_DQ
Info : OMC 50 - 900 Hz 171 point 5 Hz resolution 100 cnt excitation

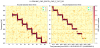

Analysis for
1. Shake injection to TMSX table EXC1
11/27 12:18:30 - 12:32:00 (JST)
EXC : K1:PEM-EXCITATION_EX0_RACK_1_EXC
REF : K1:PEM-PORTABLE_EXC_RACK_EX0_ADC0_DSUB25_OUT_DQ
Info : TMSX EXC1 1 - 10 Hz 10 points 1 Hz resolution 60 seconds at one point 500cnt excitation
(But from my eye, the reference accelerometer response was not good maybe due to the position)
Any significant excess was not found in the strain. (Somehow, the upper limit is larger than the sensitivity in the plot. I need to check my code.)
Some small excesses were found in the QPDs, but they were below the analysis threshold (1.5 times the 90th percentile)

.png)
.png)
.png)
.png)
.png)
.png)
.png)
Analysis for
2. Shake injection to TMSX table EXC1
11/27 12:32:00 - 12:38:00 (JST)
EXC : K1:PEM-EXCITATION_EX0_RACK_1_EXC
REF : K1:PEM-PORTABLE_EXC_RACK_EX0_ADC0_DSUB25_OUT_DQ
Info : TMSX EXC1 10 - 50 Hz 9 points 5 Hz resolution 30 seconds at one point 500cnt excitation
Any significant excess was not found in the strain.
Peaks around 40 Hz in the QPDs look like due to optical table vibration.

.png)
.png)
.png)
.png)
.png)
.png)
.png)
Analysis for
3. Shake injection to TMSX table EXC2
11/27 12:38:00 - 12:45:00 (JST)
EXC : K1:PEM-EXCITATION_EX0_RACK_2_EXC
REF : K1:PEM-PORTABLE_EXC_RACK_EX0_ADC0_DSUB26_OUT_DQ
Info : TMSX EXC2 10 - 50 Hz 9 points 5 Hz resolution 30 seconds at one point 500cnt excitation
(From my eye, wide area injection can be performed from the accelerometer response)
A 40 Hz peak was excited in the strain during the 50 Hz and 25 Hz injections.
Is it an accidental glitch? or a real coupling?

.png)
.png)
.png)
.png)
.png)
.png)
.png)
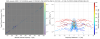
Analysis for
4. Shake injection to TMSX table EXC2
11/27 12:45:00 - 12:58:00 (JST)
EXC : K1:PEM-EXCITATION_EX0_RACK_2_EXC
REF : K1:PEM-PORTABLE_EXC_RACK_EX0_ADC0_DSUB26_OUT_DQ
Info : TMSX EXC2 1 - 10 Hz 10 points 1 Hz resolution 60 seconds at one point 500cnt excitation
Any significant excess was not found in the strain.
Also, no significant excess was found at 1-10 Hz in the QPD, but (almost) due to the harmonics of the shaker vibration itself, some overestimated projections are found over 10 Hz.

.png)
.png)
.png)
.png)
.png)
.png)
.png)
.png)
.png)
.png)
.png)
.png)
.png)
.png)
.png)
.png)
.png)
.png)
.png)
.png)
.png)
.png)
.png)
.png)
.png)
.png)
.png)
.png)
.png)
.png)
.png)
.png)
.png)
.png)
.png)