The arm transmission power and POP signal decrease during the observation runs (klog #34664).
We investigated whether this issue can be explained in terms of arm round-trip loss and power recycling cavity (PRC).
Method:
The finesse of the X and Y arm are given by
F_x = np.pi * np.sqrt(r_ITMX * r_ETMX) / (1 - r_ITMX * r_ETMX)
F_y = np.pi * np.sqrt(r_ITMY * r_ETMY) / (1 - r_ITMY * r_ETMY)
where r_ITMX and r_ETMX are the amplitude reflectivities of ITMX and ETMX, respectively, and r_ITMY and r_ETMY are those of ITMY and ETMY.
Given the finesse values, r_ITMX * r_ETMX and r_ITMY * r_ETMY can be determined.
The power recycling gain (PRG) is given by
G = (t_R / (1 - r_R * r_com))^2
where r_R is the amplitude reflectivity of power recycling mirror (PRM), t_R is the amplitude transmissivity of PRM, and r_com is the amplitude reflectivity of compound mirror formed by both arm cavities.
r_com can be obtained by assuming a value of r_R and using the measured PRG.
r_com is given by
r_com = 1/2 * (- r_ITMX + t_ITMX^2 * r_ETMX / (1 - r_ITMX * r_ETMX) - r_ITMY + t_ITMY^2 * r_ETMY / (1 - r_ITMY * r_ETMY))
By substituting r_ITMX and r_ITMY, calculated from finesse, together with r_com, obtained from the PRG, into the above equation, the relation between r_ETMX and r_ETMY can be derived.
Therefore, the relation between the round-trip losses, T_ETMX = np.sqrt(1 - r_ETMX^2) and T_ETMY = np.sqrt(1 - r_ETMY^2), can be evaluated.
Results:
We assume r_R = np.sqrt(0.9) and use the measured finesse from klog #34456 and klog #34458, and the measured PRG from klog #34664.
The PRG was estimated as the arm transmission power divided by 10.
Furthermore, we assume the PRC loss before the signal reduction is 3 % based on klog #33307.
The measured finesse values were F_x = 1364.5 and F_y = 1271.8.
Although the PRG estimated from the X and Y arm transmission powers should be the same, they were found to differ.
Therefore, we use the following averages, where G_before and G_after are the PRG before and after the signal reduction, respectively:
G_before = (11 + 10.5) / 2 = 10.75
G_after = (10.4 + 9.8) / 2 = 10.1
Taking into account the PRC loss, r_com is given by
r_com = np.sqrt(1 - T_com + T_PRC)
where T_com is the loss of the arm compound mirror without the PRC loss and T_PRC is the PRC loss.
Note that T_com is calculated using G_before and G_after.
If the PRC loss before the signal reduction is 3 %, it increases to 3.26 % due to the POP signal decreasing from 13.7 to 12.5.
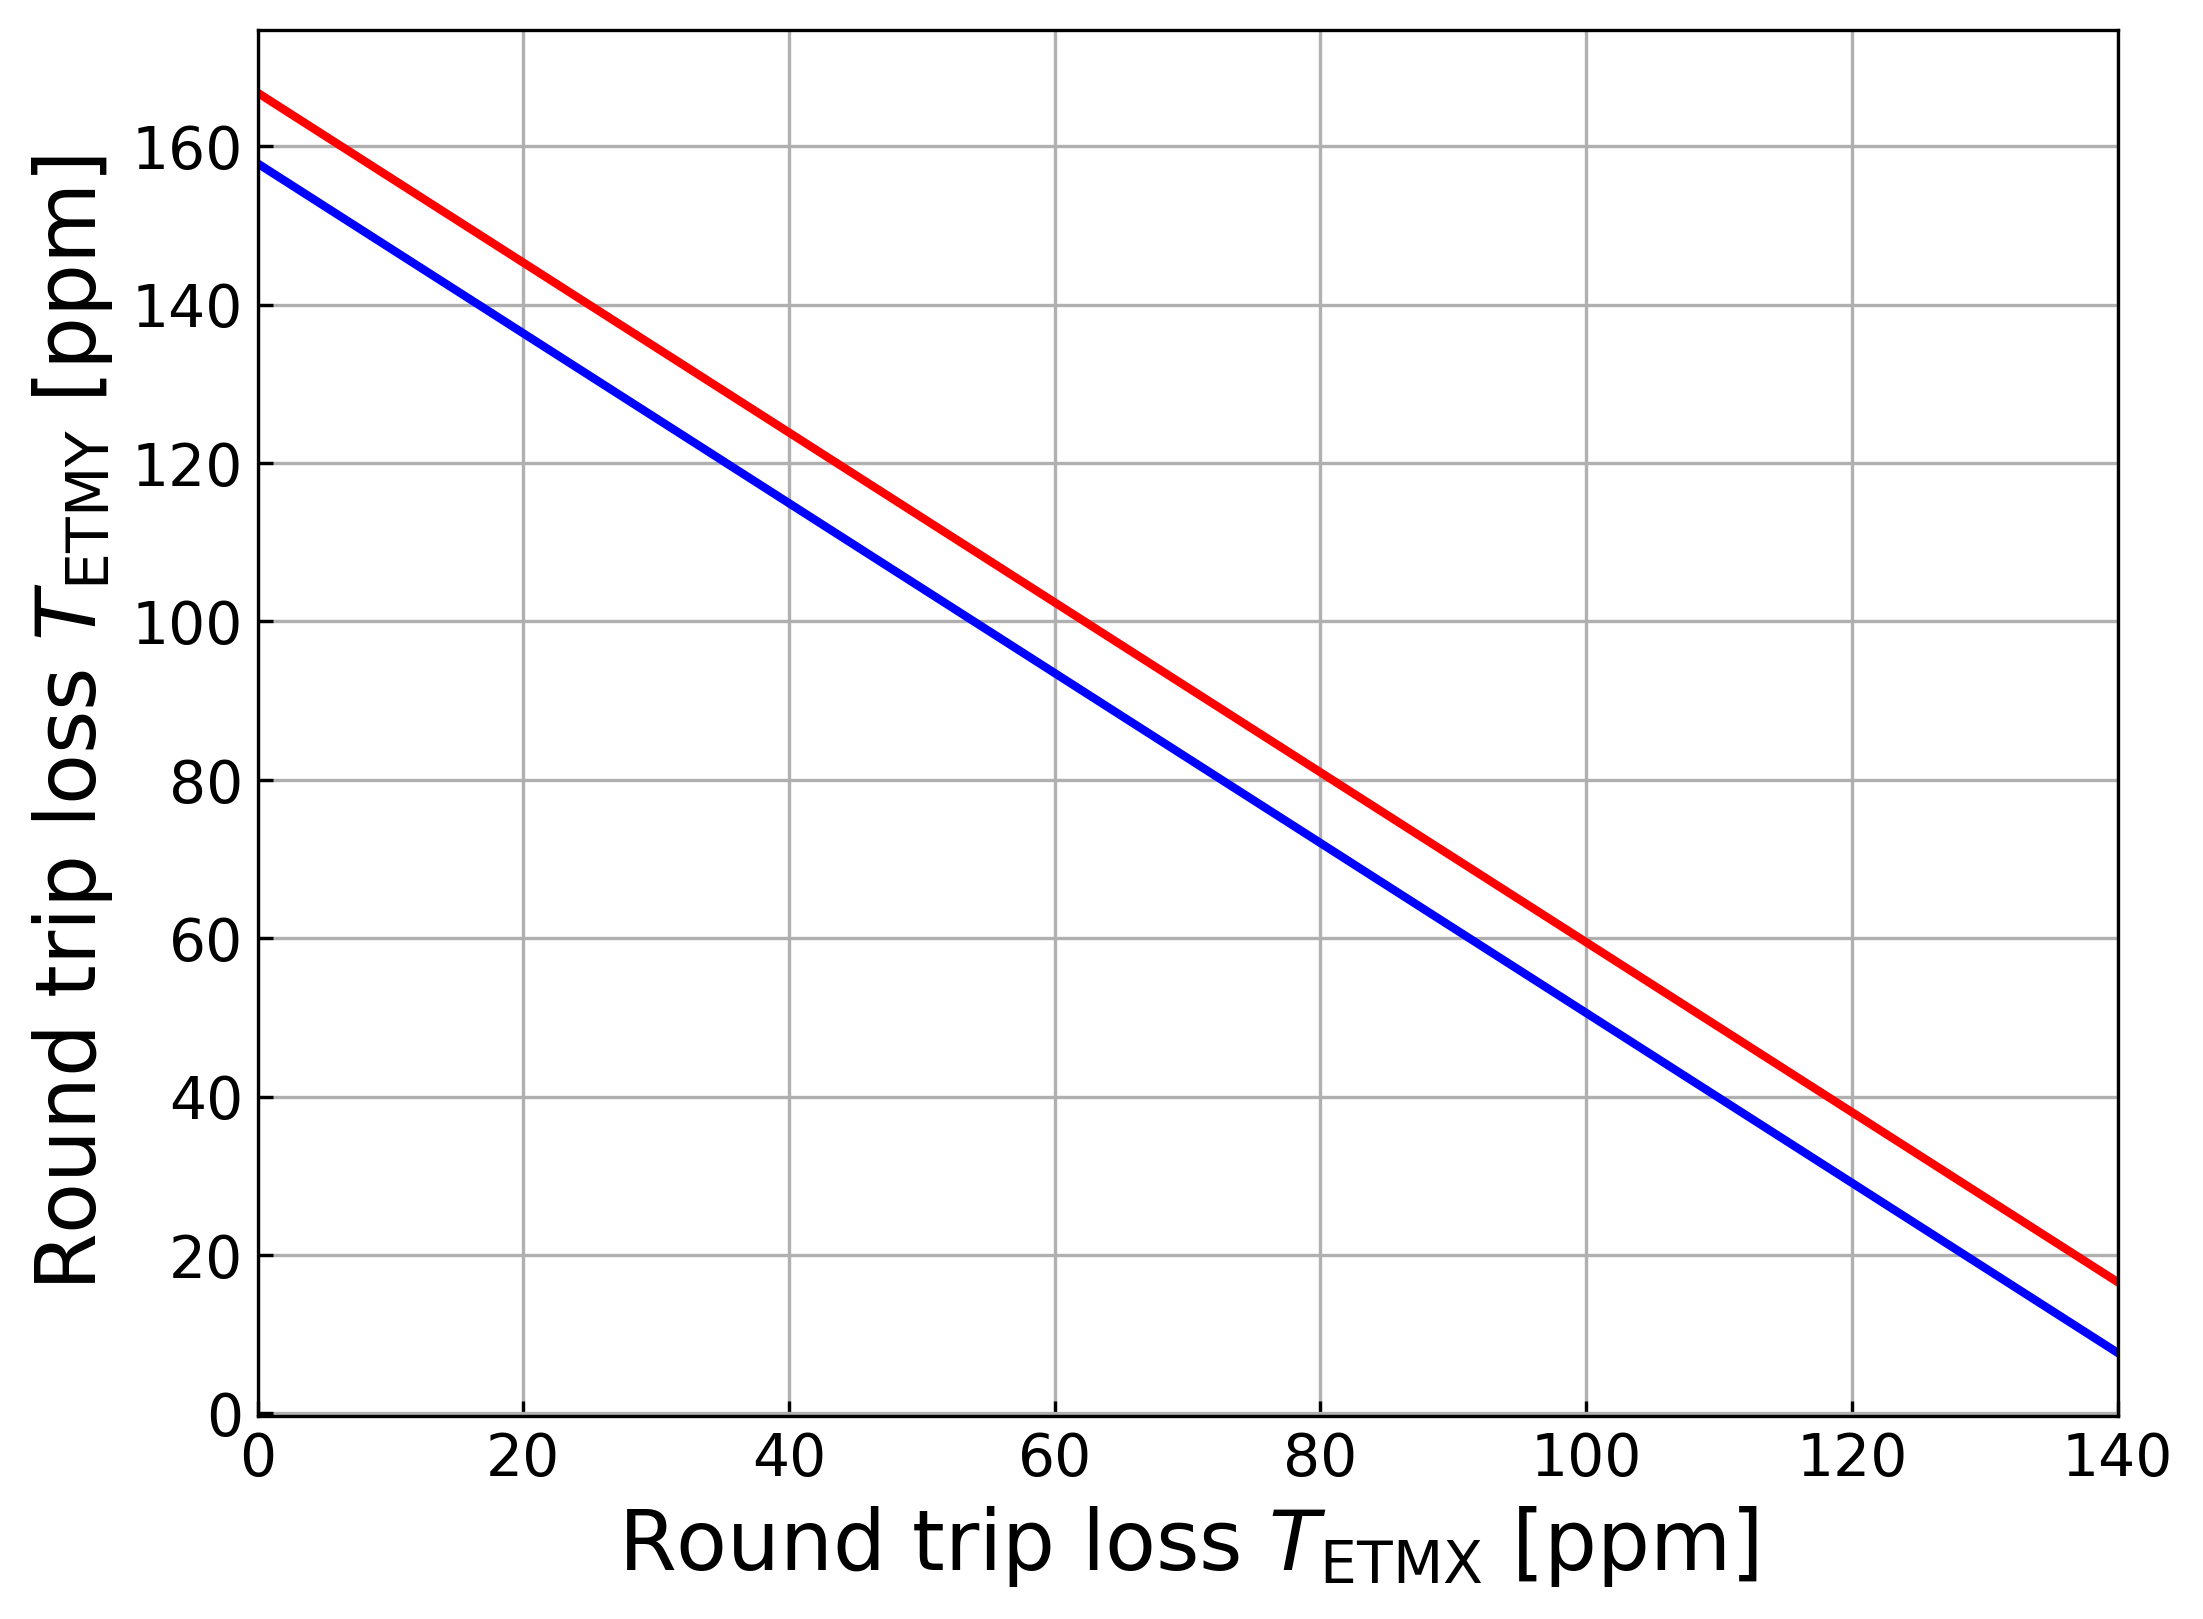
Considering this increase in the PRC loss, the relation between T_ETMX and T_ETMY both before and after the signal reduction is shown in Fig.1.
The blue line indicates the round-trip losses before the signal reduction, while the red line represents those after the signal reduction.
The round-trip losses increase as the PRC loss increases.
Here, we examine the validity of these results.
For example, before the signal reduction, T_ETMX = 75.0 ppm corresponds to T_ETMY = 77.4 ppm from Fig.1.
After the signal reduction, if T_ETMX increases by 5 ppm to 80.0 ppm, T_ETMY becomes 80.9 ppm.
In this situation, the estimated ITM transmissivities are T_ITMX = 0.4520 % and T_ITMY = 0.4851 % before the signal reduction, and T_ITMX = 0.4515 % and T_ITMY = 0.4848 % after the signal reduction.
These values are consistent with the measured ITM transmissivities, T_ITMX = 0.44 % and T_ITMY = 0.48 %, as reported in JGW-G2415589.

Abstract:
We summarize our discussion on the loss estimation.
We conclude that the calculated increase of loss is plausible and point out the possibility that this increase originates from molecular layer formation on the mirror surface.
Detail:
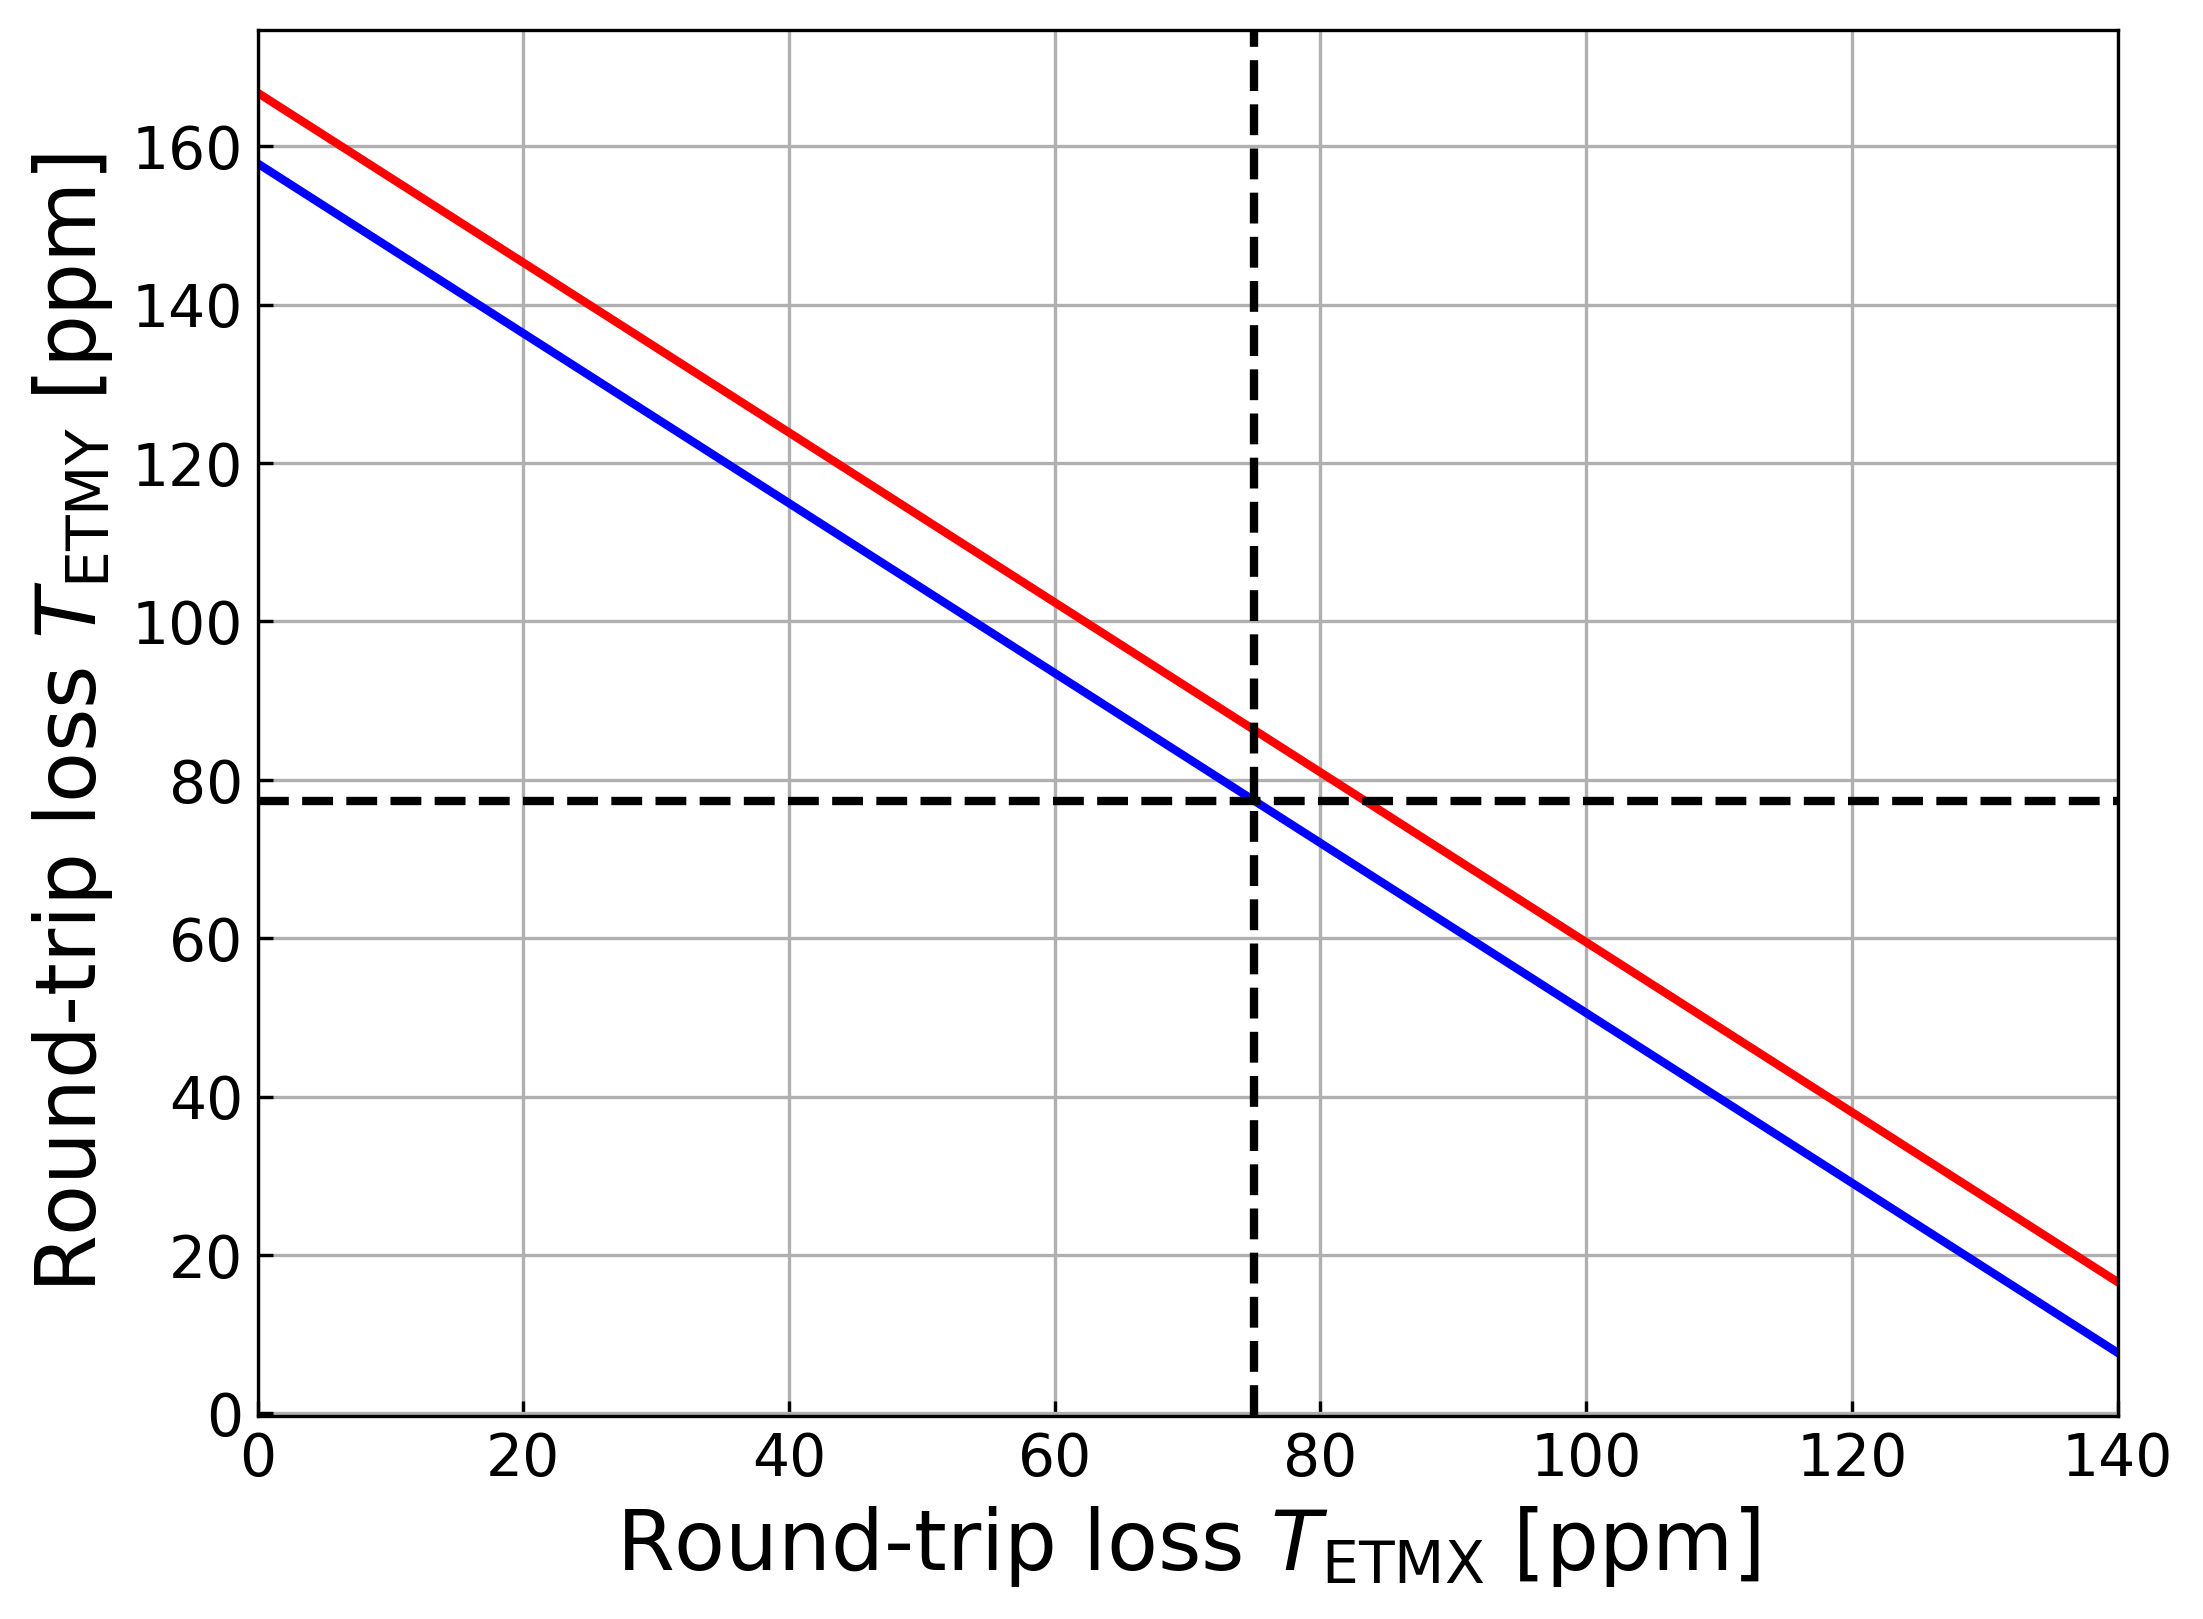
Figure attached to this report shows the round-trip loss before the signal reduction in the previous report, with an additional black dashed line.
Since we consider a model that assumes the round-trip loss increases in both the X and Y arm, the portion of the red line located in the upper right region, bounded by the black dashed line, represents the possible range of losses after the signal reduction.
We examine whether this range is reasonable in terms of the finesse.
Here, we add the assumption that the reflectivity of ITM does not change.
When considering the situation where only the X arm round-trip loss increases, the intersection of the horizontal black dashed line and the red line corresponds to the maximum loss.
At this point, T_ETMX = 83.3 ppm.
If T_ITMX = 0.4520 % remains the same before and after the signal reduction, the finesse becomes F_x = 1362.0 because T_ETMX increases from 75.0 ppm to 83.3 ppm.
The finesse value is feasible considering the error.
Likewise, for the Y arm, if T_ITMY = 0.4851 % remains the same, the finesse becomes F_y = 1269.5 due to the increase of T_ETMY from 77.4 ppm to 86.3 ppm.
The finesse value is also plausible within the measurement error.
We also examine whether the change in round-trip loss obtained from the calculation can be explained from the perspective of losses caused by molecular layer formation on the mirror surface, as reported in the PhD thesis.
The measured speed of the molecular layer formation was 25.5 nm/day.
According to klog #34664, the signal reduction was observed for about 20 days.
Therefore, the thickness of the molecular layer would increase by approximately 0.5 um.
The measured imaginary part of the refractive index of the molecular layer was (2.18 ± 1.81) * 1e-7, approximately equal to that of N_2 (2e-7) as shown in Fig 5.3.
Assuming this value, the decrease of the ETM reflectivity with the refractive index of N_2 in Fig 5.3 of this thesis shows the increase of loss by a few ppm.
Thus, our loss estimation seems consistent with the results of this thesis.
The measurement results of the signal reduction during the observation runs can be consistently explained if the PRC loss increases from 3 % to 3.26 %, the round-trip loss simultaneously increases from 76.2 ppm (X arm: 75.0 ppm, Y arm: 77.4 ppm) to 80.5 ppm (X arm: 80.0 ppm, Y arm: 80.9 ppm).

N_2 is the complex refractive index defined in the PhD thesis, not nitrogen molecule.
We are considering a situation where water molecules are mainly attached on the mirror surface and form a layer.
I apologize for the potentially misleading expression.